Figures & data
Figure 1. GABRA4 is essential for macrophage antimicrobial responses against mycobacterial infection. (A-F) Survival of bacteria after Mtb (A, D), BCG (B, E), and Mabc (C, F) infection (MOI 1 and 3) in Gabra4 WT and gabra4 CKO BMDMs (A–C) and PMs (D–F). (G) Bacterial load in lungs of Gabra4 WT and gabra4 CKO mice infected with Mtb (5 × 10⁴ CFU) at 10 dpi, BCG (1 × 10⁷ CFU) and Mabc (1 × 10⁷ CFU) at 7 dpi. (H, I) H&E staining of Gabra4 WT and gabra4 CKO mice infected with Mtb (H) and BCG (I) for 21 and 14 days, respectively showing the lung histopathology. Bar graphs show the quantification of results. Scale bar, 20 μm. (J) Bacterial load in control (liposome) and clodronate-treated Gabra4 WT and gabra4 CKO mice lungs after infection with Mabc (1 × 10⁷ CFU) at 7 dpi. Means ± SEM are shown (A–J). The Mann-Whitney U test was used to assess significance. Representatives of three independent experiments are shown. *p < 0.05, **p < 0.01, ***p < 0.001. ns, not significant; Dpi, days post-infection.
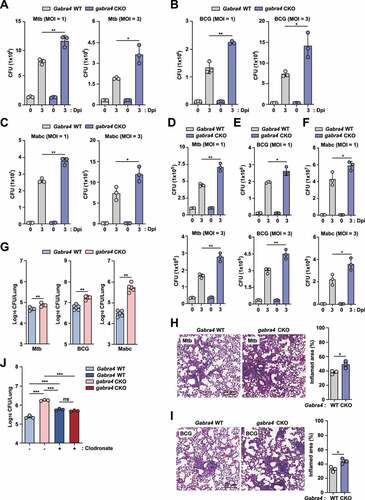
Figure 2. GABRA4 is essential to control pathologic inflammation during mycobacterial infection. (A) qRT-PCR analysis of Il6, Ccl2, and Cxcl5 mRNA expression in the lungs of Mtb-infected Gabra4 WT and gabra4 CKO mice. (B, C) qRT-PCR analysis of Il6, Ccl2, Cxcl5, and Il1b mRNA levels in Mtb- (B, MOI 1) and Mabc- (C, MOI 1) infected Gabra4 WT and gabra4 CKO PMs. (D) IL-6 level in the supernatant after 18 h of Mtb (MOI 1) infection in Gabra4 WT and gabra4 CKO BMDMs or PMs. (E) Ly6G-stained neutrophils in lung tissues from Gabra4 WT and gabra4 CKO mice infected with Mtb (5 × 10⁴ CFU) at 21 dpi. Scale bar, 25 μm. (F) Gabra4 WT or gabra4 CKO mice were infected with Mabc (1 × 10⁷ CFU) at 7 dpi and treated with the neutrophil-specific anti-Ly6G (clone 1A8) or isotype control (clone 2A3) antibody. Bacterial burden in lung tissues. Means ± SEM (A, D, and F) or ± SD (B, C, and E right). Mann-Whitney U test (A), two-way ANOVA (B, C), unpaired t-test (D, E right), or one-way ANOVA (F) was used to assess significance. The data shown are representative of three independent experiments. *p < 0.05, **p < 0.01, ***p < 0.001. ns, not significant; Un, uninfected.
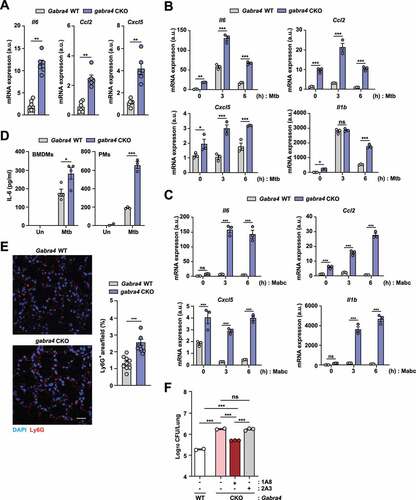
Figure 3. Regulation of autophagy and phagosomal maturation of Mtb by GABRA4 in macrophages. (A) Western blot of LC3 in Mtb-infected BMDMs from Gabra4 WT and gabra4 CKO mice. (B, C) Gabra4 WT and gabra4 CKO BMDMs transduced with retroviral pBABE-puro mCherry-EGFP-LC3B were infected with Mtb (MOI 5) and analyzed for LC3 dots by confocal microscopy. Shown are the representative images (B) and numbers of yellow (autophagosomes) and red (autolysosomes) LC3 dots per cell (C). Scale bar, 5 μm. (D) Gabra4 WT and gabra4 CKO BMDMs infected with Mtb-ERFP (MOI 5) for LC3 and DAPI (green and blue, respectively) staining. Representative confocal micrographs of Mtb-ERFP colocalization with LC3. Scale bar, 5 μm (left). Colocalization of Mtb-ERFP and LC3 are quantified and shown in graphs (right). (E) Quantitation of colocalization of Mtb-ERFP with LC3. (F) Gabra4 WT and gabra4 CKO BMDMs infected for 18 h with Mtb-ERFP (MOI 5) were stained with LAMP1. Quantitation of colocalization of Mtb-ERFP with LAMP1. (G) Gabra4 WT and gabra4 CKO PMs were infected with Mtb (MOI 1) for the indicated times and the expression levels of Gabarap and Gabarapl1 were analyzed by qRT-PCR. Results shown are means ± SD (C, E–G). Two-tailed Student’s t-test (C, E, F) or two-way ANOVA (G) was used to assess significance. Data are representative of three independent experiments. *p < 0.05, **p < 0.01, ***p < 0.001; ns, not significant.
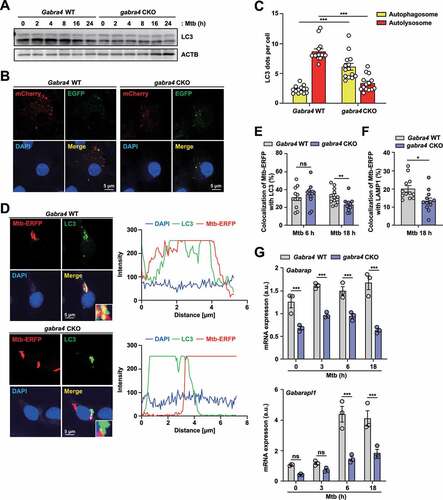
Figure 4. GABRA4 regulates autophagy via Ca2+-mediated AMPK signaling, which is necessary for antimicrobial responses, in macrophages. (A) BMDMs from Gabra4 WT and gabra4 CKO mice were incubated with Fluo-4/AM before infection with Mtb (MOI 5). Representative images. Scale bar, 25 μm (top). Quantitative data of Fluo-4/AM intensity (bottom). (B) Gabra4 WT and gabra4 CKO BMDMs infected with Mtb (MOI 3) for the indicated times were used to detect phospho-AMPK and ACTB levels by western blotting. (C) Confirmation of shRNA-mediated knockdown of Ampk in WT PMs transduced with shNS or shAmpk. (D-G) Gabra4 WT and gabra4 CKO PMs were transduced with shNS or shAmpk, as confirmed in (C), and infected for 18 h with Mtb (MOI 1) to measure the mRNA levels of Foxo3 (D), Map1lc3a (E), Gabarap (F), and Gabarapl1 (G). (H, I) Intracellular survival after Mtb infection (MOI 1) in Gabra4 WT and gabra4 CKO BMDMs transduced with shNS or shAmpk (H) and treated without or with bafilomycin A1 (Baf-A1, 200 nM) (I). Data are presented as means ± SD (A bottom, C-I). Two-tailed Student’s t-test (A bottom), unpaired t-test (C), or one-way ANOVA (D–I) was used to assess significance. Representatives of three independent experiments are shown. *p < 0.05, **p < 0.01, ***p < 0.001. Un, uninfected; Dpi, days post-infection; ns, not significant.
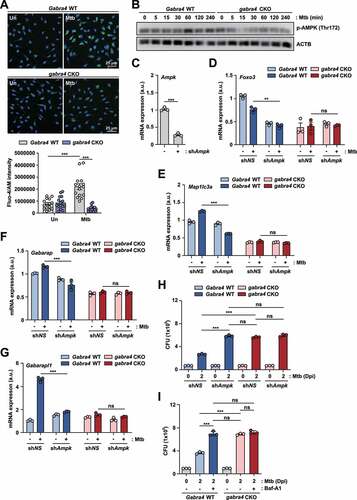
Figure 5. GABRA4 is required for mitochondrial respiration and mtROS generation, activating autophagy and antimicrobial responses during mycobacterial infection. (A, B) OCR profile (A) and parameters (B) in Mabc-infected PMs from Gabra4 WT and gabra4 CKO mice. (C) PMs from Gabra4 WT and gabra4 CKO mice were infected with Mtb (MOI 1), and the mRNA levels of Uqcrc1 and Atp5a1 were measured by qRT-PCR. (D, E) Gabra4 WT and gabra4 CKO BMDMs were infected with Mtb (MOI 5) for 4 h, before MitoSOX (red) and DAPI (for nuclei; blue) staining. (D) Representative images of MitoSOX staining (scale bar 25 μm) are shown. (E) Relative fluorescence of MitoSOX. (F, G) Gabra4 WT and gabra4 CKO BMDMs were pretreated with MitoTEMPO (50 μM) for 24 h, and cells were infected with Mtb-ERFP (MOI 5) for 18 h. (F) Representative images are shown. Scale bar, 5 μm. (G) Quantification of colocalization of Mtb-ERFP with LC3. (H) Intracellular survival after Mtb infection (MOI 1) in Gabra4 WT and gabra4 CKO BMDMs treated without or with MitoTEMPO (100 μM). Means ± SEM (B, C, E, and G) or ± SD (H). The two-tailed Student’s t-test (B, C, E, and G) or one-way ANOVA (H) was used to evaluate significance. Representative of three independent experiments. *p < 0.05 and ***p < 0.001. Un, uninfected; Dpi, days post-infection; CCCP, carbonyl cyanide 3-chlorophenylhydrazone; SC, solvent control. Basal Resp, basal respiration; Max Resp, maximal respiration; ATP prod, ATP production; SRC, spare respiratory capacity; NMOC, non-mitochondrial oxidative capacity; Proton leak, protoen leakage; ns, not significant.
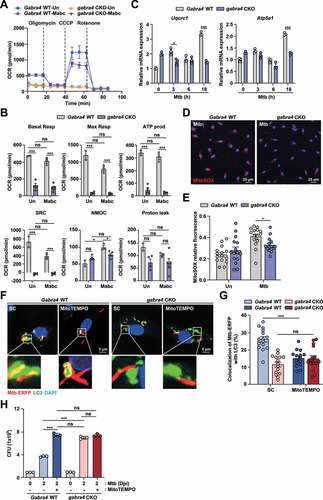
Figure 6. GABRA4 signaling is essential for GABA-mediated antibacterial autophagy in macrophages. (A, B) Intracellular survival of Mtb (MOI 1) after 3 days in BMDMs (A) and PMs (B) from Gabra4 WT and gabra4 CKO mice in the presence of GABA or isoniazid (INH, 0.5 μg/mL). (C) Gabra4 WT and gabra4 CKO BMDMs treated with GABA (100 μM) were stained for LC3. The number of LC3 dots per cell is shown. (D-F) BMDMs from Gabra4 WT and gabra4 CKO mice were infected with Mtb-ERFP (MOI 5) in the presence of GABA (100 μM) for 18 h, and stained with LC3 (D, E) or LAMP1 (F). (D) Confocal micrographs. Scale bar, 5 μm. (E) Quantification of colocalization of Mtb-ERFP with LC3. (F) Quantification of colocalization of Mtb-ERFP with LAMP1. (G) Gabra4 WT and gabra4 CKO BMDMs after infection with Mtb (MOI 5) and incubation with GABA (100 μM) for 18 h were subjected to transmission electron microscopy (TEMs). Representative transmission electron micrographs are shown. Scale bar, 1 μm. Means ± SEM (A-C, E, and F). One-way ANOVA (A-C) and two-tailed Student’s t-test (E, F) were used to evaluate significance. Representative of three independent experiments are shown. *p < 0.05, **p < 0.01, ***p < 0.001. ns, not significant; dpi, days post-infection; GABA, γ-aminobutyric acid; INH, isoniazid.
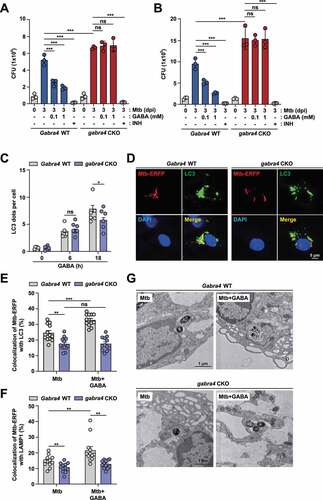
Figure 7. GABRA4 is required for glucose metabolism and optimal aerobic glycolysis in macrophages. (A) PLS-DA score plots acquired from non-targeted metabolite profiling of macrophages from Gabra4 WT and gabra4 CKO mice according to Mtb infection analyzed by GC-TOF/MS (VIP > 1.0, p < 0.05). (B) Heatmap analysis of the concentrations of glycolysis-related metabolites and amino acids. Numbers show the fold changes by an average peak area of each metabolite. Blue and red, metabolites significantly decreased and increased, respectively. Asterisks indicate significantly different metabolites. (C) Metabolic pathways were analyzed based on differentially expressed metabolites. Colored squares (blue-to-red) depict fold changes normalized to the experimental group. (D) Extracellular lactate levels in Gabra4 WT and gabra4 CKO PMs infected for 18 h with Mabc (MOI 3) or Mtb (MOI 3). (E, F) Extracellular acidification profile (ECAR; E) and various parameters (F) in Mabc-infected (18 h) Gabra4 WT and gabra4 CKO PMs. (G, H) Ldha (G) and Hif1a (H) mRNA levels in Mtb (MOI 1)-infected Gabra4 WT and gabra4 CKO PMs. Means ± SEM are shown (B, D, F-H). One-way ANOVA (B), two-tailed Student’s t-test (D), or two-way ANOVA (F-H) was used to evaluate significance. Representative of three independent experiments are shown. *p < 0.05, **p < 0.01, ***p < 0.001, and ****p < 0.0001. ns, not significant; Un, uninfected; 2-DG, 2-deoxy-glucose.
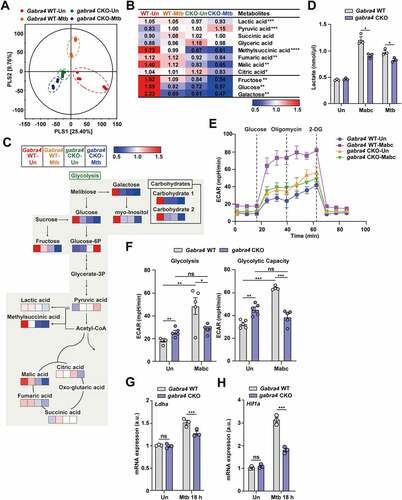
Figure 8. Myeloid GABRA4 is essential for controlling excessive proinflammatory responses in vivo and in vitro. (A) Survival of Gabra4 WT and gabra4 CKO mice injected with LPS (15 or 20 mg/kg, i.p.). (B) Tnf and Il1b mRNA levels in the livers of Gabra4 WT and gabra4 CKO mice injected with LPS (14 mg/kg, i.p.) for 6 h. (C) qRT-PCR of Tnf, Il1b, and Il6 mRNA in Gabra4 WT and gabra4 CKO BMDMs stimulated with LPS (100 ng/mL). (D) ELISA of IL-6 in supernatant after 18 h of LPS (100 ng/mL) stimulation in Gabra4 WT and gabra4 CKO BMDMs. (E) Western blot of phosphorylation of NF-κB and MAPK (ERK, p38, and JNK) in LPS (100 ng/mL) stimulated Gabra4 WT and gabra4 CKO BMDMs. (F) Levels of IL-1β in supernatants from Gabra4 WT and gabra4 CKO PMs sensitized with LPS (100 ng/mL) and stimulated with ATP (5 mM), nigericin (10 μM), and MSU (200 μg/mL). (G) The level of mature IL-1β determined by western blotting of supernatant from LPS (100 ng/mL)-sensitized and nigericin (10 μM)-stimulated Gabra4 WT and gabra4 CKO PMs. IL-1β (precursor) and ACTB were detected in the cell lysates. Means ± SEM are shown (B-D, and F). The log-rank (Mantel–Cox) test (A), two-tailed Student’s t-test (B, D, F), or two-way ANOVA (C) was used to evaluate significance. Data are representative of three independent experiments. *p < 0.05, **p < 0.01, ***p < 0.001. ns, not significant; Un, untreated; MSU, monosodium urate.
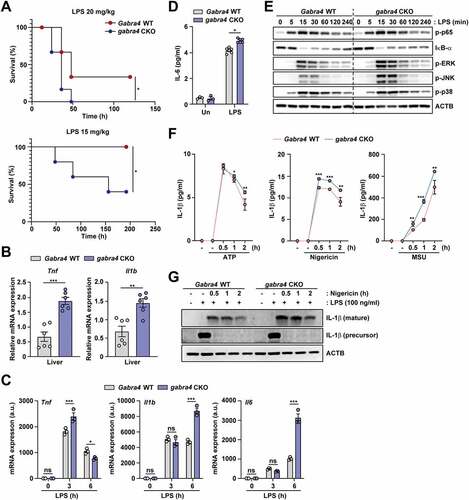
Figure 9. GABRA4 signaling contributes to LPS-induced autophagy activation via the Ca2+-AMPK pathway in macrophages. (A, B) Gabra4 WT and gabra4 CKO BMDMs were stimulated with LPS (100 ng/mL) for 6 h and stained with LC3 (green) and DAPI (for nuclei; blue). (A) Representative microscopic images are shown. Scale bar, 5 μm. (B) Quantitative results of LC3 dots per cell. (C) BMDMs from Gabra4 WT and gabra4 CKO mice were incubated with LPS (100 ng/mL) for 4 h and stimulated without or with ATP (5 mM) for 30 min before staining with LC3. Quantitative data of LC3 dots per cell. (D) BMDMs from Gabra4 WT and gabra4 CKO mice were stimulated for 6 h with LPS (100 ng/mL), and cells were stained with LAMP1. Quantitative data of LAMP1 intensity. (E) Gabra4 WT and gabra4 CKO PMs were treated with LPS (100 ng/mL) for 6 h. Representative TEMs of PMs. Scale bar, 1 μm (left). Quantitative data of autophagic vesicle numbers (right). (F) Western blot analysis of phospho-AMPK and ACTB in Gabra4 WT and gabra4 CKO PMs stimulated with LPS (100 ng/mL). (G) LC3 (green) staining of Gabra4 WT and gabra4 CKO BMDMs treated with BAPTA-AM (BAPTA, 25 μM) and stimulated with LPS (100 ng/mL); DAPI (blue) shows nuclei. Quantitative data of LC3 dots per cell. (H) shNS or shAmpk transduced Gabra4 WT or gabra4 CKO BMDMs were stimulated for 18 h with LPS (100 ng/mL) and the level of IL-1β was determined. Means ± SEM (B–E right, G, and H). The two-tailed Student’s t-test (B-E right, G, and H) was used to evaluate significance. Representatives of three independent experiments are shown. *p < 0.05, **p < 0.01, ***p < 0.001. Un, uninfected; ns, not significant.
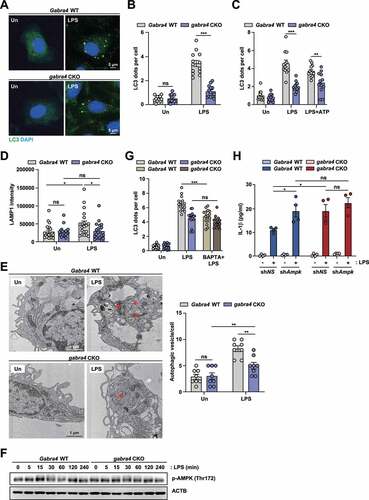
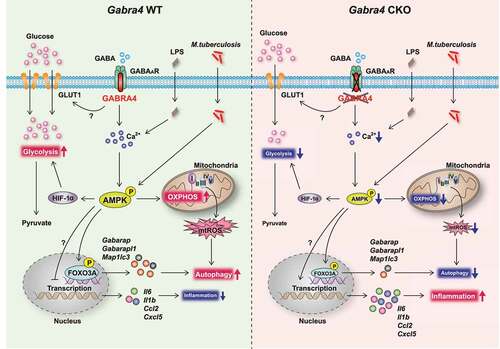
Figure 10. Schematic of the role of GABRA4 in modulating innate immune responses. GABRA4 activates autophagy from transcriptional level to autophagic flux via the Ca2+-AMPK-FOXO3A pathway, thereby inhibiting inflammation in response to pathogenic or dangerous stimuli. GABRA4-mediated AMPK activation is critical for the orchestration of autophagy, inflammatory responses, mtOXPHOS, and antimicrobial responses. In addition, GABRA4 is required for the maintenance of aerobic glycolysis via AMPK-dependent HIF-1α signaling. Therefore, GABRA4, via Ca2+-AMPK signaling, coordinates autophagy, inflammation, and innate host defenses.