Figures & data
Figure 1. Structure and diversity of Atg8 family proteins. (A) Structural organization of the Atg8/LC3/GABARAP proteins. (B) Neighbor-net analysis of 36 ATG8 nucleotide sequences from 14 eukaryotic species. The network was calculated with Splitstree4 applying the general time reversible (GTR) distance matrix using a conserved 332 nt position calculated with Gblocks from an original alignment of 666 nt positions in MUSCLE. Species labels are colored according to a major grouping into plant (green), fungal (orange), animal (black) or protozoan (blue) lineages. (Hs, Homo sapiens; Sc, Saccharomyces cerevisiae; D.m, Drosophila melanogaster; C.e, Caenorhabditis elegans; Dr, Danio rerio; At, Arabidopsis thaliana, Mp, Marchantia polymorpha; Cr, Chlamydomonas reinhardtii; Pt, Paramecium tetraurelia; Dd, Dictyostelium discoideum; Pf, Plasmodium falciparum; Pt, Phaeodactylum. tricornutum; Tv, Trichomonas vaginalis)
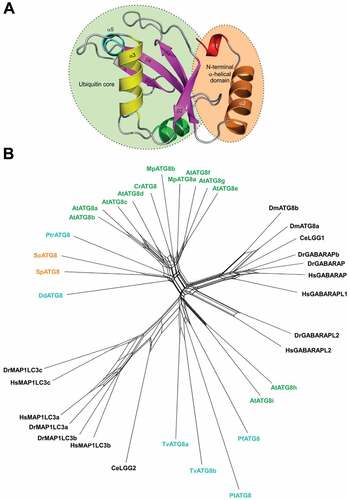
Figure 2. Sequence alignment of Atg8/LC3/GABARAP proteins. Sequence alignment of the Atg8-family members from 6 model species – yeast (Saccharomyces cerevisiae), nematoda (Caenorhabditis elegans), insects (Drosophila melanogaster), bony fish (Danio rerio), human (Homo sapiens) and plant (Arabidopsis thaliana). Secondary structure elements from the human LC3B (PDB ID 2ZJD) are shown at the top (H – α-helices, E – β-strands, L – long loops; rainbow color-code for α-helices – red, orange, yellow, green and cyan, all β-strands are in magenta). Every tenth residue in each sequence is marked bold/underlined, the catalytic Gly is marked green. The identity scores (* for identical residues,: for very similar residues, for analogous residues, space for residues without any similarity, - for gaps) are presented below each group of the Atg8/LC3/GABARAP. For the yeast Atg8 proteins, annotated UniProt entries for 11 yeast species Atg8 sequences were aligned to generate the identity score. The residues (or their absence) separating GABARAP/Atg8 and LC3 protein subtypes are marked red and blue, respectively. The consensus string for all 38 proteins aligned is presented at the bottom of alignment (named TOTAL SIMILARITY). The residues showed conservation are grouped within the following classes: residues participating in the protein folding (grey); residues forming HP1 (yellow); residues forming HP2 (light green); and residues forming UDS (cyan). The key residues indicating LC3 and Atg8/GABARAP subtypes difference are marked by green X.
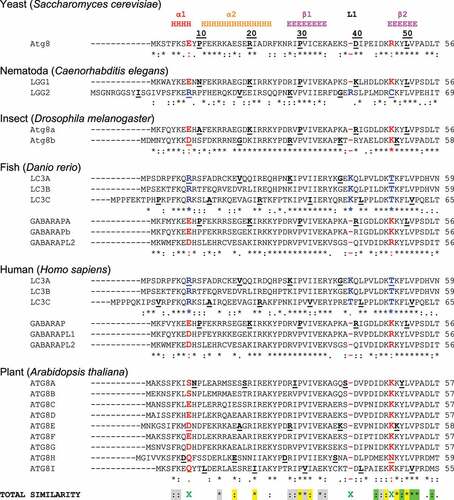
Figure 2. (Continued).
Figure 3. Atg8/LC3/GABARAP interactions with their partners. (A). Structure of p62/ SQSTM1-LIR:LC3B complex (PDB ID 2ZJD). Human LC3B is shown as a semi-transparent surface with the structural elements (α-helices and β-strands) visible. Murine p62/SQSTM1-LIR is shown as a main chain (orange) with sidechains of core LIR residues (W340 and L343, red) as sticks. Two hydrophobic pockets of LC3B, accommodating W340 and L343 sidechains, are shown on LC3B surface (HP1 – yellow, HP2 – light green). (B) Alignment of canonical (top) and non-canonical (bottom) LIR motifs with positions of residues indicated on top (from -6 to +8). Negatively charged residues (red), polar residues (magenta) and phosphorylatable residues (green) are indicated over the LIR sequences. The phosphorylatable residues confirmed to be phosphorylated are marked bold and underlined (see Table 1 for details). Residues at positions 0 and +3 within core LIR sequences whose sidechains are accommodated by HP1 and HP2 are boxed. Glutamate residues at position +7, forming additional intermolecular hydrogen bond to Arg/Lys at α-helix α3 in LC3/GABARAP proteins, are marked bold. Note that the enumeration in this work is according to N. Noda with the aromatic residue Θ as position 0, whereas this position is often numbered as +1 in many papers. (C) Interaction sites on Atg8/LC3/GABARAP surface. Left plot: surface representation of LC3B structure (the same orientation as in (A)), showing the main interacting sites - HP1 (yellow) and HP2 (light green), which form the LC3 docking site (LDS). Position of additional interacting site, HP0, is indicated by arrows. The alternative interacting area, the UIM docking site (UDS, including Y-site), is located on the opposite side of the LC3B molecule (right plot). The most relevant residues are colored dark red, additional hydrophobic residues around it are colored orange. (D) Structure of Hfl1 bound to the Y-site/UDS of Atg8 (PDB ID 6AAG). (E) Structural differences between LC3 and GABARAP proteins. (Right) Intramolecular contacts within LC3B (top) and GABARAP (bottom) proteins. Involved residues are presented as sticks, intramolecular hydrogen bonds between these residues are shown as black dashed lines. (Left) Orientation of H27 and K30 sidechains in LC3B (top) and corresponding Y25 and R28 sidechains in GABARAPs (bottom). Cation-π interactions (the non-covalent electrostatic interaction between an electron-rich face of aromatic rings and adjacent cations), stabilizing the specific orientation of Y25/R28 sidechains in GABARAPs are shown as blue dashed lines.
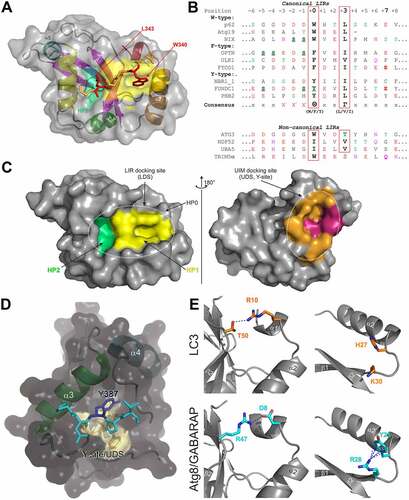
Figure 4. Distribution of known phosphorylation sites on LIR motifs on some mammalian Atg8-interacting proteins. Known positive (green circle with plus sign) or negative effects (red circle with minus sign) of phosphorylation (blue circle) of a particular residue relative to binding to Atg8s indicated. Yellow circle and half-filled green circle with plus sign indicate no regulation of ATG8 binding and positive effect specific to LC3 subfamily binding, respectively. The actual proteins are shown below each site. See also Table 1.
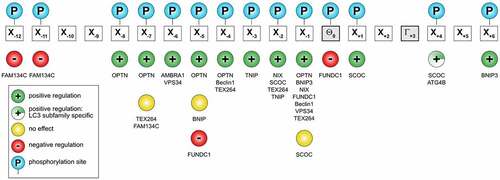
Table 1 Phosphorylation sites within LIR domains of mammalian proteins
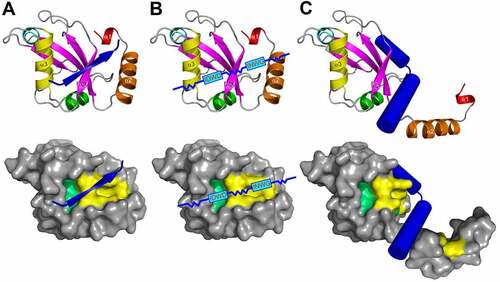
Figure 5. Emerging types of Atg8/LC3/GABARAP interacting motifs and elements: the antiparallel β-strand (A), the shuffled LIR motifs (B), and displacing α-helical structure (C). The interacting elements shown as blue arrows or cylinders on LC3B ribbon diagram (top) and on LC3B surface (bottom, with HP1 and HP2 indicated). The shuffled LIRs motifs are given as sequences in the blue boxes, their structural mechanism with Atg8/LC3/GABARAPs is not known, however, preliminary data indicate their LDS-guided binding.