Figures & data
Figure 1. Micromolar dose of rapamycin and TRPML1 agonist ML-SA1 activate TRPML1-TFEB axis. (A) TFEB staining of HeLa cells after 2 h starvation or treatment with ML-SA1 (20 μM), rapamycin (Rapa) (100 nM or 20 μM) or vehicle control (DMSO). (B) Quantification of cells from A, expressed as percentage of cells with nuclear TFEB (n=3); each color corresponds to 1 experiment, big symbol represent the mean and small symbols the scatter dot plot. Lines show the mean +/- SEM. (C) Lamp1 staining of AGS cells after 4h VacA- or VacA+ incubation followed by 3h of DMSO, ML-SA1 or rapamycin (Rapa) treatment. (D) Western blotting for p70S6K and MTOR phosphorylation after 3h treatment with DMSO, ML-SA1 (20 μM), rapamycin (Rapa, 100 nM) or Torin (1 μM). (E) Graphs show quantification of phospho-proteins normalized to total protein levels (mean +/- SEM of 3 (for p70S6K) or 4 (for mTOR) different experiments).
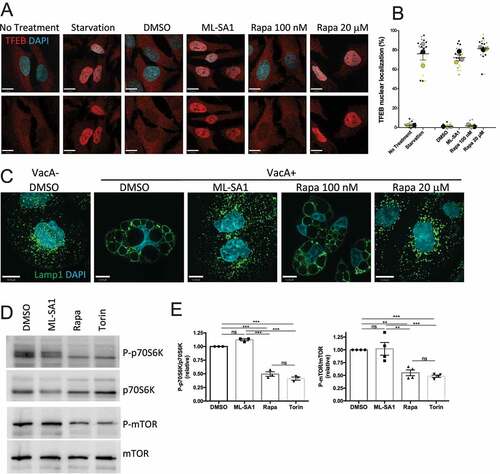
Figure 2. TRPML1-TFEB activation, but not MTOR inhibition, increases autophagy flux. (A) LC3 western blotting of HeLa cells treated with DMSO, ML-SA1 (20 μM) or rapamycin (Rapa, 100 nM) for 4h using actin as loading control. The graph shows quantification of LC3II normalized to actin (mean +/- SEM of 5 different experiments). (B) LC3 staining of cells treated as in (A). Graphs show the autophagosome quantification indicating the number of LC3 puncta/cell (left) and total LC3 staining/cell (right), (n=3; each color corresponds to 1 experiment, big symbol representing the mean and small symbols the scatter dot plot. Lines show the mean +/- SEM). (C) LC3 western blotting of HeLa cells treated with different concentrations of ML-SA1 for 4h using actin as loading control. Graph shows the dose-dependent LC3II induction. (D) LC3 western blotting of cells after 4h treatment with DMSO, ML-SA1 (20 μM) or rapamycin (Rapa, 100 nM), followed with 2 h Bafilomycin A1 (Baf, 100 nM) incubation. The graph shows quantification of LC3II normalized to actin (mean +/- SEM of 3 different experiments). (E) Images of HeLa cells expressing the tandem eGFPRFP-LC3 reporter treated as in (B). Yellow puncta correspond to autophagosomes (AP), red puncta correspond to autolysosomes (AL). Graphs show the number of AP and AL/cell and AL/AP ratio. (F) Lamp1 staining of cells treated as in (B). Graph shows lysosome quantification (total Lamp1 staining/cell, n=3; each color corresponds to 1 experiment, big symbol representing the mean and small symbols the scatter dot plot. Lines show the mean +/- SEM). (G) Lamp1 staining of TRPML1 KO and wild-type MEFs treated with DMSO and ML-SA1 (20 μM). Lysosome quantification performed as is (F).
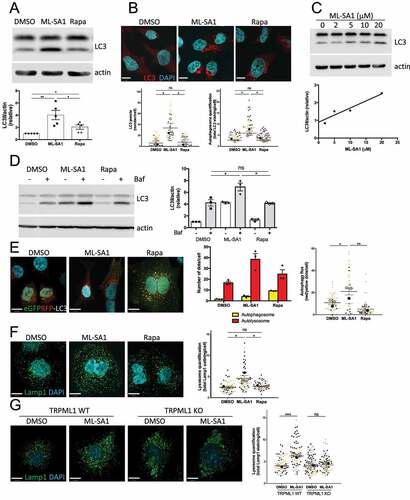
Figure 3. Differential effect of autophagy induction by TRPML1 activation or mTORC1 inhibition on Hp intracellular survival. (A) AGS cells infected with wild-type (VacA+) Hp were incubated with gentamycin to kill extracellular bacteria and treated with ML-SA1 (20 μM), rapamycin (Rapa, 20 μM [μM] or 100 nM [nM]) or vehicle control (DMSO). Intracellular bacteria were retrieved and CFUs quantified. Graph shows relative percentage of CFU (mean +/- SEM of 5 independent experiments) considering 100 the bacteria retrieved from DMSO-treated cells. (B) LC3 staining of AGS cells after 4h VacA+ incubation followed by 3h of DMSO, ML-SA1 or rapamycin treatment.
![Figure 3. Differential effect of autophagy induction by TRPML1 activation or mTORC1 inhibition on Hp intracellular survival. (A) AGS cells infected with wild-type (VacA+) Hp were incubated with gentamycin to kill extracellular bacteria and treated with ML-SA1 (20 μM), rapamycin (Rapa, 20 μM [μM] or 100 nM [nM]) or vehicle control (DMSO). Intracellular bacteria were retrieved and CFUs quantified. Graph shows relative percentage of CFU (mean +/- SEM of 5 independent experiments) considering 100 the bacteria retrieved from DMSO-treated cells. (B) LC3 staining of AGS cells after 4h VacA+ incubation followed by 3h of DMSO, ML-SA1 or rapamycin treatment.](/cms/asset/2b05b5f4-a924-4a0f-86a9-daba5eca5213/kauo_a_2191918_f0003_oc.jpg)
Figure 4. Effect of MTOR and TRPML1 pathways on St intracellular survival. (A) HeLa cells infected with St were treated for 5h or 24 h with ML-SA1 (20 μM), rapamycin (Rapa, 100 nM) or vehicle control (DMSO). Intracellular bacteria were retrieved and CFU quantified. Graph shows relative percentage of CFU (mean +/- SEM of 3 independent experiments) considering 100 the bacteria retrieved from DMSO-treated cells. (B) HeLa cells infected with St were treated with DMSO, ML-SA1 (20 μM), 3-methyladenine (3-MA) or 3-MA containing 20 μM ML-SA1 (3-MA + ML-SA1). Intracellular bacteria were retrieved and CFU quantified as in (A). (C-D) LC3 (C) or p62 (D) staining of HeLa cells infected with St and treated with DMSO or ML-SA1 (20 μM) for 4h. DAPI staining used to visualize bacteria. Higher magnifications of the selected area in the separate channels are included to the right. Graphs show the percentage of bacteria positive for each marker. Each color corresponds to 1 experiment, big symbols represent the mean and the small symbols the scatter dot plot/experiment. Lines show the mean +/- SEM. (E) LC3 staining of St-infected cells treated with DMSO or ML-SA1 (20 μM) for 24h. Images of DAPI channel to visualize bacteria are included at the right. (F) Lamp1 staining of cells infected and treated as in (E). Arrows point to non-infected cells, arrowheads to SCV and Sifs. Images from the separate channels included at the right.
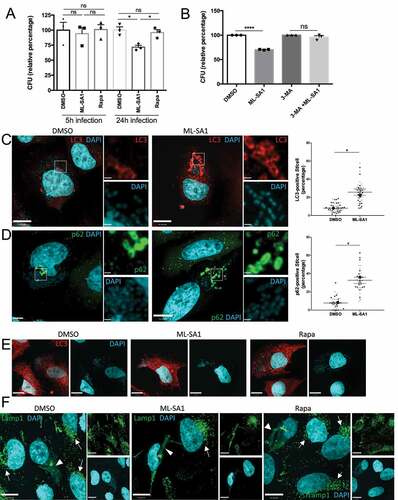
Figure 5. Effect of MTOR or TRPML1-dependent pathways on Lm intracellular survival. (A) HeLa cells infected with Lm were incubated with gentamycin and treated for 23 h with ML-SA1 (20 μM), rapamycin (Rapa, 100 nM) or vehicle control (DMSO). Intracellular bacteria were retrieved and CFUs quantified. Graph shows relative percentage of CFU (mean +/- SEM of 6 independent experiments) considering 100 the bacteria retrieved from DMSO-treated cells. (B) LC3 western blotting of Lm-infected (Lm) and non-infected control cells (Non-infection) treated as in (A) using actin as loading control. Graph shows quantification of LC3II normalized to actin (mean +/- SEM of 4 different experiments). (C) LC3 and Lamp1 staining of cells infected and treated as in (A). For rapamycin-treated cells, panels with drug added 1 h (Rapa 1 hpi) or 4 h (Rapa 4 hpi) after infection are included. Arrows indicate SLAPs. (D) SLAP quantification in Lm-infected HeLa cells and treated as (C), with drugs added 1h and 4h post-infection (n=3, each color corresponds to 1 experiment, big symbol represent the mean and small symbols the scatter dot plot. Lines show the mean +/- SEM).
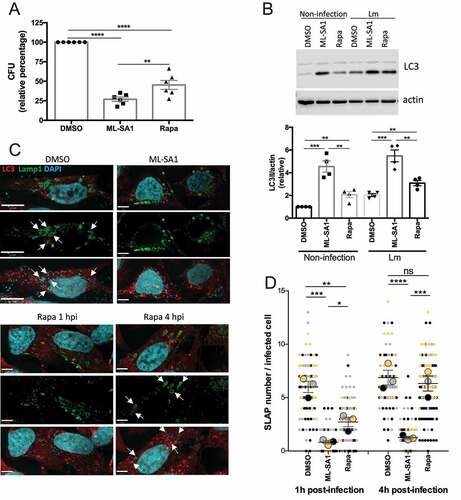
Figure 6. Effect of MTOR and TRPML1 pathways on Sa intracellular survival. (A) HeLa cells infected with Sa were incubated with gentamycin and treated for 4h or 20h with ML-SA1 (20 μM), rapamycin (Rapa, 100 nM) or vehicle control (DMSO). Intracellular bacteria were retrieved and CFU quantified. Graph shows relative percentage of CFU (mean +/- SEM of 4 independent experiments) considering 100 the bacteria retrieved from DMSO-treated cells. (B) LC3 and Lamp1 staining of cells infected and treated for 20h with ML-SA1 or rapamycin. Images in the separate channels are included at the right. (C) LC3 western blotting of Sa-infected cells treated as in (B) using actin as loading control. Graph shows quantification of LC3II normalized to actin (mean +/- SEM of 3 different experiments). (D) HeLa cells infected with Lm were treated with DMSO, ML-SA1 (20 μM), 3-methyladenine (3-MA) or 3-MA containing 20 μM ML-SA1 (3-MA + ML-SA1). Intracellular bacteria were retrieved and CFU quantified as in (A)
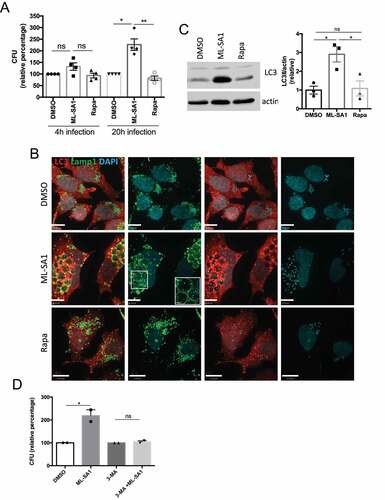
Figure 7. Effect of MTOR and TRPML1 pathways on Sf intracellular survival. (A) HeLa cells infected with Sf were incubated with gentamycin and treated for 4h with ML-SA1 (20 μM), rapamycin (Rapa, 100 nM) or vehicle control (DMSO). Intracellular bacteria were retrieved and CFU quantified. Graph shows relative percentage of CFU (mean +/- SEM of 4 independent experiments) considering 100 the bacteria retrieved from DMSO-treated cells.
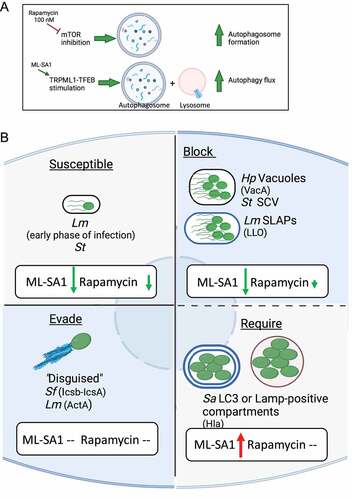
Figure 8. (A) Model for the differential effect of 100 nM rapamycin and ML-SA1 on autophagy pathway. (B) Working model illustrating the effect of inducing autophagy by TRPML1 activation (ML-SA1) or mTORC1 inhibition (Rapamycin) on bacterial growth for pathogens that are susceptible to, block, evade, or require autophagy for intracellular survival. Green arrow indicates a reduction, and red arrow an increase in intracellular bacterial growth; size of the arrow is proportional to the magnitude of the effect. –: no effect.