Figures & data
Figure 1. Htt103QP IBophagy requires the core autophagy machinery. a) A diagram showing the protocol for IBophagy induction. Yeast strains with PGALFLAG-Htt103QP-GFP were grown in 30°C galactose medium for 16 hours to induce Htt103QP IB formation. We then added glucose and hydroxyurea to repress Htt103QP expression and arrest the cell cycle, respectively. Vacuolar localisation of Htt103QP-GFP indicates IBophagy. b) Htt103QP IBophagy in WT and atg8Δ cells. After IBophagy induction, the localisation of Htt103QP-GFP was examined over time. Vph1-mApple marks the vacuole. Here, we show the images of Htt103QP-GFP and Vph1-mApple before (0) and after IBophagy induction for 3 and 6 hours. Scale bar = 5 μm. c) The IBophagy in WT and atg8Δ mutant cells was quantified by measuring fluorescence intensity of Htt103QP-GFP inside the vacuole in 50 cells at each time point. Statistical significance was determined by *p < 0.05, using Sidak’s two-way ANOVA. d) IBophagy quantification in WT and atg8Δ mutants was done by counting the percentage of cells with either an IB or vacuolar GFP signal (n > 100). e) The requirement of core autophagy-related genes for Htt103QP IBophagy.
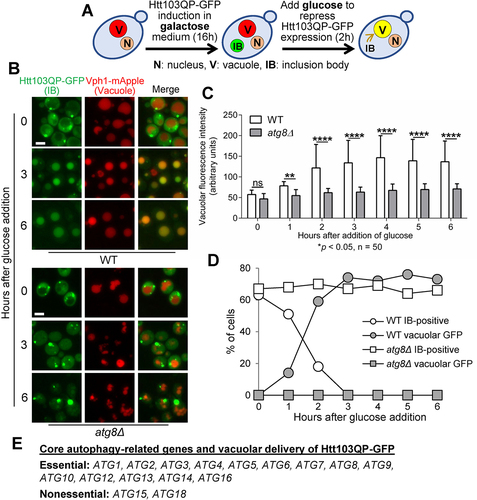
Figure 2. Htt103QP IBophagy requires the selective autophagy machinery. a) Htt103QP IBophagy in WT and mutants lacking genes specific for selective or non-selective autophagy. The protocol used was the same as described in for the examination of IBophagy. Here, we show images of Htt103QP-GFP and the vacuole (Vph1-mApple) before and after IBophagy induction. Scale bar = 5 μm. b) IBophagy was quantified by measuring GFP fluorescence intensity inside the vacuole in 50 cells at each time point. Statistical significance was determined by *p < 0.05, using Tukey’s two-way ANOVA. c) IBophagy was also quantified by counting the percentage of cells with either an IB or diffuse vacuolar GFP signal (n > 100).
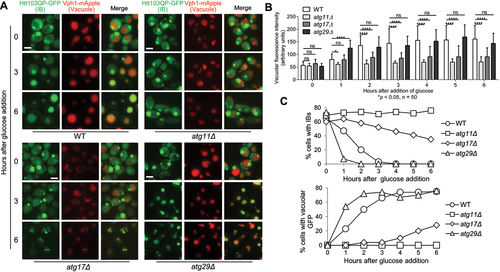
Figure 3. Yeast aggrephagy SAR Cue5 is not required for Htt103QP IBophagy. a) IBophagy proceeds normally in cue5Δ cells. The IBophagy protocol was the same as described. Here, we show the localisation of Htt103QP-GFP and the vacuole (Vph1-mApple) before and after IBophagy induction. Scale bar = 5 μm. b) IBophagy was quantified by measuring GFP fluorescence intensity in 50 cells inside the vacuole over time. Statistical significance was determined by *p < 0.05, using Sidak’s two-way ANOVA. c) IBophagy was also quantified by counting the percentage of cells that contained either an IB or vacuolar GFP signal (n > 100).
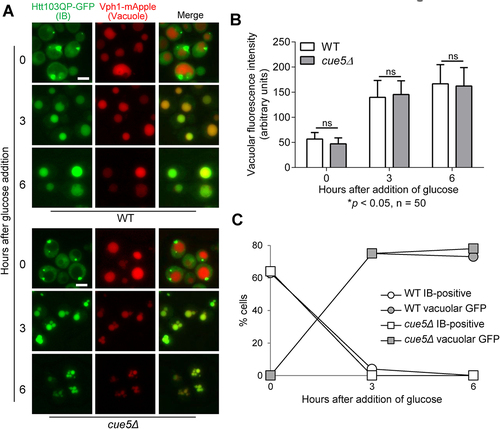
Figure 4. Htt103QP IBophagy shares SARs with other types of selective autophagy. a) Defective Htt103QP IBophagy was detected in SAR mutants atg36Δ, atg39Δ, atg40Δ, and atg19Δ. The IBophagy protocol described above was used to examine IBophagy in WT and SAR mutants. The localisation of Htt103QP-GFP and Vph1-mApple (vacuole) in WT, atg36Δ, atg39Δ, atg40Δ, and atg19Δ cells before and after IBophagy induction is shown. Scale bar = 5 μm. b) Quantification of IBophagy in WT and SAR mutants was done by measuring GFP fluorescence intensity inside the vacuole in 50 cells at each time point. Statistical significance was determined by *p < 0.05, using Tukey’s two-way ANOVA. c) The percentage of cells that contained either an IB or vacuolar GFP signal in WT and SAR mutants over time. d) The requirement of non-core autophagy-related genes for IBophagy. * marks different types of SARs.
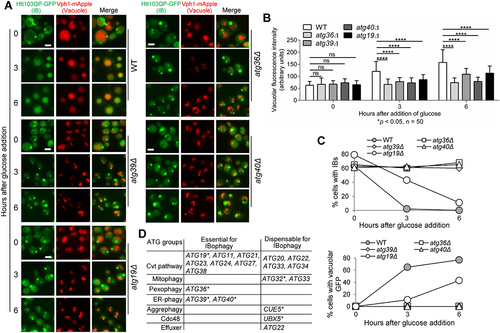
Figure 5. The SARs essential for IBophagy colocalize with Htt103QP IBs. a) The colocalization of SARs Atg36, Atg39, and Atg40 with Htt103QP IBs. The SARs were tagged with GFP and their colocalization with Htt103QP-mApple IBs was examined after growth at 30°C in galactose media for 16 hours. The strains used in this experiment contain snf7Δ, which prevents autophagosome-vacuole fusion. Here, we show the images for SAR colocalization with Htt103QP IBs (arrows). To analyse the colocalization, a straight white line was drawn through the Htt103QP-mApple. Then SAR-GFP signals and the fluorescence intensity (AU) along the line was plotted using ImageJ (right). Scale bar = 5 μm. b) The interaction of SARs with Htt103QP IBs as shown by Co-IP. SARs were tagged with 13Myc in strains with and without PGALFLAG-Htt103QP-GFP, and all strains were grown to log phase in raffinose media before galactose addition for two hours to induce Htt103QP expression. SAR enrichment was found in the IP fractions from cells with FLAG-Htt103QP induction after pulldown with anti-FLAG beads, indicating SAR interaction with Htt103QP aggregates. c) The association of SARs with Htt103QP IBs using filter-trap assay. SARs were tagged with 13Myc in strains with and without PGALFLAG-Htt103QP-GFP, and all strains were grown in galactose media for 16 hours to induce Htt103QP IB formation. Cell lysates were prepared and filtered through a nitrocellulose membrane using a filter-trap apparatus. Anti-FLAG and anti-Myc antibodies were used to detect the Htt103QP and SARs trapped in the membrane. Quantification of the blot was done by measuring signal intensity in each dot. The ratio of trapped SARs over the total SARs was analysed after three repeats. Statistical analysis was determined by *p < 0.05, using Tukey’s two-way ANOVA.
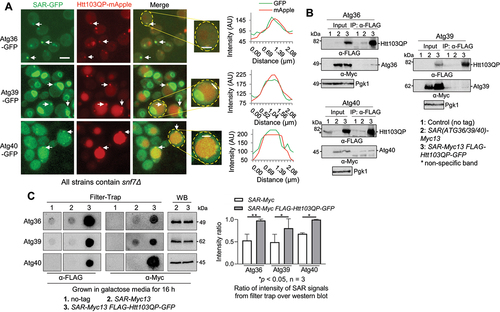
Figure 6. SAR cofactors and Htt103QP IBophagy. a) Htt103QP IBophagy in the absence of Atg40 cofactor (lnp1Δ) and Atg36 cofactor (pex3Δ). The same IBophagy protocol was used for this experiment. Here, we show the localisation of Htt103QP and the vacuole (Vph1-mApple) before and after IBophagy induction. Scale bar = 5 μm. b) IBophagy was quantified by measuring GFP fluorescence intensity inside the vacuole in 50 cells at each time point. Statistical significance was determined by *p < 0.05, using Tukey’s two-way ANOVA. c) Htt103QP IBophagy was also quantified by counting the percentage of cells that contained either an IB or diffuse vacuolar GFP signal (n > 100). d) The colocalization of Atg40 with Htt103QP IBs in the absence of Atg40 cofactor Lnp1. The localisation of Htt103QP-mApple and Atg40-GFP in WT and lnp1∆ cells (30°C) was examined as described above. The representative images and the percentage of IBs with Atg40 colocalization are shown. Statistical significance was determined by *p < 0.05, using an unpaired t-test.
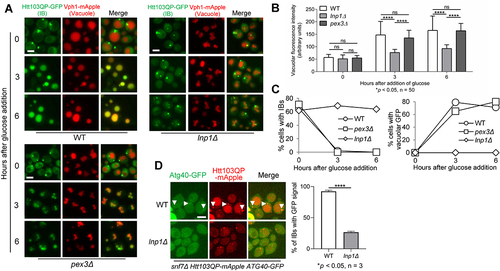
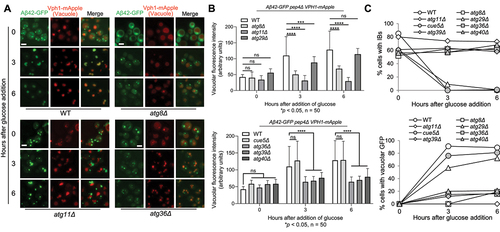
Figure 7. IBophagy in yeast cells expressing Aβ42. a) Aβ42 IBophagy in WT and representative autophagy mutants. The protocol used was the same as described in for the examination of Htt103QP IBophagy. Here, we show images of Aβ42-GFP and the vacuole (Vph1-mApple) before and after IBophagy induction. Scale bar = 5 μm. b) IBophagy was also quantified by measuring GFP fluorescence intensity inside the vacuole in 50 cells at each time point. Statistical significance was determined by *p < 0.05, using Tukey’s two-way ANOVA. c) IBophagy was quantified by counting the percentage of cells with either an IB or diffuse vacuolar GFP signal (n > 100).