Figures & data
Figure 1. Dram1 is required for effective host defense during Salmonella infections in zebrafish. (A) Workflow of experiments followed in B&C along with the timeline of developing embryos. (B) Survival curves of embryos with S. Typhimurium infection expressing different levels of dram1. Control embryos were compared to dram1 knockdown (kd) and overexpressing (mRNA) groups, and survival curves show the data from three independent experiments (n=150 embryos/group). (C) CFU counts for infected embryo groups in B. The log transformed CFU data from three independent experiments are shown with the geometric mean per time point (n=15 embryos/group). Error bars represent SD. Statistical significance of survival curves data is assessed by Cox proportional hazards model with log rank test, and pairwise comparison with Dunnett correction. Statistical significance of CFU counts data is analyzed by one-way ANOVA and pairwise comparison with Dunnett correction. (*p<0.05; **p<0.01; ***p<0.001).
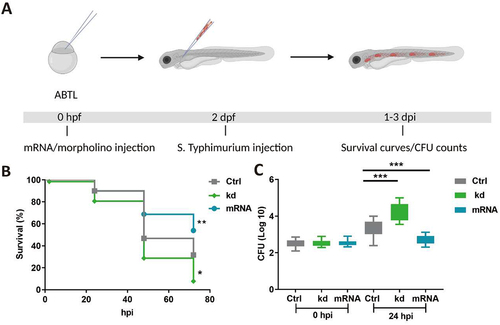
Figure 2. Dram1 promotes GFP-Lc3 associations with Salmonella in macrophages of the zebrafish. (A) Workflow and timeline of experiments in B-C. (B) Representative confocal micrographs of Tg(CMV:GFP-maplc3b1) embryos from dram1 knockdown, overexpression and control groups infected with mCherry-expressing S. Typhimurium (ST) at 4 hpi. Scale bar = 5μm (C) Quantification of GFP-Lc3-Salmonella associations at 4 hpi. Error bars represent SD. The bar graph shows the data from three independent experiments, where the mean of each replicate is indicated with a different symbol (n= 15 embryos/group). Statistical significance is analyzed by one-way ANOVA and pairwise comparison with Dunnett correction. (***p<0.001).
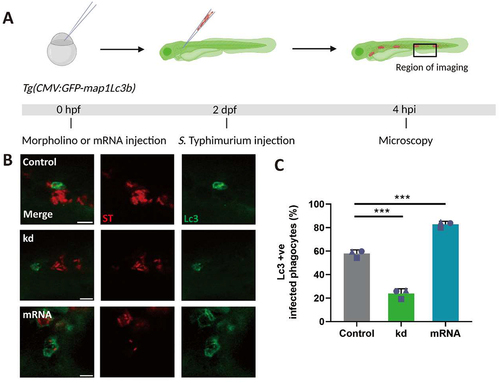
Figure 3. GFP-Lc3 recruitment to Salmonella is impaired in dram1 mutants in zebrafish. (A) Workflow and timeline of experiments in B-E. (B) Survival curves of dram1+/+ and dram1-/- embryos infected with S. Typhimurium (n=150 embryos/group from three independent experiment). (C) CFU counts recovered from dram1 +/+ and dram1 - /- infected individuals (n=15 embryos/group from 3 three independent experiments). (D) Representative confocal micrographs of GFP-Lc3-Salmonella associations in dram1+/+ (D) and dram1-/- (E) embryos in Tg(CMV:GFP-maplc3b1) background. Scale bar = 5 μm (E) Quantification of GFP-Lc3-Salmonella associations in dram1+/+ and dram1 -/- embryos (n= 15 embryos/group). The bar graph shows the data from three independent experiments, where the mean of each replicate is indicated with a different symbol. Error bars represent SD. Statistical significance of survival curves data is assessed by Cox proportional hazards model with log rank test. Statistical significance of CFU counts and GFP-Lc3-Salmonella associations data is analyzed by unpaired t-test. ***p<0.001).
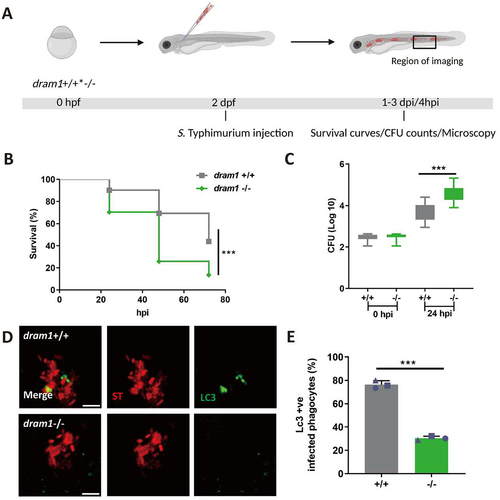
Figure 4. ROS generation is inhibited by TIPTP in zebrafish. (A) Workflow and timeline of experiments in B-C. (B) Representative micrographs for control and TIPTP-treated embryos infected with a Salmonella biosensor strain for ROS. Images were taken at 4 hpi. Scale bar = 10 μm (C) Quantification of the ROS reporter activation (GFP intensity compared to constitutive mCherry intensity). The bar graph shows the data from three independent experiments, where the mean of each replicate is indicated with a different shape. (n=15 embryos per group). Statistical significance is analyzed by unpaired t-test. (**p<0.01). Error bars represent the SD.
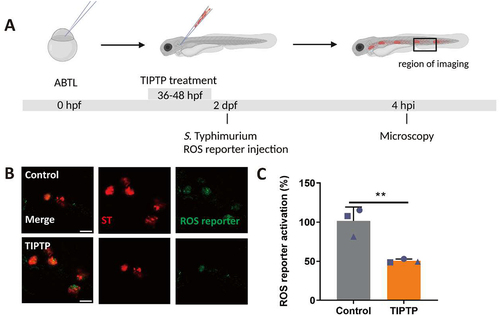
Figure 5. ROS generation is mediated by Dram1 during Salmonella infection in the zebrafish model. (A) Workflow and timeline of experiments in B-E. (B). Representative micrographs for dram1+/+ and dram1-/- embryos infected with a Salmonella biosensor strain for ROS. Images were taken at 4 hpi. Scale bar = 5 μm (C) Quantification of the ROS reporter activation (GFP intensity compared to constitutive mCherry intensity) in dram1+/+ and dram1-/- embryos. (D) Representative micrographs for control and dram1 mRNA overexpression embryos, infected with a Salmonella biosensor strain for ROS. Scale bar = 10 μm (E) Quantification of the ROS reporter activation (GFP intensity compared to constitutive mCherry intensity) in control and dram1 mRNA overexpression embryos. Bar graphs show the data from three independent experiments, where the mean of each replicate is indicated with a different shape (n=15 embryos per group). Error bars represent the SD. Statistical significance is analyzed by is analyzed by unpaired t-test. (**p<0.01; ***p<0.001).
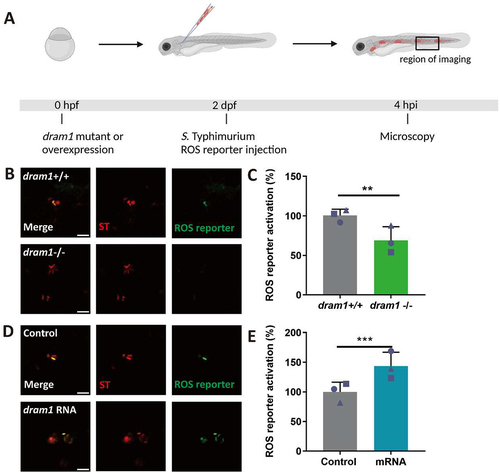
Figure 6. ROS generation and LC3 associations with Salmonella are inhibited by TIPTP in RAW264.7 macrophages. (A) Workflow and timeline of experiments (B). Representative micrographs for control and TIPTP-treated cells infected with a Salmonella biosensor strain for ROS. Scale bar = 2 μm (C) Quantification of the ROS reporter activation (GFP intensity compared to constitutive mCherry intensity). (D) Representative confocal micrographs of LC3 immunostaining associated with mCherry-expressing S. Typhimurium. Scale bar = 2 μm (E) Quantification of LC3-Salmonella associations. Bar graphs show the data from two independent LC3 immunostaining experiments, where the mean of each replicate is indicated with a different symbol (n=24 regions of interest per group). Statistical significance is analyzed by one-way ANOVA and pairwise comparison with Dunnett correction. (**p<0.01; ***p<0.001). Error bars represent the SD.
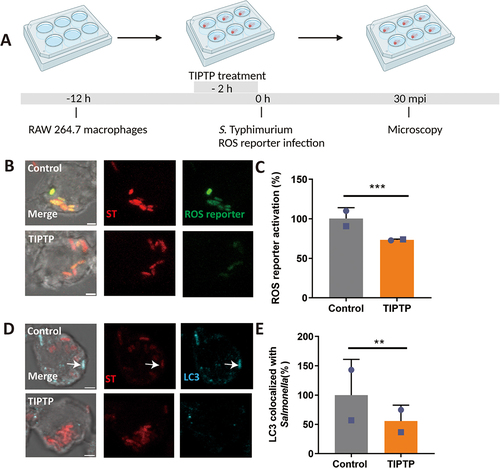
Figure 7. DRAM1 promotes ROS generation during Salmonella infection in RAW264.7 macrophages. (A) Workflow and timeline of experiments (B) Representative micrographs for Dram1 control and knockdown (KD) cells, infected with a Salmonella biosensor strain for ROS. Scale bar = 2 μm (C) Quantification of the ROS reporter activation (GFP intensity compared to constitutive mCherry intensity) in Dram1 control and knockdown (KD) cells. (D) Representative micrographs for Dram1 control and overexpression (OE) cells infected with a Salmonella biosensor strain for ROS. Scale bar = 2 μm (E) Quantification of the ROS reporter activation (GFP intensity compared to constitutive mCherry intensity) in Dram1 control and overexpression (OE) cells. Bar graphs show the data from two independent experiments, where the mean of each replicate is indicated with a different symbol (n=24 regions of interest per group). (F-G) Isoluminol measurement of ROS production in Dram1 knockdown, overexpression, and control cells after infection (F) or stimulation with PMA (G). Graphs show the data from one replicate out of two independent experiments. Statistical significance is analyzed by one-way ANOVA and pairwise comparison with Dunnett correction. *p<0.05, **p<0.01; ***p<0.001). Error bars represent the SD.
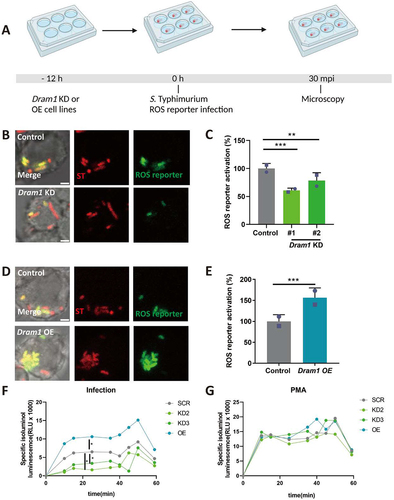
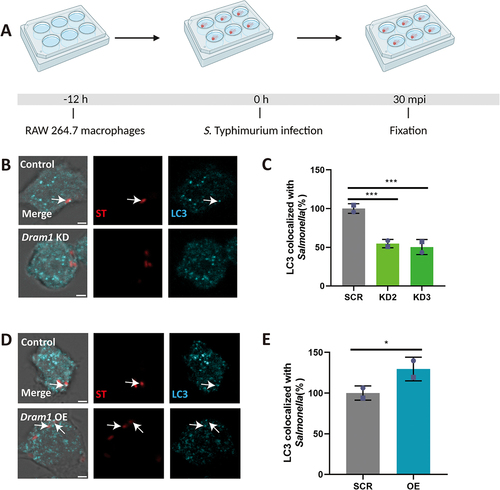
Figure 8. DRAM1 increases LC3 associations with Salmonella in RAW264.7 macrophages. (A) Workflow and timeline of experiments (B). Representative micrographs of LC3 immunostaining associated with mCherry-expressing S. Typhimurium in Dram1 knockdown cells infected with a Salmonella. Scale bar = 2 μm (C) Quantification of LC3-Salmonella associations. (D) Representative confocal micrographs of LC3 immunostaining associated with mCherry-expressing S. Typhimurium in control and in Dram1 overexpression cells . Scale bar = 2 μm (E) Quantification of LC3-Salmonella associations. Bar graphs show the data from two independent LC3 immunostaining experiments, where the mean of each replicate is indicated with a different symbol (n=24 regions of interest per group). Statistical significance is analyzed by one-way ANOVA and pairwise comparison with Dunnett correction. (*p<0.05; **p<0.01; ***p<0.001). Error bars represent the SD.