Figures & data
Figure 1. Forward genetic screen to identify modifiers of M1BP mediated eye suppression. (A) Schematics of forward genetic screen for identifying genetic modifiers of M1BP mediated eye suppression phenotype where various UAS-X/transgene lines were individually misexpressed using the ey-Gal4 driver along with downregulation of M1BP. Modifiers were classified into enhancers and suppressors based on whether they enhance or suppress the ey>M1BPRNAi reduced eye phenotype. Quantification of adult eye surface area (µm2) using Fiji/ImageJ software (NIH) to assay differences in eye phenotype. (B) ey>GFP where the GFP transgene reporter marks the ey-Gal4 driver expression domain in the developing third instar eye antennal disc. Note that the eye antennal imaginal disc is stained with pan-neuronal marker Elav (red) that marks the nuclei of retinal neurons. (C, D, E, F) Eye antennal imaginal discs stained for Wg (green) and pan-neuronal marker Elav (red). (D) Downregulation of M1BP in the entire eye (ey>M1BPRNAi) results in suppression of eye fate and increased Wg expression compared to (C) ey-Gal4 control. Eye discs showing (E) enhancement (ey>M1BPRNAi+hepAct) and (F) suppression (ey>M1BPRNAi+bskDN) of the ey>M1BPRNAi phenotype. The orientation of all imaginal discs is identical with posterior to the left and dorsal up. The magnification of all eye-antennal imaginal discs is 20X and adult eyes are 10X unless specified.
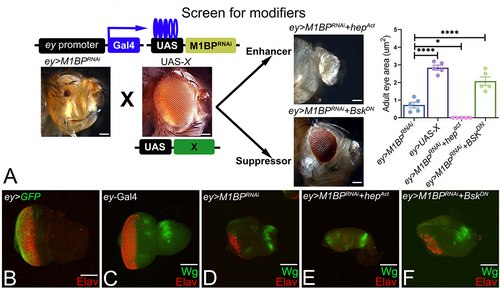
Figure 2. Downregulation of M1BP activates JNK signaling in the developing eye. (A) Schematic representation of c-Jun NH (2)-terminal kinase (JNK) signaling pathway. (B) Relative expression of jnk at the transcriptional level using quantitative real time PCR (qRT-PCR) in ey>M1BPRNAi and ey-Gal4 control eye-antennal imaginal discs. (C) Levels of phospho-JNK (pJNK) in a semi-quantitative Western Blot shows higher levels of JNK signaling in ey>M1BPRNAi compared to ey-Gal4 control. The tubulin bands serve as control for normalization. The quantification of p-JNK band intensity reveals a significantly higher levels in ey>M1BPRNAi background as compared to the control ey-Gal4. (D) Quantification of pJNK intensity was performed using standard 100 x 100 pixel ROI marked by yellow dotted line and using Fiji/ImageJ software (NIH). (E-H) Eye antennal imaginal disc of third instar larvae stained for pan-neuronal marker Elav (red) and (E, F) pJNK (green) and (G, H) puc-lacZ (green). Eye antennal imaginal disc showing split channel for (E’, F’) pJNK staining, (G’, H’) lacZ staining for (E, E’, G, G’) ey-Gal4 and (F, F’, H, H’) ey>M1BPRNAi. Graphs were plotted with mean +/- SEM. Statistical significance in each graph is shown by p-value: ****p<0.0001, ***p<0.001; **p<0.01; *p<0.05. The orientation of all imaginal discs is identical with posterior to the left and dorsal up. The magnification of all eye-antennal imaginal disc is 20X unless specified.
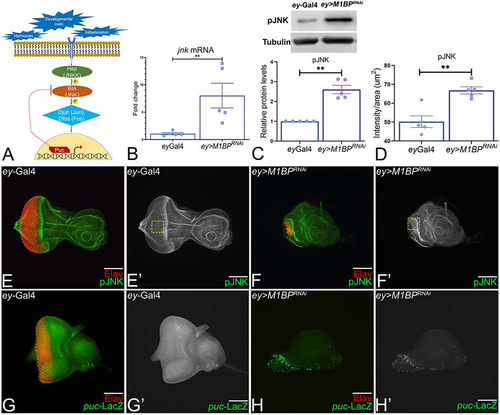
Figure 3. Modulation of JNK signaling affects eye suppression phenotype of M1BP downregulation. (A, C, E, G, I, K, M, O, Q, S) Eye antennal imaginal disc of third instar larvae stained for pJNK (green) and pan-neuronal marker Elav (red). (A, A’) ey-Gal4 control discs showing pJNK expression. (A’, C’, E’, G’, I’, K’, M’, O’, Q’, S’) Eye antennal imaginal disc showing split channel for pJNK staining. Quantification was performed using standard 100X100 pixel ROI. ROI is shown as yellow dashed boxes. Adult eye images of control (B) ey-Gal4, downregulation of M1BP (D) ey>M1BPRNAi, downregulating JNK pathway: (F) ey>bskDN, (H) ey>M1BPRNAi+bskDN, (J) ey>puc, (L) ey>M1BPRNAi+puc, upregulating JNK pathway: (N) ey>hepAct, (P) ey>M1BPRNAi+hepAct, (R) ey>junaspvCitation7, (T) ey>M1BPRNAi+junaspvCitation7. Eye-antennal imaginal discs of control (A, A’) ey-Gal4, downregulation of M1BP (C, C’) ey>M1BPRNAi, downregulating JNK pathway: (E, E’) ey>bskDN, (G. G’) ey>M1BPRNAi+bskDN, (I, I’) ey>puc, (K, K’) ey>M1BPRNAi+puc, upregulating JNK pathway: (M, M’) ey>hepAct, (O, O’) ey>M1BPRNAi+hepAct, (Q, Q’) ey>junaspvCitation7, (S, S’) ey>M1BPRNAi+junaspvCitation7. Note that (H, L) downregulation of JNK signaling showed significant rescues in adult eye phenotypes; whereas (P, T) activation of JNK signaling enhanced the eye suppression phenotype of (D) ey>M1BPRNAi. (U) Quantification of pJNK intensity using Fiji/ImageJ software (NIH). The genotypes depicted in the graph are 1: ey-Gal4, 2: ey>M1BPRNAi, 3: ey>M1BPRNAi+bskDN, 4: ey>M1BPRNAi+puc, 5: ey>M1BPRNAi+hepAct and 6: ey>M1BPRNAi+junaspvCitation7. (V) Graphical representation of adult eye phenotype frequency. The genotypes depicted in the graph are 1: ey-Gal4, 2: ey>M1BPRNAi, 3: ey>M1BPRNAi+bskDN, 4: ey>M1BPRNAi+puc, 5: ey>M1BPRNAi+hepAct and 6: ey>M1BPRNAi+junaspvCitation7. For adult eye frequency, statistical significance with eyGal4 and ey>M1BPRNAi are depicted using # and * respectively. Graphs were plotted with mean +/- SEM. For quantification, statistical significance in each graph is shown by p-value: ****p<0.0001, ***p<0.001; **p<0.01; *p<0.05. The orientation of all imaginal discs is identical with posterior to the left and dorsal up. The magnification of all eye-antennal imaginal discs is 20X and adult eyes are 10X unless specified.
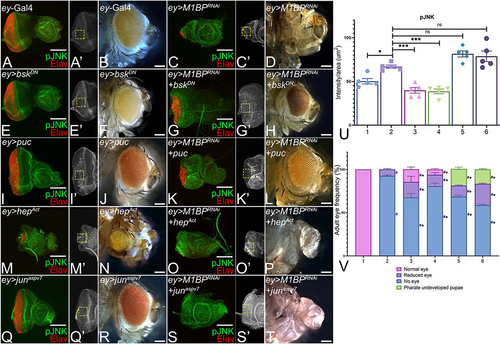
Figure 4. Modulation of JNK pathway in M1BP LOF background affects wingless levels. Eye-antennal imaginal discs from third instar larvae of (A) ey-Gal4, downregulation of M1BP (C) ey>M1BPRNAi, downregulating JNK pathway: (E) ey>bskDN, (G) ey>M1BPRNAi+bskDN, (I) ey>puc, (K) ey>M1BPRNAi+puc, upregulating JNK pathway: (M) ey>hepAct, (O) ey>M1BPRNAi+hepAct, (Q) ey>junaspvCitation7, (T) ey>M1BPRNAi+junaspvCitation7 were assessed for changes in wg-lacZ expression shown in grayscale. (B, D, F, H, J, L, N, P, R, S, U) Eye-antennal imaginal discs from third instar larvae of (B) ey-Gal4, downregulation of M1BP (D) ey>M1BPRNAi, downregulating JNK pathway: (F) ey>bskDN, (H) ey>M1BPRNAi+bskDN, (J) ey>puc, (L) ey>M1BPRNAi+puc, upregulating JNK pathway: (N) ey>hepAct, (P) ey>M1BPRNAi+hepAct, (R) ey>junaspvCitation7, (S) ey>M1BPRNAi+junaspvCitation7 were assessed for changes in Wg expression shown in grayscale. (A, B) ey-Gal4 control discs showing expression in the anterolateral margins of the eye disc. (C, D) Loss of M1BP in the entire developing eye (ey>M1BPRNAi) results in ectopic induction of wg expression. Downregulation of JNK pathway in the background of loss of M1BP in the entire eye (G, H) ey>M1BPRNAi+bskDN and (K, L) ey>M1BPRNAi+puc. Activation of JNK pathway in the background of loss of M1BP (O, P) ey>M1BPRNAi+hepAct and (T, U) ey>M1BPRNAi+junaspvCitation7. Yellow solid arrows indicate the induction or suppression of Wg. The orientation of all imaginal discs is identical with posterior to the left and dorsal up. The magnification of all eye-antennal imaginal discs is 20X unless specified.
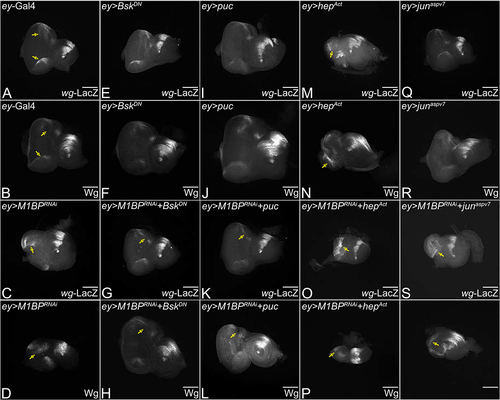
Figure 5. Downregulation of M1BP triggers cell death. Eye-antennal imaginal discs stained for pan-neuronal marker Elav (red), Dlg (blue), a membrane specific marker, to mark outline of the tissue and (A-D) hid5’F-WT-GFP (green). Eye antennal imaginal disc showing split channel for (A’-D’) hid5’F-WT-GFP for (A, A’, B, B’) ey-Gal4 and (C, C’, D, D’) ey>M1BPRNAi in (A, A’, C, C’) 20X and (B, B’, D, D’) 40X. (E) Quantification of hid5’F-WT-GFP intensity using Fiji/ImageJ software (NIH) using standard 100X100 pixel ROI. ROI is shown as yellow dashed boxes. Caspase-dependent cell death was blocked in the entire eye (F, K, K’, O, O’) ey>hidRNAi, (H, M, M’, Q, Q’) ey>hidΔNCitation14. Blocking hid mediated apoptotic cell death in ey>M1BPRNAi background (G, L, L’, P, P’) ey>M1BPRNAi+hidRNAi, (I, N, N’, R, R’) ey>M1BPRNAi+hidΔNCitation14 shows rescue when compared to ey>M1BPRNAi. (J) Graphical representation of adult eye phenotype frequency. The genotypes depicted in the graph are 1: ey-Gal4, 2: ey>M1BPRNAi, 3: ey>M1BPRNAi+hidRNAi and 4: ey>M1BPRNAi+hidΔNCitation14. Statistical significance with eyGal4 and ey>M1BPRNAi are depicted using # and * respectively. Eye antennal imaginal discs of indicated genotypes stained for (K-N) Wg (green), (O-R) pJNK (green) and pan-neuronal marker Elav (red). Eye-antennal imaginal discs showing split channel for (K’-N’) Wg and (O’-R’) pJNK staining. (S) pJNK intensity quantification using Fiji/ImageJ software (NIH). The genotypes depicted in the graph are 1: ey-Gal4, 2: ey>M1BPRNAi, 3: ey>M1BPRNAi+hidRNAi and 4: ey>M1BPRNAi+hidΔNCitation14. Quantification was performed using standard 100X100pixels ROI. ROI is shown as yellow dashed boxes. Graphs were plotted with mean +/- SEM. Statistical significance in each graph is shown by p-value: ****p<0.0001, ***p<0.001; **p<0.01; *p<0.05. The orientation of all imaginal discs is identical with posterior to the left and dorsal up. The magnification of all eye-antennal imaginal discs is 20X and adult eyes are 10X unless specified.
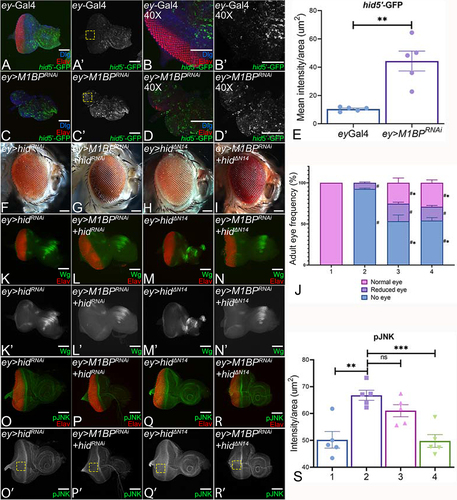
Figure 6. Downregulation of M1BP triggers autophagy. (A) ey-Gal4 adult eye. (B, B’, C, C’) Eye-antennal imaginal discs stained with pan neuronal marker Elav (red) and assessed for changes in expression of Atg8a-mCherry (green) reporter. (B’, C’) Eye antennal imaginal disc showing split channel for Atg8a-mCherry expression. (B, B’) ey-Gal4 control discs. (C, C’) Downregulation of M1BP in the entire developing eye (ey>M1BPRNAi). (D) Quantification of Atg8a-mCherry intensity conducted using Fiji/ImageJ software (NIH) using standard 100X100 pixel ROI. ROI is shown as yellow dashed boxes. (E) Relative expression of Atg8a at the transcriptional level using quantitative real time PCR (qRT-PCR) in ey>M1BPRNAi and ey-Gal4 control eye-antennal imaginal discs. (F) Levels of Atg8a in a semi-quantitative Western Blot shows higher levels of autophagy activation in ey>M1BPRNAi compared to ey-Gal4 control. The tubulin bands serve as internal loading control for normalization. The quantification of Atg8a band intensity reveals a significantly higher level in ey>M1BPRNAi when compared to ey-Gal4. (G, H, H’, I, I’) Blocking autophagy in the entire eye using Atg8a mutant (ey>Atg8a+/-) results in a near wild-type eye. Blocking autophagy using Atg8a mutant in ey>M1BPRNAi background (H, I, I’, J, J’) ey>M1BPRNAi+Atg8a+/- can rescue the eye suppression phenotype. Eye antennal imaginal discs of indicated genotypes stained for (H, K) Wg (green), (I, L) pJNK (green) and pan-neuronal marker Elav (red). Eye-antennal imaginal discs showing split channel for (H’, K’) Wg and (I’, L’) pJNK staining. (M) Graphical representation of adult eye phenotype frequency. The genotypes depicted in the graph are 1: ey-Gal4, 2: ey>M1BPRNAi, 3: ey>M1BPRNAi+Atg8a+/-. Statistical significance with eyGal4 and ey>M1BPRNAi are depicted using # and * respectively. (N) pJNK intensity quantification using Fiji/ImageJ software (NIH). The genotypes depicted in the graph are 1: ey-Gal4, 2: ey>M1BPRNAi, 3: ey>M1BPRNAi+Atg8a+/-. Quantification was performed using standard 100X100pixels ROI. ROI is shown as yellow dashed boxes. Graphs were plotted with mean +/- SEM. Statistical significance in each graph is shown by p-value: ****p<0.0001, ***p<0.001; **p<0.01; *p<0.05. The orientation of all imaginal discs is identical with posterior to the left and dorsal up. The magnification of all eye-antennal imaginal discs is 20X and adult eyes are 10X unless specified.
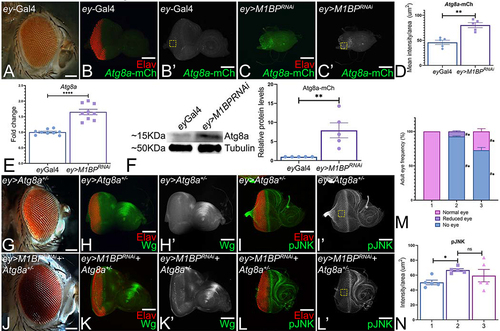
Figure 7. Activation of JNK signaling in the background of M1BP downregulation promotes autophagy. (A-J) Eye-antennal imaginal discs of (A, A’) ey-Gal4 control, (B, B’) ey>M1BPRNAi, (C, C’) ey>bskDN, (D, D’) ey>M1BPRNAi+bskDN, (E, E’) ey>puc, (F, F’) ey>M1BPRNAi+puc, (G, G’) ey>hepAct, (H, H’) ey>M1BPRNAi+hepAct, (I, I’) ey>junaspvCitation7, (J, J’) ey>M1BPRNAi+junaspvCitation7 were assessed for changes in Atg8a-mCherry (green) and pan neuronal marker Elav (red) expression. (A’-J’) Eye antennal imaginal disc showing split channel for Atg8a-mCherry expression. (C-F) JNK pathway was downregulated using bskDN (C, C’) ey>bskDN and puc (E, E’) ey>puc. (G-J) JNK pathway was activated using hepAct (G, G’) ey>hepAct and junaspvCitation7 (I, I’) ey>junaspvCitation7. (K) Quantification of Atg8a-mCherry intensity using Fiji/ImageJ software (NIH). Quantification was performed using standard 100X100 pixels ROI. ROI is shown as yellow dashed boxes. Graph was plotted with mean +/- SEM. The genotypes depicted in the graph are 1: ey-Gal4, 2: ey>M1BPRNAi, 3: ey>M1BPRNAi+bskDN, 4: ey>M1BPRNAi+puc, 5: ey>M1BPRNAi+hepAct and 6: ey>M1BPRNAi+junaspvCitation7. Statistical significance in each graph is shown by p-value: ****p<0.0001, ***p<0.001; **p<0.01; *p<0.05. The orientation of all imaginal discs is identical with posterior to the left and dorsal up. The magnification of all eye-antennal imaginal discs is 40X.
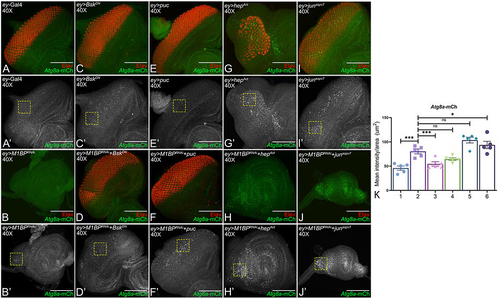
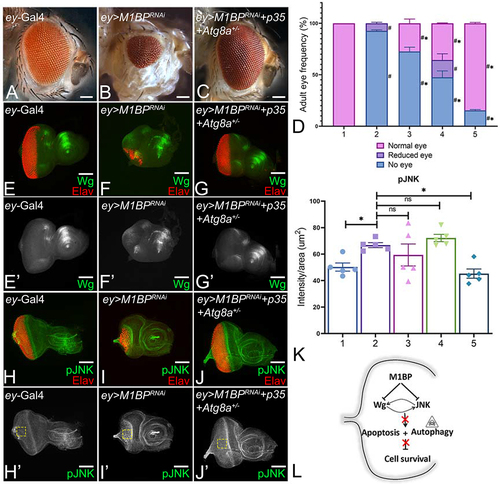
Figure 8. M1BP is required to block both caspase-dependent and caspase-independent cell death during development. Adult eye of (A) ey-Gal4 showing normal arrangement of photoreceptors and (B) ey>M1BPRNAi showing reduced eye phenotype. (C) Blocking caspase -dependent and -independent (autophagy) cell death in the background of M1BP downregulation ey>M1BPRNAi+p35+Atg8a+/- eye shows significant rescue. (D) Graphical representation of adult eye phenotype frequency. Graphs were plotted with mean +/- SEM. The genotypes depicted in the graph are 1: ey-Gal4, 2: ey>M1BPRNAi, 3: ey>M1BPRNAi+Atg8a+/-, 4: ey>M1BPRNAi+p35, 5: ey>M1BPRNAi+p35+Atg8a+/-. Statistical significance with eyGal4 and ey>M1BPRNAi are depicted using # and * respectively. Eye-antennal imaginal discs of the indicated genotypes were stained for (E-G) Wg (green), (H-J) pJNK (green) and pan-neuronal marker Elav (red). Eye-antennal imaginal discs showing split channel for (E’-G’) Wg and (H’-J’) pJNK staining. (K) pJNK intensity quantification using Fiji/ImageJ software (NIH). Quantification was performed using standard 100X100pixels ROI. ROI is shown as yellow dashed boxes. The genotypes depicted in the graph are 1: ey-Gal4, 2: ey>M1BPRNAi, 3: ey>M1BPRNAi+Atg8a+/-, 4: ey>M1BPRNAi+p35, 5: ey>M1BPRNAi+p35+Atg8a+/-. (L) Model for M1BP mediated regulation of cellular homeostasis. M1BP suppresses JNK-mediated apoptosis and autophagy to promote cell survival in the developing eye. Statistical significance in each graph is shown by p-value: ****p<0.0001, ***p<0.001; **p<0.01; *p<0.05. The orientation of all imaginal discs is identical with posterior to the left and dorsal up. The magnification of all eye-antennal imaginal discs is 20X and adult eyes are 10X unless specified.