Figures & data
Figure 1. OUA promotes claudin-1, -2, and -4 lysosomal degradation. a) LAMP1 immunofluorescence of MDCK incubated without (CTL) or with 10 mM NH₄Cl for 10 h, showing the typical increase in inhibited lysosomes’ signal. b) Claudins cell content in MDCK cells incubated as indicated above, in the presence or absence of OUA (300 nM); graphs represent the densitometric analysis in arbitrary units (a.u.) in control (white boxes) or OUA-containing media (cyan boxes); representative immunoblots are shown above. c) TER, and d) mRNA levels of claudins in the same conditions as b. The difference among groups was analysed by one-way ANOVA followed by the Student–Newman–Keuls (SNK). Groups not different from each other are marked by the same letter.
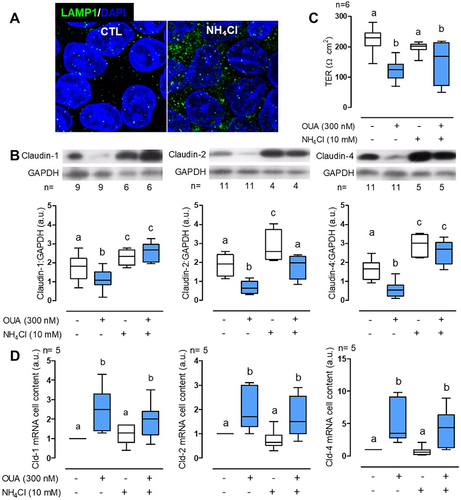
Figure 2. OUA increases autophagy flux. MDCK cells were incubated for 6 h in the presence or absence of OUA (300 nM) with or without NH₄Cl (10 mM), an inhibitor of lysosomal function. A) Representative immunofluorescences of LC3 and p62 puncta. B) LC3 and p62 puncta quantification per cell, 90 cells evaluated per condition. C) MDCK cells were incubated for 10 h in the presence or absence of OUA (300 nM) with or without NH₄Cl (10 mM), and we evaluated LC3 and p62 cell content. Graphs represent the densitometric analysis in a.u. Representative immunoblots are shown above. High exposure (HE) and low exposure (LE) representative immunoblots were used to analyse properly markers’ proteins exhibiting low and high signals, respectively. D) MDCK cells were transfected with the plasmid GFP-LC3-RFP tandem probe and incubated with or without OUA for 6 h. Representative fluorescence is shown. The yellow signal represents the autophagosomes, while the red represents the autolysosomes. E) Number of autophagosomes and autolysosomes calculated from d, 50 cells evaluated per condition.
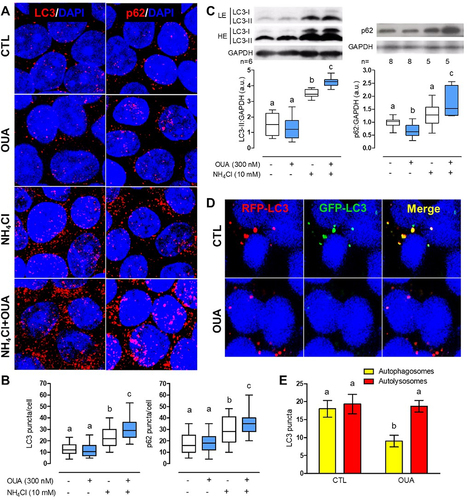
Figure 3. OUA induces the colocalisation of claudin-1, -2, and -4 with p62. MDCK cells were incubated for 10 h in the presence or absence of OUA (300 nM), with or without NH₄Cl (10 mM). A) Representative immunofluorescence images showing p62 staining in red puncta and claudins in green. Colocalisation is seen as yellow dots. PCC was calculated as a colocalisation analysis for the correlation between p62 and B) Claudin-1, C) Claudin-2, and D) Claudin-4 per cell, 40 cells evaluated per condition.
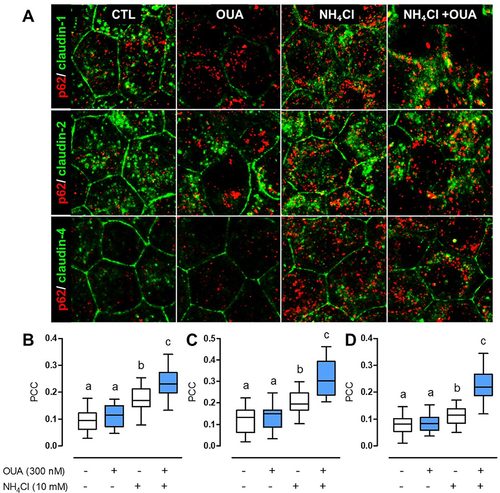
Figure 4. Autophagy regulates claudin-1, -2, and -4 cell content. MDCK cells were incubated for 10 h in the presence or absence of OUA (300 nM) with or without Rapa (500 nM), a potent autophagy inducer. A) Graphs represent claudin cell content, evaluated by densitometric analysis and expressed as a.u. Representative immunoblots are shown above. B) TER of the monolayers. One-way ANOVA followed by the SNK analysed the difference among groups. Groups not different from each other are marked by the same letter.
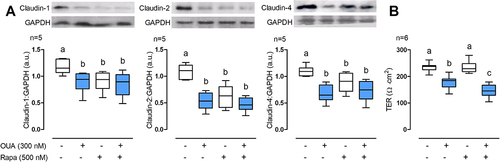
Figure 5. OUA promotes autophagy through AMPK activation. A) Total phosphorylation, normalised with GAPDH, of the autophagy regulators in the presence (blue and green lines) or absence (black line) of OUA 300 nM at a function of time (hours, h), evaluated by the corresponding densitometric analysis and expressed as a.u. Values above the control (CTL) line denote a phosphorylation increase. Two-way ANOVA followed by SNK analysed the difference among groups. B) Representative immunoblots showing cell content of the autophagy regulators AMPK and ULK1 with their respective activated-phosphorylated forms (pAMPK T127 and pULK1 S555) in the absence (-) or presence (+) of OUA 300 nM. C) LC3-II content of MDCK cells incubated for 10 h in the presence or absence of OUA (300 nM) with or without DM (50 μM), an inhibitor of AMPK. D) pULK1 S555 content of MDCK cells incubated in the same conditions for 6 h. Representative immunoblots are shown above. E) MDCK cells were transfected with the plasmid GFP-LC3-RFP tandem probe and incubated in the same conditions as d. Yellow signal represents the autophagosomes, while red represents the autolysosomes. F) Number of autophagosomes and autolysosomes calculated from e, 50 cells evaluated per condition.
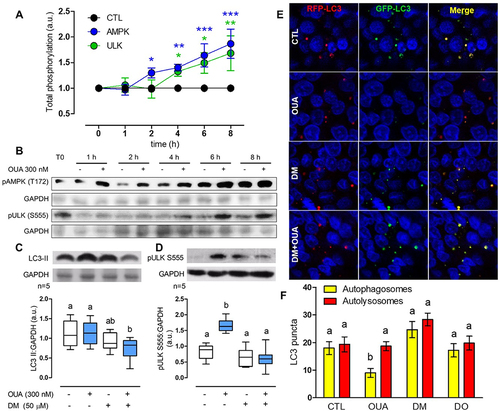
Figure 6. AMPK regulates claudin-1, -2, and -4 cell content. MDCK cells were incubated for 10 h in the presence or absence of OUA (300 nM) with or without DM (50 μM), an inhibitor of AMPK. A) Graphs represent claudin cell content, evaluated by densitometric analysis and expressed as a.u.; representative immunoblots are shown above. B) TER of the monolayers. C) Representative immunofluorescence of claudins cell localisation in these conditions.
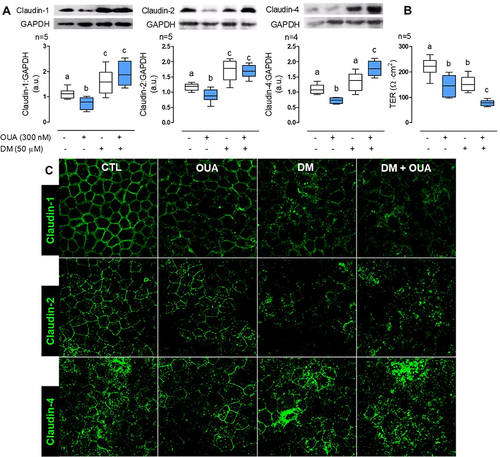
Figure 7. OUA activates AMPK through ROS generation. A) ROS measurement in MDCK cells at a function of time of incubation with OUA (FAU: Fluorescence arbitrary units). B) MDCK cells were incubated in the presence or absence of OUA (300 nM) with or without NAC (50 μM), a potent antioxidant. The graph represents AMPK total phosphorylation evaluated by densitometric analysis and expressed as a.u. after 4-h incubation with OUA. C) Claudins cell content in MDCK cells incubated for 10 h in the same conditions as b. Representative immunoblots are shown above.
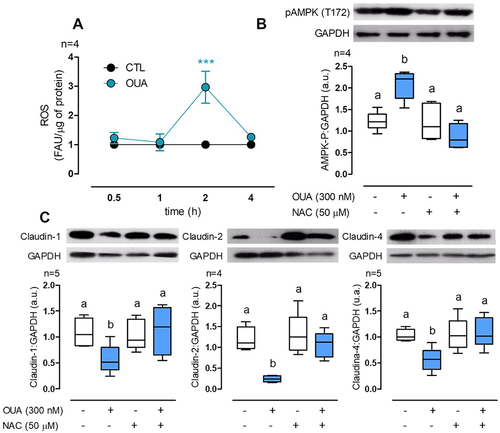
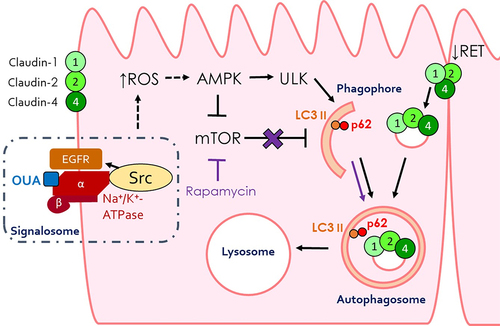
Figure 8. Model of claudins’ abundance regulation by OUA through autophagy. OUA pathway is depicted in black lines and the rapamycin one in purple lines. Dashed arrows represent indirect modulation. See the text for details.