Figures & data
Figure 1. ULK1- and p62-positive structures accumulate in atg9a KO cells. (A-E) MEFs from wild-type, atg7 KO and atg9a KO mice were starved for 1 h, fixed, and immunostained with antibodies. (A) Immunopositive staining for LC3 (green) and p62 (magenta) is shown in these cells. (B and C) Bar graphs showing the percentages of p62 puncta area (B) and LC3 puncta area (C) per cytoplasmic area in (A). The mean and SEM are shown. (D) MEFs immunostained with anti-ULK1 (magenta) and anti-p62 (green) antibodies are shown. ULK1 and p62 was well colocalized in atg9a KO cells. (E) A bar graph shows percentages of areas for ULK1 puncta with p62 puncta per cytoplasmic area in (D). (F) MEFs expressing GFP-p62 (green) were starved for 1 h, fixed, and immunostained with anti-ULK1 (magenta) antibody. GFP-positive puncta were well colocalized with puncta immunopositive for ULK1. Boxed areas are enlarged in the left-hand corner. Statistical analysis was performed using one-way ANOVA with Tukey’s multiple comparisons using GraphPad Prism. *p < 0.05. Scale bars, 5 µm.
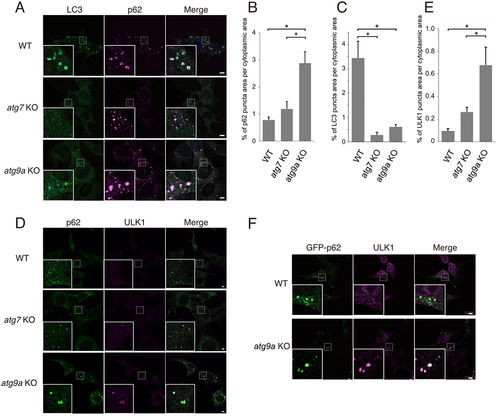
Figure 2. A workflow for precise volume CLEM. (A) Cells on a gridded coverslip were stained with MitoTracker Red (magenta), fixed and observed with a confocal fluorescence microscope (FM). After confocal z-stack images were taken, the cells were postfixed and embedded for electron microscopy. The surface of the EPON block was observed under a scanning electron microscope (SEM). The boxed area is the region of interest (ROI). Scale bars, 20 µm. (B) The ROI is marked with platinum deposition for the following trimming step. (C) The Epon block is cut into small pieces, including the ROI, and vertically attached to an SEM stub. The upper surface of the block is trimmed with an ultramicrotome to the deposition marks. The distance from the top surface to the ROI, two-headed arrow, is less than 20 µm. (D) Correlated images of FM and SEM. The patterns of mitochondria that are easy to distinguish (dotted circle) are used as landmarks for correlation. The optical slice thickness of the FM z-stacks is 200 nm. The lower images are the XZ projection, including circled areas. The number of z-stacks of FM and the slice number of FIB/SEM are shown. Scale bars, 500 nm.
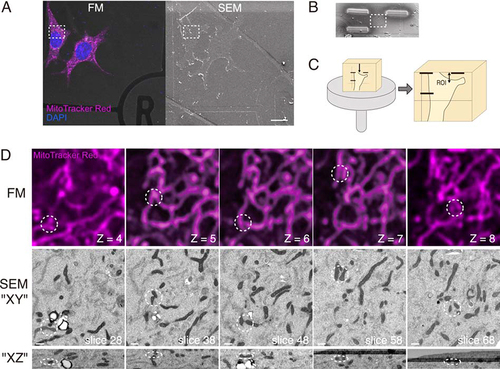
Figure 3. Volume CLEM analysis of WT and atg7 KO MEFs. MEFs expressing GFP-p62 (green) were labeled with MitoTracker Red (magenta). Serial images were taken with FM and FIB/SEM. (A) CLEM images of the WT cell. (B) CLEM images of the atg7 KO cell. The optical slice thickness of FM z-stacks is 200 nm (A) or 80 nm (B). Arrowheads indicate p62-containing autophagic vacuoles (WT), or phagophores adjacent to p62 aggregates (atg7 KO). Scale bars, 500 nm.
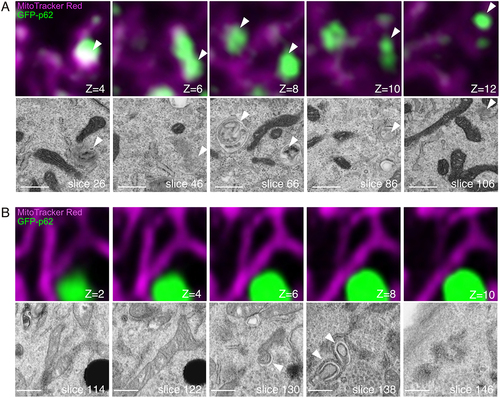
Figure 4. Volume CLEM analysis reveals that ER and phagophores partly surround GFP-p62 aggregates in atg9a KO cells. (A) Representative FIB/SEM slice images and corresponding FM images of atg9a KO cells. The slice numbers of SEM and the z-stack numbers of FM are shown. The optical slice thickness of FM z-stacks is 80 nm. ER are closely in contact with the GFP-p62 aggregates (arrowheads). Asterisk, lysosome-like structure. (B) A segmented 3D model of GFP-p62 (green) and ER (red). (C) The crescent-shaped membrane with internal vesicles (arrows) and a vacant region (arrowhead). A segmented 3D model is shown. (D) Serial images of GFP-p62 and corresponding SEM figures that show the phagophore surrounding GFP-p62 aggregates in atg9a KO cells. The optical slice thickness of FM z-stacks is 180 nm. (E) Magnified images of membrane structures in (D). (F) A segmented 3D model of the phagophore (yellow). Also see Video S1A. Scale bars, 500 nm.
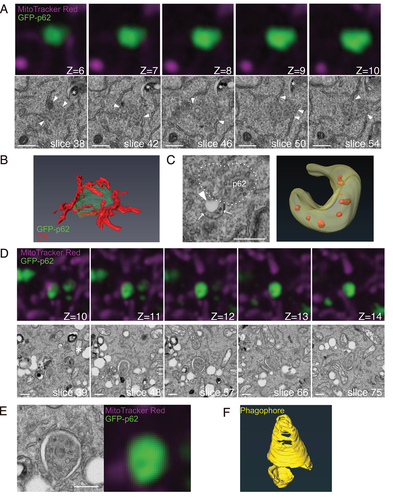
Figure 5. Phagophore-like structures are found around endogenous p62 in atg9a KO cells. (A) atg9a KO MEFs were starved for 60 min, fixed, and immunostained with anti-ULK1 (green), anti-p62 (red), and anti-Tom20 (grey). Correlated regions were analyzed with SEM. The slice numbers of SEM and the z-stack numbers of FM are shown. The optical slice thickness of FM z-stacks is 180 nm Arrowheads, membranes inside of p62 aggregates. Arrows, membranes around p62 aggregates. (B) Magnified images of the ULK1- and p62-positive structure in (A). Arrowheads indicate the region without p62 and ULK1. Arrows indicate the p62- and ULK1-positive structure inside of the phagophore. (C) A segmented 3D model of p62 (green) and a phagophore (yellow). Also see Video S1B. Scale bars, 500 nm.
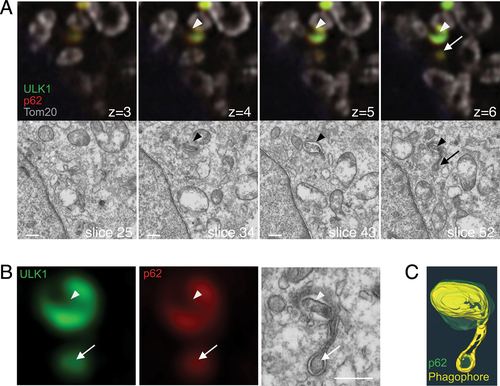
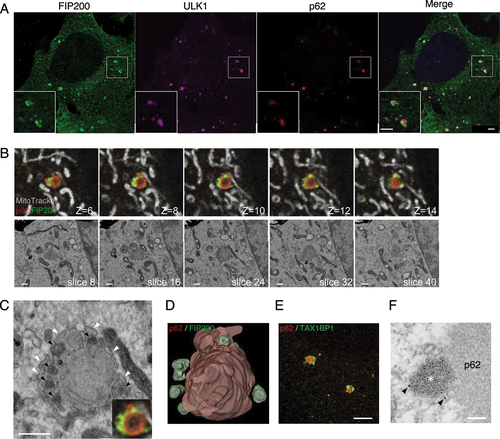
Figure 6. FIP200, but not ULK1, forms puncta with ferritin and TAX1BP1 in the vicinity of p62. (A) atg9a KO MEFs starved for 2 h, fixed, and immunostained against FIP200 (green), ULK1 (magenta), and p62 (red). (B) atg9a KO cells immunopositive for anti-FIP200 (green) and anti-p62 (red) are shown after they were labeled with MitoTracker Red (grey), starved for 2 h, fixed and immunostained. Representative FIB/SEM slice images and corresponding FM images are shown. The optical slice thickness of FM z-stacks is 80 nm. (C) Magnified images of FIP200-positive structures in (B). Black arrowheads indicate electron-dense structures corresponding to FIP200. White arrowheads point to the ER. (D) A segmented 3D model of p62 aggregates (red) and FIP200 (green). Also see Video S1D. (E) Cells were immunopositive for TAXBP1 (green) and p62 (red). (F) Preembedding immunoelectron microscopy with anti-TAX1BP1. Arrowheads, colloidal golds. Asterisk, electron-dense structures around p62. Scale bars, 2 µm in (A) and (E), 500 nm in (B) and (C), and 100 nm in (F).