Figures & data
Figure 1. Atg8 and Atg12 conjugation systems. (A) Conjugation reactions of Atg8–PE and Atg12–Atg5 mediated by E1, E2, and E3 enzymes. G, C, and K represent terminal Gly, catalytic Cys, and conjugating Lys, respectively. (B) Localization of Atg8–PE and Atg12–Atg5–Atg16 during autophagosome formation.
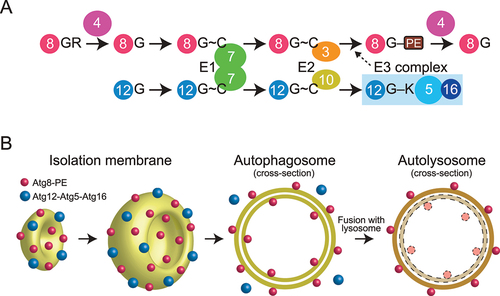
Figure 2. Structure and target recognition of Atg8 and Atg12. (A) Crystal structure of GABARAPL2 (PDB 1EO6). (B) Crystal structure of Arabidopsis thaliana ATG12b (PDB 1WZ3). Left, swapped dimer structure. Right, monomer structure reconstructed from the swapped dimer structure. (C) Target recognition by Atg8-family proteins. Left, crystal structure of S. cerevisiae Atg8 complexed with a fragment from Atg19 (PDB 2ZPN). Right, crystal structure of Homo sapiens LC3B complexed with a fragment from p62 (PDB 2ZJD). (D) Target recognition by Atg12-family proteins. Left, crystal structure of H. sapiens ATG12 complexed with a fragment from H. sapiens ATG3 (PDB 4NAW). Right, crystal structure of A. thaliana ATG12b complexed with a fragment from A. thaliana ATG3 (PDB 7EU4).
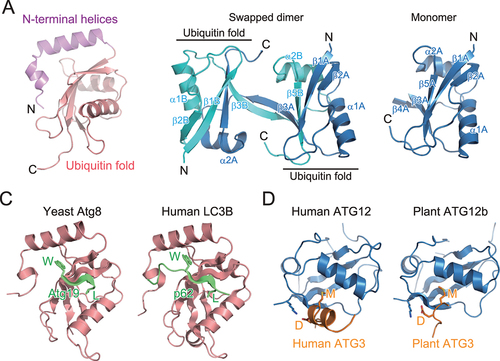
Figure 3. Structure and cleavage mechanism of ATG4 and RavZ. (A) Crystal structure of H. sapiens ATG4B (PDB 2CY7). The side chains of the catalytic residues and Trp142 are shown with a stick model. (B) Crystal structure of the H. sapiens ATG4B–LC3 complex (PDB 2Z0E). (C) Crystal structure of L. pneumophila RavZ (PDB 5CQC). (D) Distinct deconjugation mechanisms of ATG4 and RavZ. FG and F indicate C-terminal residues of LC3 after deconjugation.
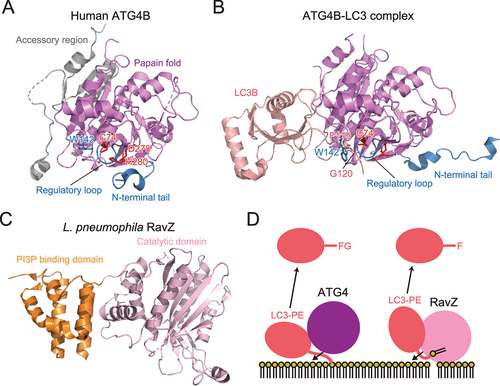
Figure 4. Structure of E1 and E2 enzymes. (A) Crystal structure of Atg7 (PDB 3VH2). (B) Trans mechanism of Atg8 and Atg12 transfer from E1 to E2. (C) Crystal structure of Atg3 (PDB 2DYT). Unique insertions FR and HR are colored dark gray and additional β-strands are colored light gray. (D) Crystal structure of Atg10 (PDB 2LPU). Additional β-strands are colored light gray. In (A), (C), and (D), the side chain of the catalytic cysteine is shown with a sphere model.
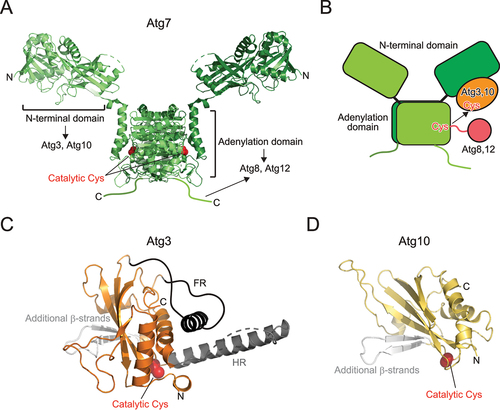
Figure 5. Structure and target recognition of the E3 complex. (A) Crystal structure of Atg5 complexed with the N-terminal domain of Atg16 (PDB 2DYO). (B) Crystal structure of Atg16 (PDB 3A7P). (C) Crystal structure of S. cerevisiae Atg12–Atg5 conjugate bound to the N-terminal domain of Atg16 (left, PDB 5CQC) and homo sapiens ATG12–ATG5 conjugate bound to the N-terminal domain of ATG16L1 (right, PDB 4NAW). (D) Crystal structure of TECPR1 bound to ATG5 (PDB 4TQ1). (E) Crystal structure of Atg16 bound to Atg21 (left, PDB 6RGO) and ATG16L1 bound to WIPI2 (middle, PDB 7MU2; right, PDB 7XFR). (F) Crystal structure of ATG16L1 bound to RAB33B (PDB 6SUR).
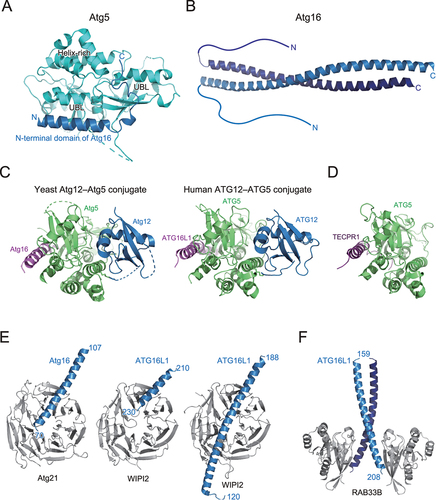
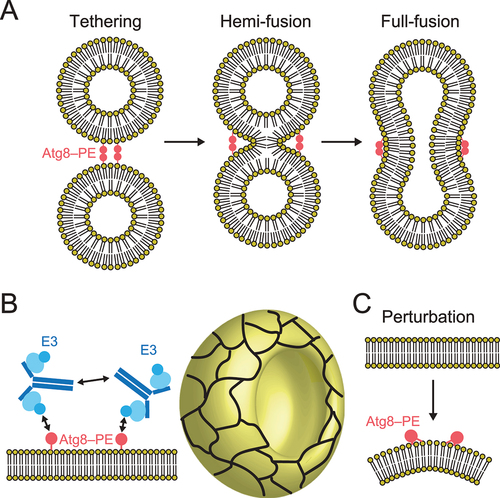
Figure 6. Molecular functions of the Atg8 and Atg12 conjugation systems in membrane dynamics. (A) Membrane tethering, hemi-fusion, and full-fusion activities of Atg8–PE. (B) Proposed model of membrane shaping by Atg8–PE and Atg12–Atg5–Atg16. Cyan ellipse, blue disc, and dark blue lines indicate Atg5, Atg12, and Atg16, respectively. Meshwork on the cup shape (isolation membrane) indicates a higher order assemblage of Atg8–PE and Atg12–Atg5–Atg16. (C) Membrane perturbation activity of Atg8–PE.