Figures & data
Figure 1. Generation and basal characterization of MALT-1 mutants in C. elegans. (A) Overview of the protein structure of human and C. elegans MALT-1, comprising a death domain (DD), immunoglobulin (Ig) domains and a caspase-like protease domain (caspase-like). The positions of the active site histidine and cysteine residues are indicated. (B) Illustration and confocal imaging of the GFP::MALT-1 construct used to visualize MALT-1 expression. The construct was generated by a 5’ in-frame insertion of GFP into exon 1, replacing the natural start codon of malt-1 by the last codon of GFP. Confocal imaging shows GFP::MALT-1 expression in a young animal. MALT-1 is mostly expressed in the annotated structures. The white dotted line represents the pharynx and the red dotted line the nerve ring. Scale bar: 25 μm. (C) Overview of the malt-1 gene structure in the wild-type (N2) and mutated strains generated for this study. malt-1 exons are shown in red. The position (*) of the inactivating gene mutation and the exon structure of the malt-1 gene, where a cysteine at the position 374 is mutated to an alanine (C374A), is illustrated. The strains overexpressing MALT-1 (MALT-1OE, MALT-1OE NS, MALT-1OE Int) were generated by insertion of the malt-1 gene with its 3’UTR next to the gene promoters dpy-30, rgef-1 and ftn-1, driving strong expression in a ubiquitous manner (OE), in the nervous system (OE NS) and the intestine (OE Int), respectively. Arrows indicate the reading sense of the malt-1 and flanking genes. (D) PCR analysis of the indicated C. elegans strains, monitoring presence or absence of wild-type or mutated malt-1 and act-3 (a housekeeping gene, used as a control for equal DNA content) for each indicated strain.
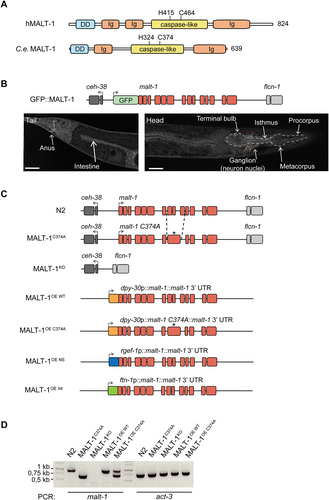
Figure 2. Intestinal MALT-1 expression shortens the lifespan of C. elegans. (A, B) Lifespan of pan-neuronal (A) and intestinal (B) RNAi-sensitive strains on empty vector (EV) or malt-1 RNAi-containing bacteria, at 20°C. The pan-neuronal RNAi and the intestinal RNAi curves were significantly different from EV-fed animals, p-values <0.05 and <0.01 respectively. (C, D) Lifespan of strains overexpressing wild-type MALT-1 in the nervous system (NS) under the regf-1 promoter (C) and in the intestine (Int) under the ftn-1 promoter (D). MALT-1OE NS and MALT-1OE Int curves were significantly different from N2, p-values <0.0001 and <0.01 respectively. Lifespan was measured for the indicated strains at 20°C on OP50. (E-F) Comparison of the lifespan of N2 with the catalytically inactive strain MALT-1C374A and the malt-1 deleted strain MALT-1KO (E) or with the ubiquitously malt-1 overexpressing strain MALT-1OE and its inactive version MALT-1OE-C374A (F), on NGM plates streaked with OP50. P-values were <0.01 for the MALT-1C374A curve and <0.0001 for the others. Results of one representative experiment performed in triplicate are depicted, with an average of 75 nematodes per condition. All graphs are representative of three independent experiments. The log-rank Mantel-Cox test was used to determine p-values.
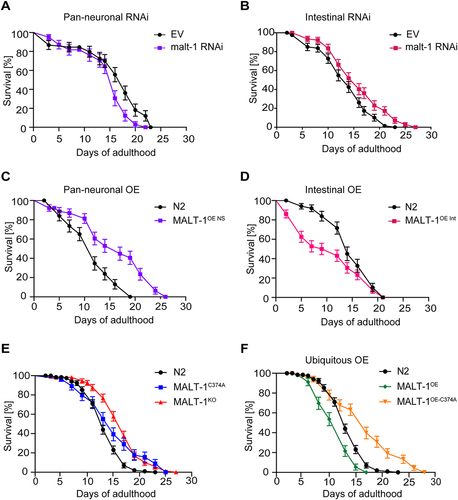
Figure 3. MALT-1KO animals are more resistant to starvation and have higher numbers of autophagosomes than N2. (A) Pharyngeal pumping rate of the indicated strains at 18°C. ** p <0.01; ns, not significant (unpaired t-test). (B) Lifespan test for the indicated starved strains at 20°C. Animals were synchronized at L4 on NGM plates streaked with OP50 until day 2 of adulthood and then transferred (red arrow) onto plates without food and supplemented with ampicillin to avoid contamination. (C) Electron microscopy of synchronized N2 and MALT-1KO animals following starvation for seven days after reaching adulthood. (D) Z-stack of a double membrane vesicle identified as autophagosome (AP). A phagophore (P) surrounding a vesicle is also present. Scale bars: 500 nm. (E) Stereological quantifications of pictures from three N2 and four MALT-1KO animals starved for 7 days. Percentages of double membrane vesicles, mitochondria, cytosol and other organelles within the imaged intestinal cells (excluding intestinal lumen and nuclei). Significant differences were observed for double membrane vesicles (*, p<0.05) and other organelles (**, p<0.1) in N2 and MALT-1KO, using a Mann-Whitney test. (F) Quantification of the number of autophagosomes per intestinal cell. Autophagosomes were counted from three N2 and four MALT-1KO animals, from which multiple images were taken, n=14 for N2 vs n=9 for MALT-1KO. Unpaired t-test was applied (****, P<0.0001). Pharyngeal pumping rate in (A) is representative of three independent experiments. One example graph from four separate tests is shown for the lifespan after food deprivation in (B). For electron microscopy (C), images were taken from multiple animals at day 7 of adulthood.
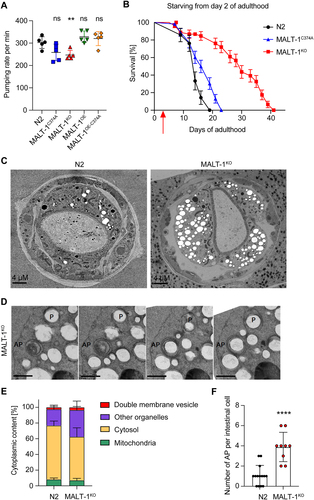
Figure 4. MALT-1 deficiency leads to increased autophagy during aging or under conditions of starvation. (A) Scheme representing the function of the GFP-mCherry-LGG-1 reporter strain used for monitoring autophagy. The fluorescence of GFP is quenched when its environment becomes acidic, such as upon fusion of autophagosomes (yellow) with lysosomes during formation of an autolysosome (red). Representative pictures of the strain under condition of aging at day 5 (left) and day 7 (right) are shown. Scale bars: 50 μm. (B-D) Fluorescence analysis of the anterior intestine of N2 and MALT-1KO strains, crossed to the GFP-mCherry-LGG-1 reporter strain, at days 3, 5 and 7 of adulthood. Representative pictures of C. elegans (B) and quantification of fluorescence intensities (C) are shown. AP, autophagosomes (yellow fluorescence); AL, autolysososme (red fluorescence); AU, arbitrary units. Unpaired t-test was used for statistical analysis (*, p<0.05; **, p<0.01). Scale bars: 25 μm. (D) Quantification of fluorescence intensities in control (CTRL) vs MALT-1KO animals starved for 96 h. Relative fluorescence intensity of autophagosomes (AP) and autolysosomes (AL) is indicated by green and red dots, respectively. AU, arbitrary units. Unpaired t-test was used for statistical analysis (***, p=0.0006; ****, p<0.0001). The complete graph including fed conditions is shown in Figure S4. (E, F) Three representative confocal pictures of living GFP::LGG-1 animals, fed with EV or malt-1-specific RNAi and then starved for 7 days. Scale bars: 25 μm. GFP aggregates in the anterior intestine (E, right panel) were counted in ten animals (F). The puncta number was standardized based on the size of the anterior intestine imaged and expressed as a density (F). A t-test was used, and the p-value is indicated. The experiment was done three independent times.
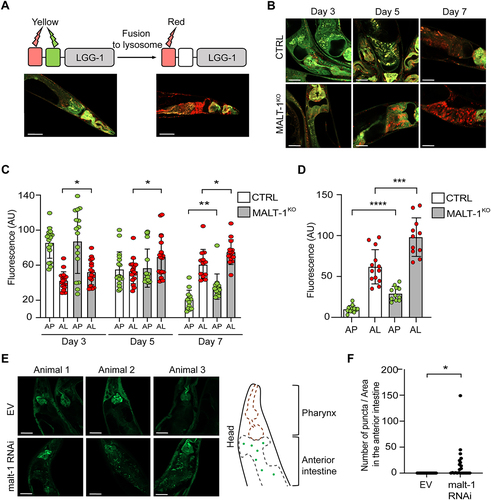
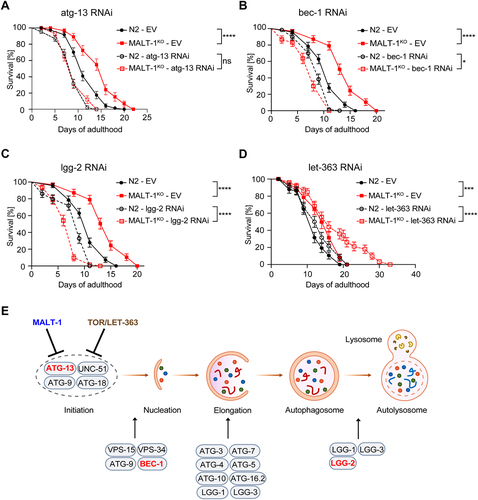
Figure 5. MALT-1 shortens longevity by inhibiting autophagy in a TOR independent manner. (A-D) Lifespan of N2 or MALT-1KO strains grown from stage L4 on bacteria with control (empty vector, EV), atg-13 (A), bec-1 (B), lgg-2 (C) or let-363 (D) RNAi constructs. Graphs showing RNAi against bec-1 (B) and lgg-2 (C) were done in the same experiment and EV conditions are thus identical. The log-rank Mantel-Cox test was used for statistics. * p<0.05, *** p<0.001, **** p<0.0001, ns, not significant. Graphs are representative of two independent experiments for each condition. (E) Model for the inhibitory role of MALT-1 in the regulation of the initiation process of autophagy. C. elegans proteins that promote or inhibit individual steps are annotated. Genes targeted by RNAi in panels (A-C) are highlighted in red.