
Figures & data
Figure 1. Diversity and variability of autophagic flux in human HCC. (A) Western blotting of anti-p62 and anti-LC3 on extracts of tumor (T) and non-tumor (NT) liver tissue from 24 HCC patients. P2: patient number 2. (B) Representative immunohistochemical staining of p62 in tumor and non-tumor areas from the indicated patients (scale bars, 50µM).
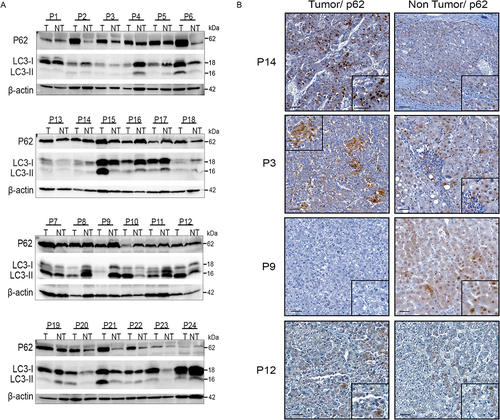
Figure 2. Liver cancer cells are highly susceptible to death by the combined action of sodium butyrate and chloroquine. (A) Representative Western blotting analysis with the indicated antibodies on cell lysates from the indicated liver cancer cell lines, exposed or not to chloroquine (CQ; 5µM) for 48h. The bottom graph represents the mean ± SEM densitometric quantification of LC3-II versus the b-actin control in three independent experiments. (B-E) HuH-7 cells were exposed to sodium butyrate (NaB; 4mM), chloroquine (CQ; 10µM or 20µM) separately or in combination. From panel C onwards, the only CQ concentration used was 20µM. CT: unexposed control cells. (B) Top images: representative photographs of crystal violet-stained cells exposed to the indicated agents for 72h. Three independent experiments. Scale bars, 200µm. Graphs below: two representations (histograms on the left and curves on the right) of the percentage of live HuH-7 cells as a function of time. All conditions: a single histogram is shown, as viability is the same between CT cells and those exposed to NaB or CQ alone or in combination at 24h. Data are means ± SEM of three independent experiments. (C) Representative cytometric analysis of propidium iodide (PI)-stained cells. Graphs represent the mean ± SEM of five independent experiments. (D) Cytometric quantification of apoptosis by annexin V plus PI staining. AV+/PI-: early apoptotic cells (green). AV+/PI+: late apoptotic and necrotic cells (orange). Mean ± SEM of three independent experiments. P-value <0.01 for percentage cell death with NaB and CQ combination versus a single NaB or CQ agent. (E) Western blot analysis of PARP, cleaved PARP (clv PARP) and cleaved caspase 3 (clv Casp-3). Mean ± SEM of densitometry quantification from four independent experiments. (F,G) Quantification of cell death by propidium iodide staining and flow cytometry of cholangiocarcinoma (F) and HCC (G) cell lines exposed to sodium butyrate (NaB) and chloroquine (CQ) separately or in combination for 72h. Data are means ± SEM of three independent experiments. (H) Percentage of primary human hepatocytes alive after exposure to the indicated compounds for 72h versus control cells (CT), assessed by crystal violet absorbance. The graph shows the mean ± SEM of three independent experiments (corresponding to perfused liver pieces from three different surgical subjects). *denotes statistical comparison with untreated cells (CT), $ denotes statistical comparison with cells treated with [Bu 4mM+CQ 20µM]. Statistical comparisons were made using Student’s t-test (A) and Anova (B-C, E-H); *, $ p<0.05; **, $$ p<0.01; ***, $$$ p<0.001.
![Figure 2. Liver cancer cells are highly susceptible to death by the combined action of sodium butyrate and chloroquine. (A) Representative Western blotting analysis with the indicated antibodies on cell lysates from the indicated liver cancer cell lines, exposed or not to chloroquine (CQ; 5µM) for 48h. The bottom graph represents the mean ± SEM densitometric quantification of LC3-II versus the b-actin control in three independent experiments. (B-E) HuH-7 cells were exposed to sodium butyrate (NaB; 4mM), chloroquine (CQ; 10µM or 20µM) separately or in combination. From panel C onwards, the only CQ concentration used was 20µM. CT: unexposed control cells. (B) Top images: representative photographs of crystal violet-stained cells exposed to the indicated agents for 72h. Three independent experiments. Scale bars, 200µm. Graphs below: two representations (histograms on the left and curves on the right) of the percentage of live HuH-7 cells as a function of time. All conditions: a single histogram is shown, as viability is the same between CT cells and those exposed to NaB or CQ alone or in combination at 24h. Data are means ± SEM of three independent experiments. (C) Representative cytometric analysis of propidium iodide (PI)-stained cells. Graphs represent the mean ± SEM of five independent experiments. (D) Cytometric quantification of apoptosis by annexin V plus PI staining. AV+/PI-: early apoptotic cells (green). AV+/PI+: late apoptotic and necrotic cells (orange). Mean ± SEM of three independent experiments. P-value <0.01 for percentage cell death with NaB and CQ combination versus a single NaB or CQ agent. (E) Western blot analysis of PARP, cleaved PARP (clv PARP) and cleaved caspase 3 (clv Casp-3). Mean ± SEM of densitometry quantification from four independent experiments. (F,G) Quantification of cell death by propidium iodide staining and flow cytometry of cholangiocarcinoma (F) and HCC (G) cell lines exposed to sodium butyrate (NaB) and chloroquine (CQ) separately or in combination for 72h. Data are means ± SEM of three independent experiments. (H) Percentage of primary human hepatocytes alive after exposure to the indicated compounds for 72h versus control cells (CT), assessed by crystal violet absorbance. The graph shows the mean ± SEM of three independent experiments (corresponding to perfused liver pieces from three different surgical subjects). *denotes statistical comparison with untreated cells (CT), $ denotes statistical comparison with cells treated with [Bu 4mM+CQ 20µM]. Statistical comparisons were made using Student’s t-test (A) and Anova (B-C, E-H); *, $ p<0.05; **, $$ p<0.01; ***, $$$ p<0.001.](/cms/asset/c8df7630-86ac-497a-a637-aeb4d9a282f2/kauo_a_2326241_f0002_oc.jpg)
Figure 3. Dramatic increase in LC3-positive vesicular structures in cancer cells exposed to NaB and CQ. (A) Anti-transcription factor EB (TFEB) Western blot of HuH-7 cell extracts, untreated (CT) or treated with sodium butyrate (NaB; 4mM). (B) mRNA expression levels of the indicated lysosomal gene markers and the autophagy-related LC3 gene in cells treated with sodium butyrate (NaB; 4mM) or untreated (CT). Mean ± SEM of three independent experiments. (C) Representative anti-LAMP1 immunofluorescence for late lysosomes and endosomes and Hoechst images of HuH-7 cells exposed or not to 4mM NaB. Mean ± SEM of the number of LAMP-1-positive puncta per cell from two independent experiments. Scale bars, 10µM. (D) Representative Western blotting analysis with indicated antibodies on HuH-7 cell lysates, exposed to sodium butyrate (NaB, 4mM) or chloroquine (CQ, 20µM) or both for 72h. Mean ± SEM densitometry quantification of LC3-I, LC3-II and p62 versus b-actin control in four independent experiments. CT: unexposed control cells. (E) Representative anti-LC3 immunofluorescence for autophagy and Hoechst images. Quantification of the mean number of LC3-positive puncta per cell from 3 independent experiments using the ImageJ quantification tool. Scale bars, 10µM. CTSB: Cathepsin B; CTSD: Cathepsin D; CTSF: Cathepsin F; GNS: N-acetylglucosamine-6-sulfatase; LIPA: Lysosomal acid lipase; SMPD1: Sphingomyelin phosphodiesterase 1; LAMP2: Lysosomal-associated membrane protein 2; SCARB2: Scavenger receptor class B member 2; MAP1LC3A: Microtubule associated protein 1 light chain 3 alpha. * denotes statistical comparison with untreated cells. $ denotes statistical comparison with [Bu+CQ]-treated cells. Statistical comparisons were made using Student’s t-test (A-C) and Anova (D, E). *, $ p<0.05; **, $$ p<0.01; ***, $$$ p<0.001.
![Figure 3. Dramatic increase in LC3-positive vesicular structures in cancer cells exposed to NaB and CQ. (A) Anti-transcription factor EB (TFEB) Western blot of HuH-7 cell extracts, untreated (CT) or treated with sodium butyrate (NaB; 4mM). (B) mRNA expression levels of the indicated lysosomal gene markers and the autophagy-related LC3 gene in cells treated with sodium butyrate (NaB; 4mM) or untreated (CT). Mean ± SEM of three independent experiments. (C) Representative anti-LAMP1 immunofluorescence for late lysosomes and endosomes and Hoechst images of HuH-7 cells exposed or not to 4mM NaB. Mean ± SEM of the number of LAMP-1-positive puncta per cell from two independent experiments. Scale bars, 10µM. (D) Representative Western blotting analysis with indicated antibodies on HuH-7 cell lysates, exposed to sodium butyrate (NaB, 4mM) or chloroquine (CQ, 20µM) or both for 72h. Mean ± SEM densitometry quantification of LC3-I, LC3-II and p62 versus b-actin control in four independent experiments. CT: unexposed control cells. (E) Representative anti-LC3 immunofluorescence for autophagy and Hoechst images. Quantification of the mean number of LC3-positive puncta per cell from 3 independent experiments using the ImageJ quantification tool. Scale bars, 10µM. CTSB: Cathepsin B; CTSD: Cathepsin D; CTSF: Cathepsin F; GNS: N-acetylglucosamine-6-sulfatase; LIPA: Lysosomal acid lipase; SMPD1: Sphingomyelin phosphodiesterase 1; LAMP2: Lysosomal-associated membrane protein 2; SCARB2: Scavenger receptor class B member 2; MAP1LC3A: Microtubule associated protein 1 light chain 3 alpha. * denotes statistical comparison with untreated cells. $ denotes statistical comparison with [Bu+CQ]-treated cells. Statistical comparisons were made using Student’s t-test (A-C) and Anova (D, E). *, $ p<0.05; **, $$ p<0.01; ***, $$$ p<0.001.](/cms/asset/44195e83-953d-4b94-b6d5-451f223cf15c/kauo_a_2326241_f0003_oc.jpg)
Figure 4. NaB combined with CQ causes autophagosomes to accumulate in cancer cells. (A) Representative immunofluorescence images showing RFP/GFP-LC3 and Hoechst (blue) in HuH-7 cells stably transfected with Lv-RFP/GFP-LC3 incubated with sodium butyrate (NaB, 4mM), chloroquine (CQ, 20µM), or both for 72h. CT: untreated control cells. Lv: lentivirus. Three independent experiments. Scale bars, 10µM. (B) Representative flow cytometric analysis of lysosomal compartments using the fluorescent probe Cytopainter Lysodeep red (lysosomal red staining reagent, LSR) for non-transfected Huh-7 cells treated with the indicated agents. Right: graphs showing the mean ± SEM of the percentage of cells showing high (top) and low (bottom) LSR fluorescence from two independent experiments. FSC: forward scatter. (C) Western blot analysis of the lysosomal enzyme cathepsin-D (CatD). * indicates statistical comparison with untreated cells. $ indicates statistical comparison with [Bu+CQ]-treated cells. Statistical comparisons were made using Anova. ***, $$$ p<0.001.
![Figure 4. NaB combined with CQ causes autophagosomes to accumulate in cancer cells. (A) Representative immunofluorescence images showing RFP/GFP-LC3 and Hoechst (blue) in HuH-7 cells stably transfected with Lv-RFP/GFP-LC3 incubated with sodium butyrate (NaB, 4mM), chloroquine (CQ, 20µM), or both for 72h. CT: untreated control cells. Lv: lentivirus. Three independent experiments. Scale bars, 10µM. (B) Representative flow cytometric analysis of lysosomal compartments using the fluorescent probe Cytopainter Lysodeep red (lysosomal red staining reagent, LSR) for non-transfected Huh-7 cells treated with the indicated agents. Right: graphs showing the mean ± SEM of the percentage of cells showing high (top) and low (bottom) LSR fluorescence from two independent experiments. FSC: forward scatter. (C) Western blot analysis of the lysosomal enzyme cathepsin-D (CatD). * indicates statistical comparison with untreated cells. $ indicates statistical comparison with [Bu+CQ]-treated cells. Statistical comparisons were made using Anova. ***, $$$ p<0.001.](/cms/asset/b523ca6f-e57e-482c-a1dd-579699b5555e/kauo_a_2326241_f0004_oc.jpg)
Figure 5. Autophagosome accumulation and lysosomal membrane permeabilization are consistent with cell death triggered by the combination of NaB and CQ. (A) Anti-LC3 Western blot analysis of extracts from HuH-7 cells treated with the autophagy inhibitor spautin1 (Sp1, 5µM) or not (-; DMSO) for the times indicated. Right: Mean ± SEM densitometry quantification from 2-3 independent experiments. (B) Anti-LC3 Western blot analysis of HuH-7 extracts incubated with spautin1 (Sp1) or not (-; DMSO) exposed with sodium butyrate (NaB, 4mM), chloroquine (CQ, 20µM), or both for 72h. Right: Mean ± SEM densitometry quantification from 2-3 independent experiments. (C) Representative immunofluorescence images showing LC3 (red), LAMP-1 (green) and Hoechst (blue) in HuH-7 cells incubated with spautin1 (Sp1) or not (-; DMSO) exposed to sodium butyrate (NaB, 4mM), chloroquine (CQ, 20µM), or both for 72h. CT: untreated control cells. Three independent experiments. Scale bars, 10µM. (D) Cytometric quantification of cell death by propidium iodide staining 72h after exposure to NaB, CQ or both in the presence or absence of spautin. CT: control cells. Mean ± SEM of 3-4 independent experiments. (E) Western blot analysis of PARP, cleaved PARP (clv PARP) and cleaved caspase 3 (clv Casp-3). Mean ± SEM densitometry quantification from 2-3 independent experiments. (F) Anti-LC3 Western blot analysis on extracts from HuH-7 cells transfected with (Atg7+Beclin-1 siRNA, 2µM) or not (Ctrl siRNA; 2µM) for the indicated times. (G) Anti-PARP, -cleaved caspase 3 and -LC3 Western blot analysis on extracts from HuH-7 cells transfected with (Atg7+Beclin-1 siRNA, 2µM) or not (Ctrl siRNA; 2µM) for 96h and exposed to the combination NaB/CQ for 72h. (H) Western blot anti-cathepsin-D (CatD) on cytosolic (cy) and lysosomal (ly) fractions of HuH-7 cells exposed to NaB, CQ or both for 72h. Two independent experiments. (I) Representative images of anti-CathepsinD and Hoechst immunofluorescence. Scale bars, 10µM. Three independent experiments. (J) Anti-cathepsin D Western blot analysis on cytosolic (cy) fractions from HuH-7 cells incubated with spautin1 (Sp1) or not (-; DMSO) exposed with sodium butyrate (NaB, 4mM), chloroquine (CQ, 20µM), or both for 72h. Right: Mean ± SEM densitometry quantification from 3 independent experiments. (K) Representative images of anti-CathepsinD and Hoechst immunofluorescence. Scale bars, 10µM. Three independent experiments. Data are averages ± SEM. <, p < 0.05; <<, p<0.01; <<<, p<0.001 by Student’s t test. NS or no statistical indication, no significance.
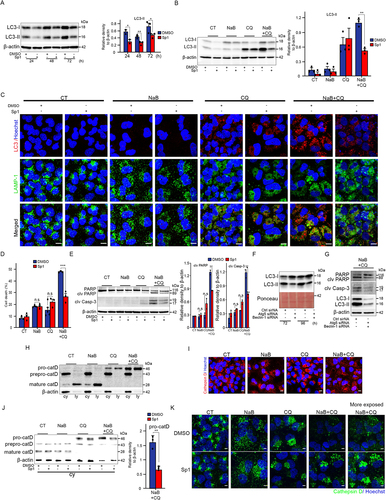
Figure 6. Oxidative stress-induced ROS generation induces death in cancer cells subjected to NaB and CQ. (A) Reactive oxygen species (ROS) levels in HuH-7 cells exposed to sodium butyrate (NaB, 4mM), chloroquine (CQ, 20µM), or both for 72h, measured by flow cytometry with the green fluorescent probe CellROX. Top: Representative flow cytometry curves. Cells with high CellROX content (HIGH): the 7% most strongly fluorescent cells in the unexposed CT control condition. Bottom: Percentage of cells in the high intensity range in 3 independent experiments. (B) Representative photographs of crystal violet-stained cells exposed to the indicated agents in the presence or absence of reduced L-glutathione (RLG, 5mM) for 72h. Three independent experiments. Scale bars, 200µm. (C) Cytometric quantification of cell death by propidium iodide staining. Three independent experiments. (D) Western blot analysis of PARP, cleaved PARP (clv PARP) and cleaved caspase 3 (clv Casp-3). Mean ± SEM densitometry quantification from 2-4 independent experiments. Statistical comparisons were made using Anova for A and Student’s t test for C and D. *, $ p<0.05; **, $$ p<0.01; ***, $$$ p<0.001. For panel 6A: < indicates statistical comparison with untreated cells (CT) and $ indicates statistical comparison with [Bu+CQ]-treated cells. NS or no statistical indication, no significance.
![Figure 6. Oxidative stress-induced ROS generation induces death in cancer cells subjected to NaB and CQ. (A) Reactive oxygen species (ROS) levels in HuH-7 cells exposed to sodium butyrate (NaB, 4mM), chloroquine (CQ, 20µM), or both for 72h, measured by flow cytometry with the green fluorescent probe CellROX. Top: Representative flow cytometry curves. Cells with high CellROX content (HIGH): the 7% most strongly fluorescent cells in the unexposed CT control condition. Bottom: Percentage of cells in the high intensity range in 3 independent experiments. (B) Representative photographs of crystal violet-stained cells exposed to the indicated agents in the presence or absence of reduced L-glutathione (RLG, 5mM) for 72h. Three independent experiments. Scale bars, 200µm. (C) Cytometric quantification of cell death by propidium iodide staining. Three independent experiments. (D) Western blot analysis of PARP, cleaved PARP (clv PARP) and cleaved caspase 3 (clv Casp-3). Mean ± SEM densitometry quantification from 2-4 independent experiments. Statistical comparisons were made using Anova for A and Student’s t test for C and D. *, $ p<0.05; **, $$ p<0.01; ***, $$$ p<0.001. For panel 6A: < indicates statistical comparison with untreated cells (CT) and $ indicates statistical comparison with [Bu+CQ]-treated cells. NS or no statistical indication, no significance.](/cms/asset/bb60e3f0-1dba-4072-88e9-be6758bc8123/kauo_a_2326241_f0006_oc.jpg)