Figures & data
Figure 1. The PINK1 pathway is highly expressed in skeletal muscles and POLGD257A alters calf muscle fibre proportion and mitochondrial content. (A) Gene-expression RNA-seq data analysis of the PINK1/Parkin pathway in different human tissues, obtained from GTEx (Genotype-Tissue Expression). Numbers in brackets after each tissue indicate the number of independent samples. Relative weights of the (B) total gastrocnemius and plantaris, and (C) soleus expressed proportionally to body weight of each mouse (n = 5 per group) of WT, PINK1 knock-out, mutator and double mutant (PINK1KO/POLGD257A) mito-QC mice. Relative weight of the (D) white gastrocnemius (WGC), and (E) red/mixed calf muscles (RCM, red/mixed gastrocnemius + plantaris) expressed proportionally to the weight of the total gastrocnemius + plantaris (n = 5 per group). (F) Representative composite tile-scan micrograph of cross-sections from the hindlimb calf skeletal muscles from a mito-QC wild-type mouse and POLGD257A. Muscles are easily distinguishable by mitochondrial content using the mito-QC GFP expression, with the soleus being highly oxidative, the white gastrocnemius being highly glycolytic, and the red/mixed gastrocnemius presenting an intermediate/oxidative phenotype. Dashed lines delimitate the white gastrocnemius from the red/mixed gastrocnemius. Scale bar: 0.5 mm. Relative cross-sectional area of the (G) white Gastrocnemius and of the (H) red/mixed calf muscles (red/mixed gastrocnemius + plantaris) (n = 9-10). Overall data is represented as mean +/- SEM. Statistical significance of the main effects of the 2-way ANOVAs are displayed below each graph, while results of the post-tests are displayed above the columns being compared. Statistical significance is displayed as *p < 0.05, **p < 0.01, and ****p < 0.0001.
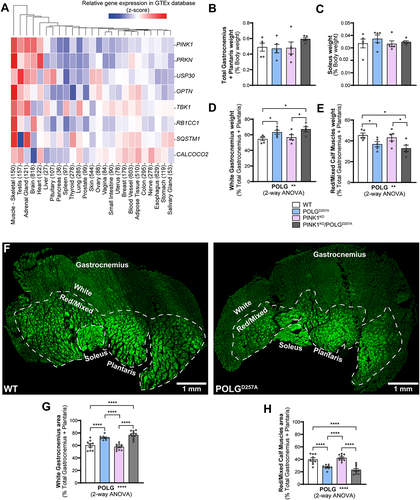
Figure 2. PINK1KO increases mitochondrial content in skeletal muscles without affecting mitochondrial biogenesis. (A) Immunoblots of the indicated mitochondrial proteins and protein involved in mitochondrial biogenesis in the white gastrocnemius (WGC) of WT, PINK1 knock-out, mutator and double mutant (PINK1KO/POLGD257A) mito-QC mice. Quantitation (n = 5 per group) of the (B) mitochondrial proteins and TFAm in the white gastrocnemius (WGC) displayed in (A). (C) Immunoblots of the indicated mitochondrial proteins and proteins involved in mitochondrial biogenesis in the red/mixed calf muscles (RCM, red/mixed gastrocnemius + plantaris). (D) Quantitation (n = 4-5 per group) of the mitochondrial proteins and TFAm in the red/mixed calf muscles (RCM, red/mixed gastrocnemius + plantaris). Overall data is represented as mean +/- SEM. Statistical significance of the main effects, and interaction effects of the 2-way ANOVAs are displayed below each graph, while results of the post-tests are displayed above the columns being compared. Statistical significance is displayed as *p < 0.05, **p < 0.01, ***p > 0.001, and ****p < 0.0001.
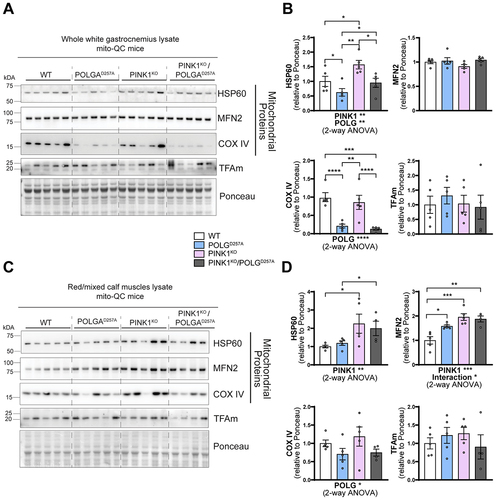
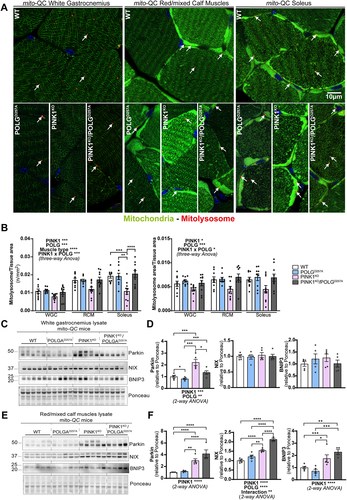
Figure 3. PINK1KO decreases basal mitophagy in skeletal muscles, especially in oxidative fibres while POLGD257A mildly increases it. (A) Representative micrographs of the white gastrocnemius (WGC), the red/mixed calf muscles (RCM, red/mixed gastrocnemius + plantaris), and soleus muscle of WT, PINK1 knock-out, mutator and double mutant (PINK1KO/POLGD257A) mito-QC mice. Scale bar: 10 µm. White arrows indicate examples of mitolysosomes. (B) Quantitation of basal mitophagy expressed as the number of mitolysosomes per tissue area, and the proportion of tissue occupied by mitolysosomes. (C) Immunoblots of the indicated proteins involved in different mitophagy pathways in the white gastrocnemius (WGC) of WT, PINK1 knock-out, mutator and double mutant (PINK1KO/POLGD257A) mito-QC mice. (D) Quantitation (n = 5 per group) of Parkin, BNIP3L/NIX, and BNIP3 in the white gastrocnemius (WGC) displayed in (C). (E) Immunoblots of the indicated proteins involved in different mitophagy pathways in the red/mixed calf muscles (RCM, red/mixed gastrocnemius + plantaris). Quantitation (n = 4-5 per group) of Parkin, BNIP3L/NIX, and BNIP3 in the red/mixed calf muscles (RCM, red/mixed gastrocnemius + plantaris) displayed in (E). Overall data is represented as mean +/- SEM. Statistical significance of the main effects, and interaction effects of the 2-way or 3-way ANOVAs are displayed below or within each graph, while results of the post-tests are displayed above the columns being compared. Statistical significance is displayed as *p < 0.05, **p < 0.01, ***p > 0.001, and ****p < 0.0001.