Figures & data
Figure 1. Hypoxia/reoxygenation-triggered cell death was elevated by the presence of high glucose. A Representative image of H9c2 cells stained with ReadyProbe (green) after H/R or N incubation with or without HG. B Quantification of dead cells from A. C LDH measurement at the time point of 6+24 H/R or N with or without HG. D Caspase 3/7 fluorescence was measured for every 1 h in 6 h hypoxia and 24 hours reoxygenation or 30 h normoxia conditions, data were presented as 3 technical replicates. E Caspase 3/7 fluorescence density at the 30-hour end point of H/R or N. Data represented the mean of 3 biological replicates. F Caspase 3/7 fluorescence was measured for every 1 h in 6 h hypoxia and 24 h reoxygenation or 30 h normoxia conditions with or without HG (25 mM glucose), results represented the mean of 3 biological replicates. G Caspase 3/7 fluorescence density at the end point of H/R or N, with or without HG. Data were presented as 3 biological replicates. H Representative confocal microscope images of H9c2 cells stably expressing VC3AI showing cleaved caspase 3 (green) after H/R (6 hours hypoxia and 24 hours reoxygenation, 6+24 h) or N (30 hours reoxygenation). I Quantification of cleaved caspase 3 per cell from H. J-L Representative western blot images and quantification of cleaved caspase 3, Bax, Bcl-2 and β-tubulin expression in H9c2 cells subjected to 6+24 H/R or N with or without HG. M Representative image of iPSC-cardiomyocytes stained with ReadyProbe (green) after H/R or N incubation with or without HG. N Quantification of panel. Results are presented as mean ± SEM (n = 4 per group) in panel A to L. For panel M-N results are presented as mean ± SEM of n = 3-16 technical replicates. *P < 0.05, **P < 0.01, ***P < 0.001 versus N NG, &P <0.05 versus N HG, #P < 0.05, ##P < 0.01, ###P < 0.001 versus H/R NG. Unpaired T Test was used for statistical analysis for . Ordinary One-way ANOVA with Tukey’s multiple comparison test was run for the rest of statistical analysis. Scale bar: 65 µm in panel A, M, 10 µm in panel H.
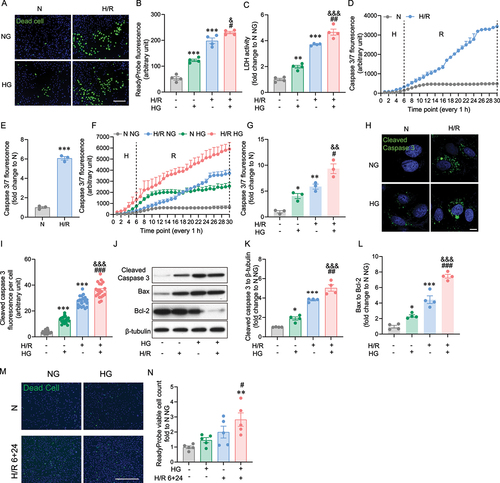
Figure 2. The role of high glucose in hypoxia reoxygenation induced autophagic flux impairment. A DapRed and B DalGreen fluorescence was measured for every 1 hour in 6 hours hypoxia and 24 h reoxygenation or 30 h normoxia conditions, results represented the mean of 3 biological replicates. C Representative confocal microscope images of H9c2 cells stained with DapRed and DalGreen in normoxia or H/R 6+6 h or H/R 6+24 h conditions with or without HG. D Quantification of fluorescence intensity of DapRed and DalGreen per cell. E Representative confocal microscope images of TF-LC3 H9c2 cells in normoxia or H/R 6+6 h or H/R 6+24 h conditions with or without HG. F Quantification of autophagosome and autolysosome per cell. G Luminescence of the HiBiT-LC3 reporter cell. H Representative confocal microscope images of Cathepsin B activity illuminated using MagicRed in H9c2 cells in normoxia or H/R 6+6 h or H/R 6+24 h conditions with or without HG. I Quantification of MagicRed mean intensity per cell in H9c2 cells subjected to 6+6, 6+24 H/R or N with or without HG. J-L Representative western blot images and quantification of p62 and LC3 expression of H9c2 subjected to N, H/R 6+6 h, H/R 6+24 h, treated with or without high glucose. M Immunofluorescence staining of LC3 (green) and p62 (red) in iPSC-cardiomyocytes subjected to H/R 6+24 with or without HG treatment. N-O Quantification of LC3 and p62 mean intensity per cell. P Representative confocal microscope images of Cathepsin B activity illuminated using MagicRed in iPSC-cardiomyocytes in normoxia or H/R 6+24 h conditions with or without HG. Q Quantification of MagicRed mean intensity per cell in iPSC-cardiomyocytes subjected to 6+24 H/R or N with or without HG. Results are presented as mean ± SEM (n = 3-5 per group) from panel A to L. *P < 0.05, **P < 0.01, ***P < 0.001 versus NG N, &P < 0.05, &&P < 0.01, &&&P < 0.001 versus HG N, #P < 0.05, # #P < 0.01, ###P < 0.001 versus NG H/R 6+6 h, $P < 0.05, $$P < 0.01, $$$P < 0.001 versus NG H/R 6+24 h. For panel M-Q results are presented as mean ± SEM of n = 3-16 technical replicates. Ordinary One-way ANOVA with Tukey’s multiple comparison was run for statistical analysis. Scale bar: 10 µm
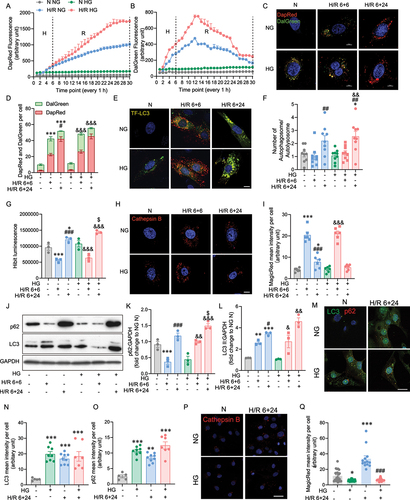
Figure 3. atg7 KO-mediated inhibition autophagy exacerbates cardiomyoblast death induced by hypoxia-reoxygenation and high glucose. A Caspase 3/7 fluorescence was measured every 1 hour in 6 hours hypoxia and 24 hours reoxygenation of WT and atg7 KO cells. Data were presented as 3 technical replicates. B Caspase 3/7 fluorescence density at the endpoint of H/R. Results represented the mean of 3 biological replicates. C-D Representative western blot images and quantification of cleaved caspase 3 and β-tubulin expression in WT and atg7 KO cells subjected to 6+24 H/R or N with or without HG. E-G Flow cytometry in WT and Aatg7 KO cells after 6+24 H/R or N incubation with or without HG stained with PI and Annexin. H LDH release measurement. J-K Representative images of WT and atg7 KO stained with cell death marker, ReadyProbe (green) after 6+24 H/R or N incubation with or without HG. L LDH activity of H9c2 cell treated with rapamycin, Tat-beclin, or chloroquine and subjected to H/R 6+24 or N, with or without HG. Results of ReadyProbe fluorescence are presented as mean ± SEM (n=3 per group). *P < 0.05, **P < 0.01, ***P < 0.001 versus WT NG N, #P < 0.05, ##P < 0.01, ###P < 0.001 versus WT NG H/R, &P < 0.05, &&P < 0.01, &&&P < 0.001 versus WT HG H/R. Ordinary One-way ANOVA with Tukey’s multiple comparison was run for statistical analysis. Scale bar: 65 µm.
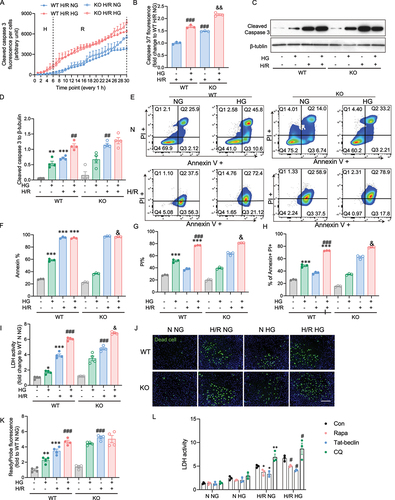
Figure 4. Molecular imaging of autophagy and apoptosis in the myocardium. A Experimental protocol where all mice received one single high dose streptozotocin (STZ) via intraperitoneal injection to induce diabetes, or a vehicle control injection. Four days post-STZ injection, mice were infused with Cathepsin B 680 and Annexin V 750 near-infrared (NIR) probes via jugular vein cannula as described in the Methods. Mice then underwent 35 min ligation of the left anterior descending artery followed by 24-72 h of reperfusion as indicated. Non-invasive fluorescence molecular tomography (FMT) immediately followed by computed tomography (CT) imaging was performed 24, 48, and 72 h post-ischemia. B FMT and CT co-registration was used to accurately localize NIR probe activity within the myocardium. A mouse is shown with a region of interest (ROI) tightly restricted to the myocardium with detected signals from Cathepsin B 680 and Annexin V 750. C Serial coronal-slices through the heart from dorsal to ventral and sagittal-slices from left to right aspect show distinct localization of Cathepsin B 680 and Annexin V 750. D FMT quantification of whole-heart ROI at 24, 48, and 72h post-I/R shows Cathepsin B activity is reduced in diabetic mice at all time-points compared to vehicle-injected mice. E FMT quantification of whole-heart ROI 24, 48, and 72h post-I/R shows that Annexin V binding is increased in both conditions, over-time, however, the increasing slope for hyperglycemia is comparably higher than vehicle injected mice. F Representative myocardium ROIs of 72h post I/R surgery are shown with serial optical sections. ROIs were determined by CT-FMT co-registration and the coronal sections for Cathepsin B 680 and Annexin V 750 from FMT files were displayed from dorsal to ventral. G and H show images captured from ex vivo hearts indicating spatially localized activation of Cathepsin B and binding of Annexin V after cardiac ischemia and 72 h of reperfusion. In E-F, n = 3~8, * indicates P < 0.05 vs control at respective time points. Ordinary one-way ANOVA with Tukey’s multiple comparison was run for statistical analysis.
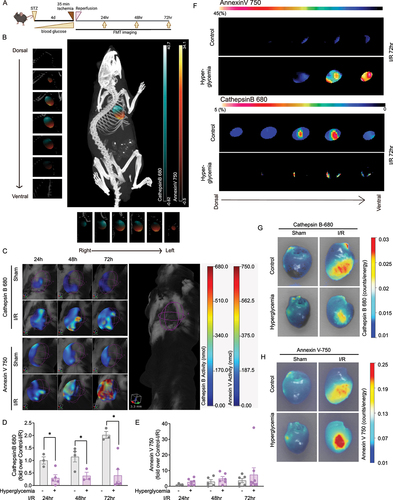
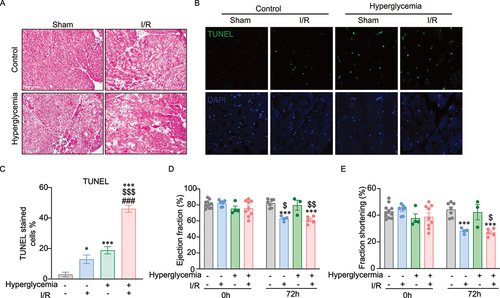
Figure 5. Histological and functional analysis of cell death in mouse hearts. A Representative H&E-stained images showing tissue morphology in control and hyperglycemic mice after sham surgery or ischemia followed by 72 h reperfusion. B-C Cell death in heart tissue sections was detected by TUNEL staining. Representative images and quantification analysis in a graph are shown here. D-E Cardiac function was assessed by fractional shortening (FS) and ejection fraction (EF) determined by echocardiography in lightly anesthetized mice before ischemia surgery (Day 0) and after 72 h of reperfusion. FS and EF were significantly reduced after 72 h of reperfusion in both control and hyperglycemia. n=3~11, *indicates versus control-sham (*P <0.05, ***P < 0.0001). $ indicates versus hyperglycemia-sham ($P <0.05, $$P < 0.001, and $$$P < 0.0001), # indicates versus control-I/R (#P <0.05, ##P < 0.001, and ###P < 0.0001). Ordinary One-way ANOVA with Tukey’s multiple comparison was run for statistical analysis.