
Figures & data
Table 1. Primer sequences metabolizing gene and their respective restriction enzymes.
Table 2. Clinical and pathological characteristics.
Figure 1. (a) 12% Native gel RFLP of ABCG2(rs 4693924) M-50bp Marker, 1, 4,5-mt/mt genotypes type;2,3-wt/mt genotypes; (b) ABCC2(rs2804398) M-50bp Marker 2-wt/wt genotype, 1, 3-8-mt/mt genotypes; (c) ABCC4 (rs 943288) M-50bp Marker, 1,2,3,5,6-mt/mt genotypes; 4-wt/mt; genotype;7-wt/wt genotype (d) ABCC1 (rs 9332430) M-50bp Marker, 1,2,4,5,8-mt/mt genotypes; 6-wt/mt genotype, 7-wt/wt genotype
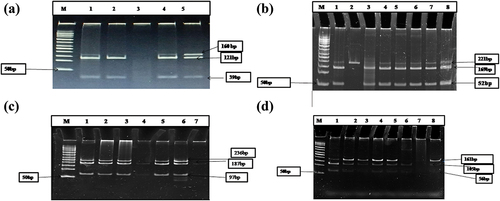
Table 3. Transporter genes and allele frequency of SNPs.
Table 4. Association between genetic polymorphisms and toxicity.
Figure 2. (a) The Kaplan—Meier curve showing the association between the ABCG2 rs4693924genotypes and progression -free survival of patients treated with induction chemotherapy. (b) The Kaplan—Meier curve showing the association between the ABCC2 rs2804398 genotypes and progression -free survival of patients treated with induction chemotherapy. (c) The Kaplan—Meier curve showing the association between the ABCC4 rs943288 genotypes and progression -free survival of patients treated with induction chemotherapy. (d) The Kaplan—Meier curve showing the association between the ABCC1 rs9332430 genotypes and progression -free survival of patients treated with induction chemotherapy
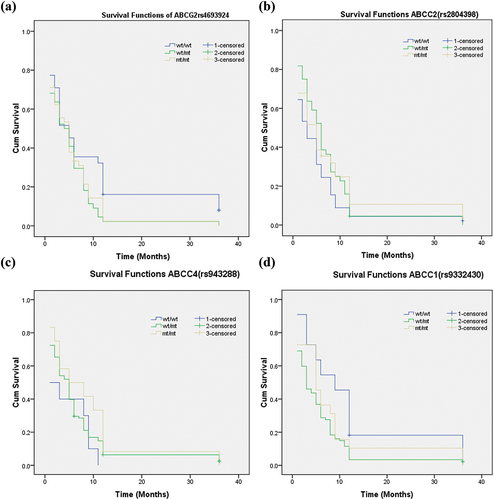
Table 5. Univariate and multivariate analysis of progression-free survival of chemotherapy treated oral cancer patients.
Data Availability Statement
The data that support the findings of this study are available on request from the corresponding author. The data are not publicly available due to privacy or ethical restrictions.