
Figures & data
Figure 1. Locations of the land plots in the transaction price dataset, subdivided by building restriction types (see Appendix for building codes).
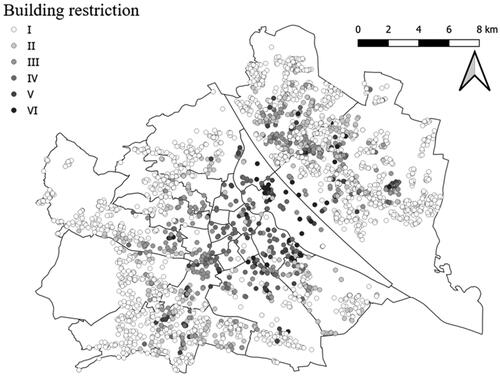
Table 1. Yearly average transaction price per square metre.
Figure 2. Example of network-based 300 m buffer and the location of urban amenities nearby.
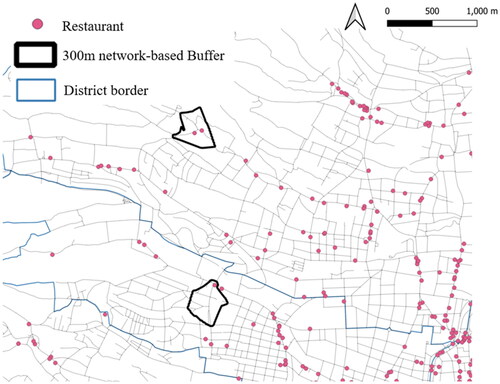
Table 2. Descriptive statistics of the dataset (before standardization).
Table 3. Estimation results of Models 1-1 to 1-2.
Table 4. Estimation results of Models 2-1 to 2-4 (stratification by the building restrictions).
Table 5. Estimation results of Models 3-1 to 3-4 (stratification by the land use).
Table A1. Building restriction codes of Vienna, with the maximum permitted building height within them.