Figures & data
Figure 1 Multiple sequence alignment of VP1 (major capsid protein) sequences from Alpavirinae phages.
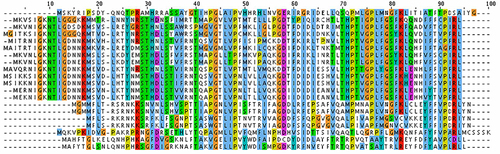
Table 1 Probability values for positions 46–49 from the multiple sequence alignment depicted in Figure 1
Table 2 Probability values with pseudocounts for positions 46–49 from the multiple sequence alignment depicted in Figure 1
Figure 2 Diagram representing a profile hidden Markov model (profile HMM).
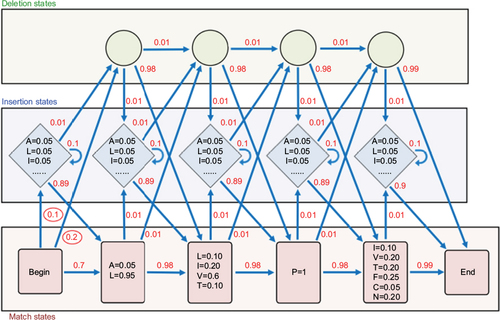
Table 3 Web resources of viral profile HMM databases and tools
Figure 3 Distribution of orthologous groups from vFamCitation35 (A) and pVOGsCitation36 (B) according to the viral families.
Abbreviations: pVOGs, Prokaryotic Virus Orthologous Groups; vFAM, viral profile HMM database; profile HMMs, profile hidden Markov models.
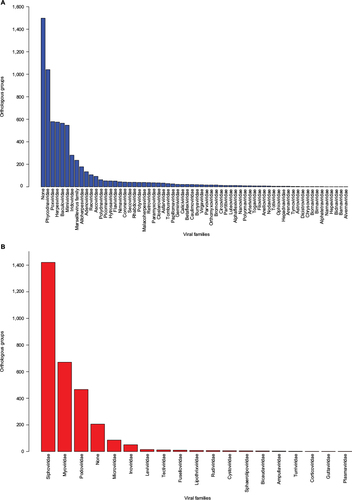
Table 4 Publicly available targeted assembly tools that use profile HMM seeds
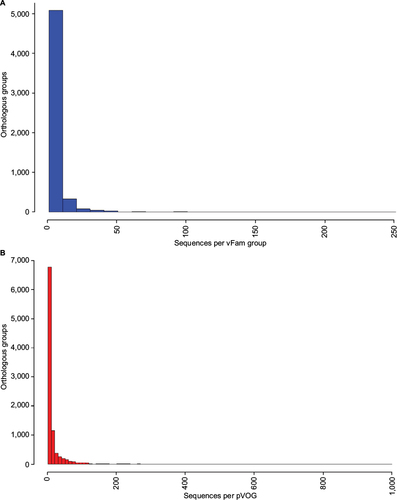
Figure S1 Distribution of number of proteins per orthologous group for vFamCitation1 (A) and pVOGsCitation2 (B).
Abbreviations: pVOGs, Prokaryotic Virus Orthologous Groups; vFAM, viral profile HMM database.