Figures & data
Figure 1 NO can influence a great many physiological systems through a range of bio-physiological mechanisms.
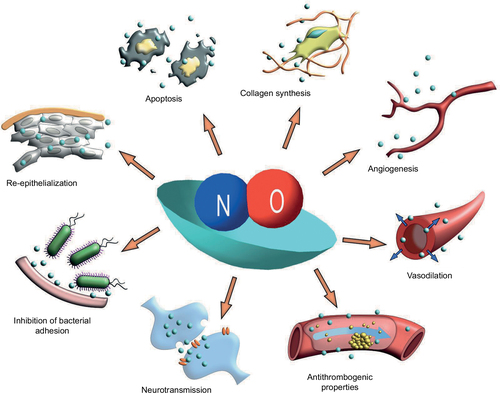
Figure 2 Overview of globule formation and SNAP conjugation.
Abbreviations: DD, dodecylamine; HBTU, O-(1H-benzotriazol-1-yl)-N,N,N′,N′-tetramethyluronium hexoflurophosphate; HOBt, Hydroxybenzotriazole; NO, nitric oxide; OD, octadecylamine; SNAP, S-nitro-N-acetylpenicillamine.
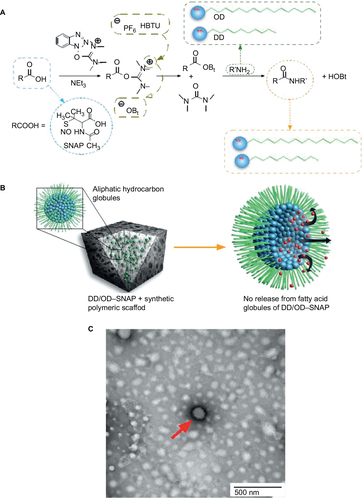
Table 1 Summary of the peaks obtained by LC–MS of SNAP, DD–SNAP, and OD–SNAP
Figure 3 Characterization of LCAH–SNAP–PCU.
Abbreviations: DD, dodecylamine; LCAH, long-chain aliphatic hydrocarbon; OD, octadecylamine; PCU, poly(carbonate-urea); SEM, scanning electron microscopy; SNAP, S-nitro-N-acetylpenicillamine.
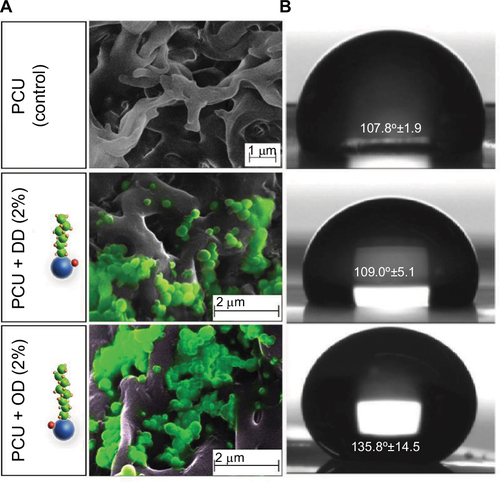
Figure 4 Details of chemiluminescence studies.
Abbreviations: DD, dodecylamine; NO, nitric oxide; NO2, nitrogen dioxide; OD, octadecylamine; O3, ozone; PCU, poly(carbonate-urea); PMT, photomultiplier tube; SNAP, S-nitro-N-acetylpenicillamine.
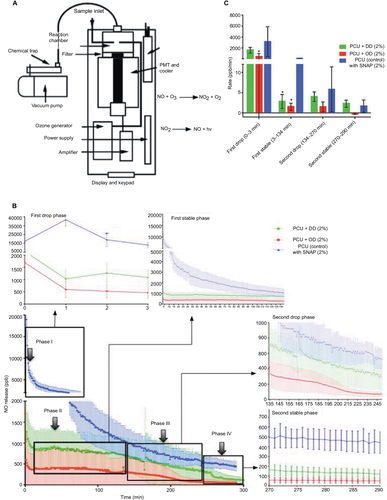
Figure S1 FTIR spectra of DMF, OD–SNAP, and OD–SNAP.
Abbreviations: DD, dodecylamine; DMF, dimethylformamide; FTIR, Fourier transform infrared; OD, octadecylamine; SNAP, S-nitro-N-acetylpenicillamine.
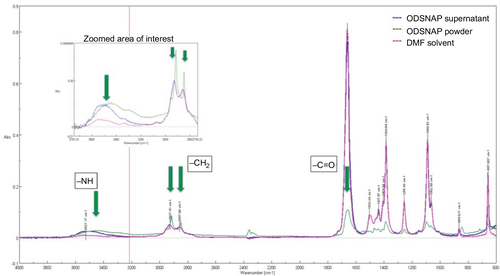
Figure S2 Characterization of LCAH–SNAP–PCU: AFM images showing changes in topography after the addition of OD/DD–SNAP.
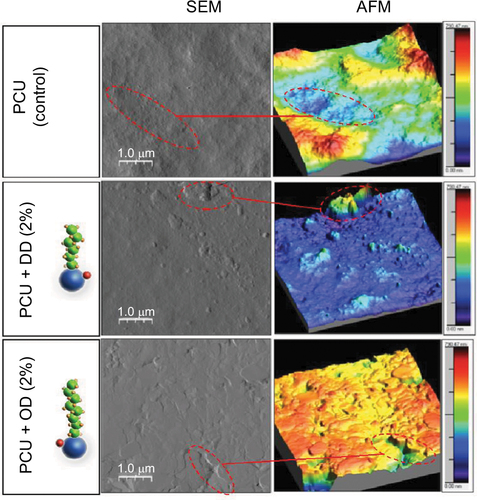
Figure S3 Negatively stained TEM imaging of aliphatic hydrocarbon globules in solvent (1% uranyl acetate). Red arrows indicate the presence of hydrocarbon globules.
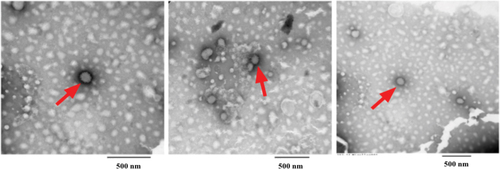
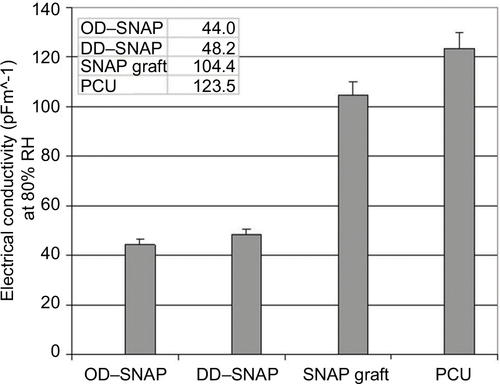
Figure S4 Values for electrical conductivity (pFm^-1) at 80% RH measured after subjecting polymers to increase in RH at 1%/min from 20 to 80% RH and then leaving polymer at 80% RH for 30 min.
Abbreviations: DD, dodecylamine; OD, octadecylamine; PCU, poly(carbonate-urea); SNAP, S-nitro-N-acetylpenicillamine.