
Figures & data
Figure 1 Axial NCECT at the level of the right upper lobe bronchus (left) and at the right lower lobe bronchus (right), showing bilateral peri-hilar thick-walled cylindrical bronchiectasis (arrows) and bronchiectatic changes with cylindrical and varicoid components, some with mucus plugs, as well as cavitating and non-cavitating fibrotic changes within the apical segment of the right lower lobe (open arrow).
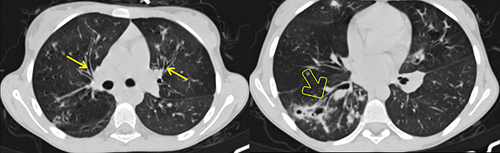
Figure 2 Axial CECT at the level of the main pulmonary artery (MPA) showing enlarged MPA (open arrow) compared to the ascending aorta (triangular open arrow head), measuring 22 mm and 20.1 mm, respectively.
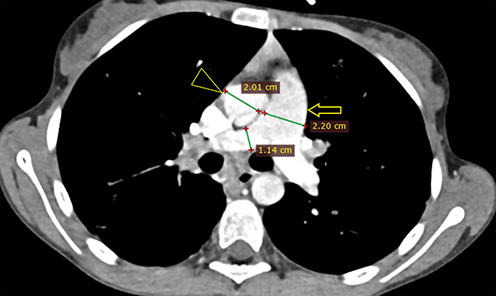
Figure 3 Axial CECT at the level of the gallbladder (between open arrow heads) showing micro-gallbladder (here, measuring 3.79 cm long and 1.3 cm wide), hepatomegaly and hepatic steatosis (elliptical areas showing hepatic and splenic attenuation of −4.65 HU and 154.49 HU, respectively). The vascular markings also stand out against the background hepatic parenchyma, demonstrating more evidence of hepatic steatosis . Measurement of hepatic and splenic attenuation at NCECT and CECT at multiple sections showed a range of −14 to −33 HU on NCECT and −2.5 to 22.5 HU on CECT for liver; which was in comparison to the mean splenic attenuations of 45.5–53.5 and 141.61–154.49 HU at NCECT and CECT, respectively. Please also note beaver’s tail, a normal anatomic variant unrelated to CF, where the liver parenchyma of the left hepatic lobe wraps around the spleen. Riedel's lobe, a normal variant of liver parenchymal extension beyond the lower margin of the kidney, was also seen but is not demonstrated here.
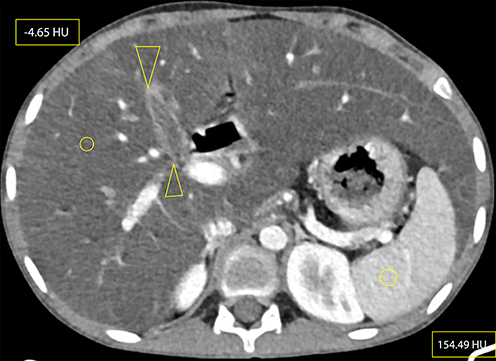
Figure 4 CECT at the level of the pancreatic body and tail showing a completely atrophied pancreas, with pancreatic duct ectasia (curved solid line) surrounded by complete fatty replacement (solid arrow). The former two might signify evidence of chronic pancreatitis.
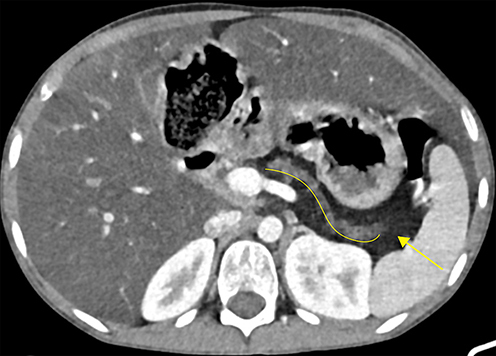
Figure 5 Axial CECT showing symmetric concentric thickening and redundancy of the proximal portion of the colon (open arrow): particularly, the ascending colon, hepatic flexure and proximal half of transverse colon, compared to the distal portion of the transverse colon with normal wall thickness (shaded arrow).
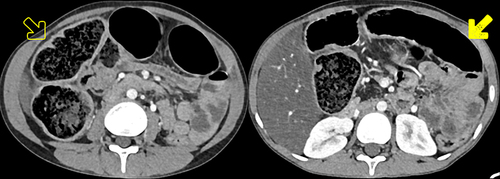
Table 1 Brasfield Scoring System to Evaluate the Evolution of CF Disease Severity on a Plain Radiograph, With a Maximum Possible Score of 25 and a Minimum Score of 3, in Which Points are Subtracted Based on Categorical Score from Each Category Criteria: Higher Overall Score Indicates Greater Disease Severity (slightly modified from reference 16).