Figures & data
Table 1 Selected Characteristics of the Study Population
Figure 1 Study cohort attrition chart.
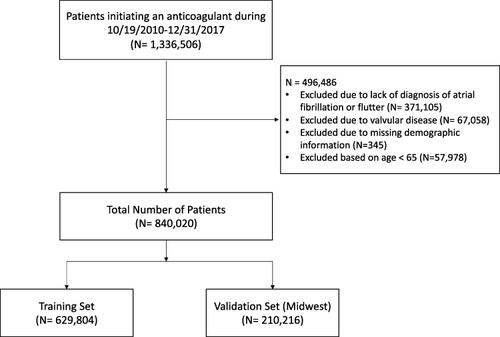
Table 2 Prediction Model for the Risk of 1-Year Risk of Intracranial Bleeding
Figure 2 Observed vs. predicted ICH events based on AF ICH risk model.
Note: Chi-squared values based on the Hosmer-Lemeshow test were 190.1 (p<0.001) in the training set and 46.4 (p<0.001) in the validation set.
Abbreviations: ICH, intracranial hemorrhage; AF, atrial fibrillation.
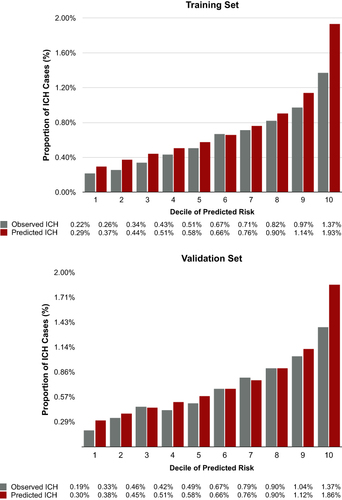
Table 3 Comparison Between Recalibrated HAS-BLED Score and Homer Score vs. New ICH Model: Reclassification of Predicted 1-Year ICH Risk Categories in the Validation Set
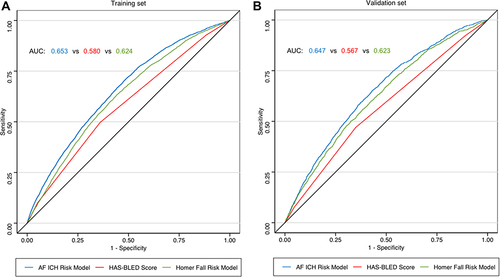
Figure 3 Comparison of AF ICH risk model vs. HAS-BLED score and vs. Homer fall risk model: AUC in predicting 1-year risk of ICH.
Note: (A) (left) displays the model performance in the training set and (B) (right) displays the model performance in the validation set.
Abbreviations: AF, atrial fibrillation; ICH, intracranial hemorrhage; AUC, area under receiver operating characteristic curve.