Figures & data
Table 1 Results of Differences in Insulin Levels Between Groups (p < 0.05)
Table 2 Results of Differences in Blood Glucose Levels Between Groups (p < 0.05)
Figure 1 Graph of average insulin levels.
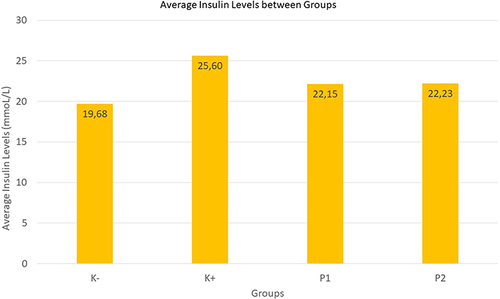
Figure 2 Graph of average glucose levels between groups.
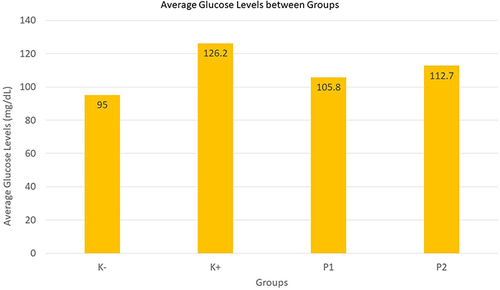
Figure 3 Graph of TNF-α expression mean between groups.
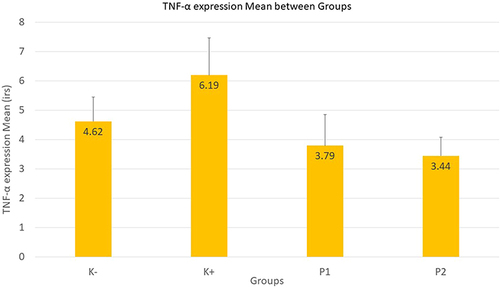
Table 3 Kruskal Wallis Test Results TNF-α Expression Between Groups (p < 0.05)
Figure 4 Comparison of TNF-α expression in the ovary groups (K-, K+, P1, P2). The red arrow indicates the expression of TNF-α in the granulosa cells of the follicle which is indicated by the presence of a chromogen brown color. IHC 400x.
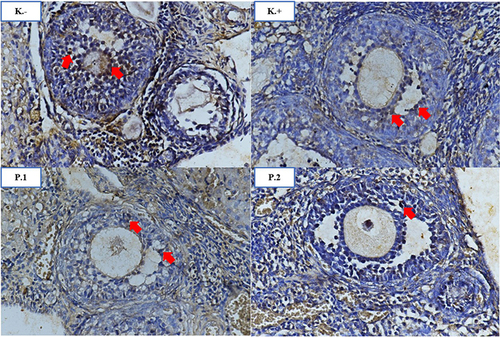
Table 4 The Results Showed That There Was No Significant Difference Between Primordial Follicles Between Groups (p > 0.05)
Table 5 Results of Primary Follicle Differences Between Groups (p < 0.05)
Table 6 Results of Secondary Follicle Differences Between Groups (p < 0.05)
Table 7 Results of Tertiary Follicle Differences Between Groups (p < 0.05)
Table 8 Results of Follicle de Graff Differences Between Groups (p < 0.05)
Figure 5 Graph of primordial follicle mean between groups.
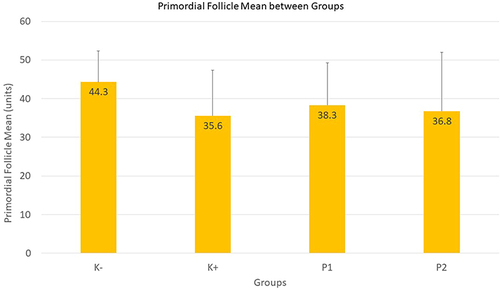
Figure 6 Graph of primary follicle mean between groups.
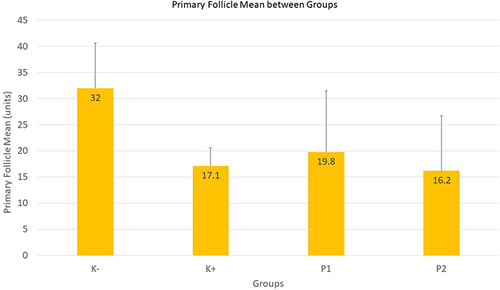
Figure 7 Graph of secondary follicle mean between groups.
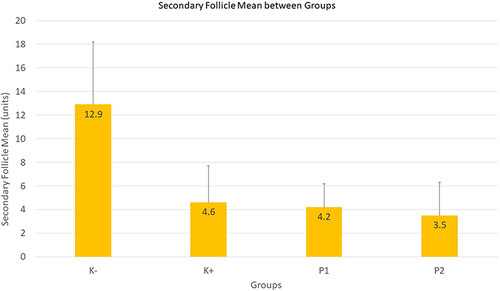
Figure 8 Graph of tertiary follicle mean between groups.
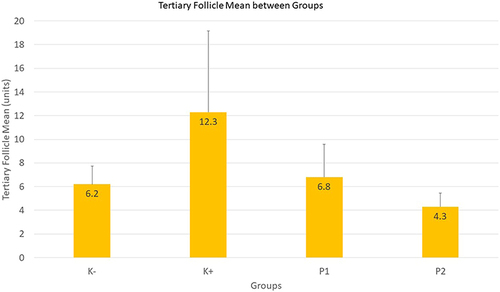
Figure 9 Graph of follicle DeGraff mean between groups.
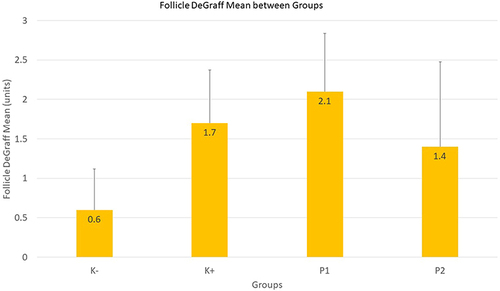
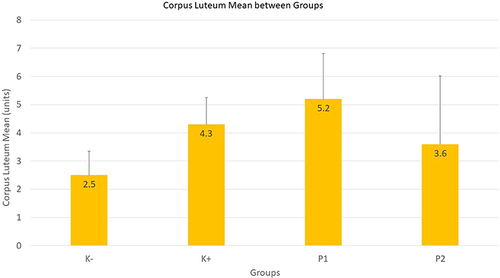
Table 9 Results of Differences in Corpus Luteum Between Groups (p < 0.05)
Figure 10 Graph of corpus luteum mean between groups.