Figures & data
Table 1 Baseline characteristics of participants
Table 2 Body composition after two weeks daily consumption of red wine and grape juice
Table 3 CRP and lipids after two weeks daily consumption of red wine and grape juice
Table 4 Polyphenolic content of wine and grape juice
Figure 1 Changes in augmentation index (AIx). Augmentation index significantly declined after the two weeks post- and pre-acute wine consumption compared to juice consumption. Treatment (P = 0.015) eta 2= 0.284, Time (P = 0.056) eta 2= 0.510, Treatment–Time Interaction (P = 0.291) eta 2= 0.049. aBaseline wine versus post-acute (P ≤ 0.001). Values are mean ± SEM (N=19).
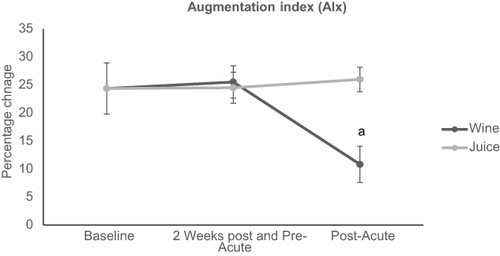
Figure 2 Changes in pulse wave velocity (cPWV). Central pulse wave velocity was unchanged after both wine and juice consumption. Treatment (P = 0.422) eta 2= 0.054, Time (P = 0.712) eta 2= 0.028, Treatment–Time Interaction (P = 0.271) eta 2= 0.103. Values are mean ± SEM (N=19).
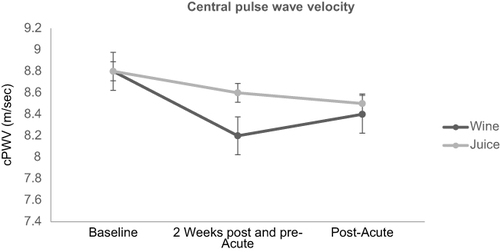
Figure 3 Changes in ferric-reducing ability of plasma (FRAP). aFerric reducing ability of plasma significantly increased after acute wine consumption but not chronic consumption (P = 0.001). Treatment (P = 0.028) eta 2= 0.253, Time (P = 0.160) eta 2= 0.111, Treatment–Time Interaction (P = 0.125) eta 2= 0.130. Values are mean ± SEM (N=19).
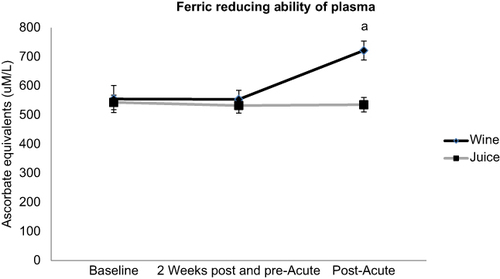
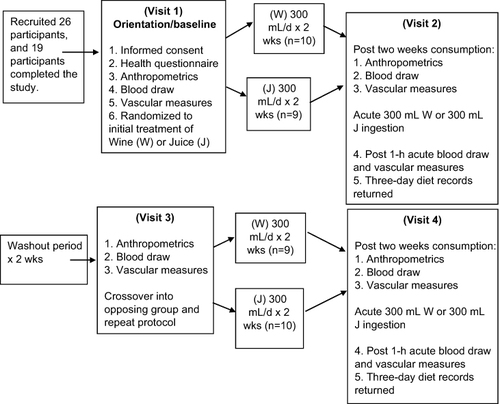
Figure S1 Study Flow Diagram.