
Figures & data
Figure 1 Domain organization in MMPs.
Notes: (A) Overall schematic. Numbers indicate in which MMP family members the various features occur. (B) Representation of the Cat domain from MMP1 depicting the secondary-structure elements within the molecular envelope, and (magnified) details of the catalytic cleft depicting the roles of the His and Glu residues in the characteristic HEXGHXXGXXH motif. (C) Crystal structure of human proMMP1Citation211 showing the relative arrangement of the Pro, Cat, and Hpx domains. Bound calcium and zinc ions are shown as white and gray spheres, respectively. The dotted red line indicates the approximate location of the unstructured “bait region” within the Pro domain.
Abbreviations: S, secretion signal; Pro, propeptide; Cat, catalytic; H, hinge region; Hpx, hemopexin; F, furin-recognition sequence; L, linker; G, glycosylphosphatidylinositol anchor; TM, transmembrane; F2, fibronectin type II; CR, cysteine-rich; Cy, cytoplasmic; Zn, zinc.
Abbreviations: S, secretion signal; Pro, propeptide; Cat, catalytic; H, hinge region; Hpx, hemopexin; F, furin-recognition sequence; L, linker; G, glycosylphosphatidylinositol anchor; TM, transmembrane; F2, fibronectin type II; CR, cysteine-rich; Cy, cytoplasmic; Zn, zinc.
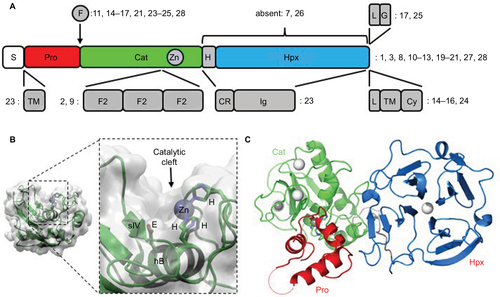
Figure 2 Kaplan–Meier curves of overall-survival probability across all glioma-tumor types in French data set separated based on MMP gene expression.
Notes: The Kaplan Scan function of R2 was used to display Kaplan–Meier information with the cutoff modus set at “scan”. This function finds the best-possible curve based on log-rank test to find the most significant expression cutoff for survival.
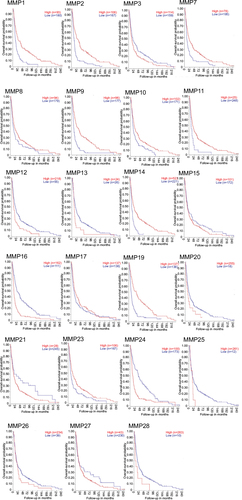
Figure 3 Gene-expression analysis of MMPs of 276 glioma samples of all histologies, with eight control samples.
Notes: Data set (tumor glioma – French – 284 – MAS5.0 – u133p2) retrieved from R2 Genomics Analysis and Visualization Platform (http://r2.amc.nl). (A). Data reported as mean ± SEM. P values: #<0.0001; ***0.0006; **0.0039. Two-way ANOVA was performed using GraphPad Prism. (B) Kaplan–Meier curves of overall-survival probability of 156 GBM patients in French data set. MMPs significantly overexpressed in GBM patients compared to control, and patients had worse overall-survival probability. (C) MMP24 was significantly underexpressed in GBM patients, and patients with lower expression had worse overall-survival probability.
Abbreviations: SEM, standard error of the mean; ANOVA, analysis of variance; GBM, glioblastoma multiforme.
Abbreviations: SEM, standard error of the mean; ANOVA, analysis of variance; GBM, glioblastoma multiforme.
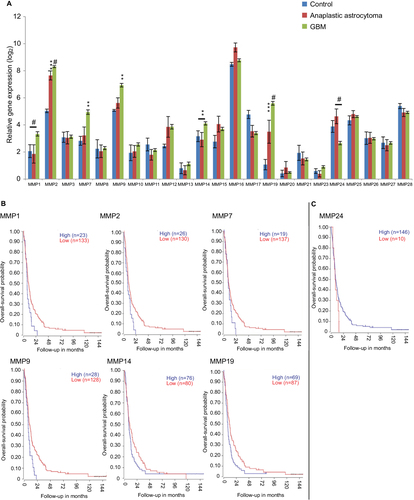
Figure 4 Quantitative reverse-transcription PCR.
Notes: PCR revealed significantly increased mRNA expression of MMPs 1, 2, 7, 9, 10, 11, 12, 14, 19, and 21 in GBM tumors relative to control tissue (ie, nonpathological tissue obtained during surgical resection in epilepsy patients). *P<0.05; **P<0.01; #P<0.001. mRNA-expression levels in control tissue (ie, nonpathological tissue obtained during surgical resection in epilepsy patients), grade III anaplastic astrocytoma, and GBM were assessed using custom-designed TaqMan low-density arrays containing primer and probe sets for 384 proteases, as previously described.Citation195,Citation196
Abbreviations: PCR, polymerase chain reaction; GBM, glioblastoma multiforme.
Abbreviations: PCR, polymerase chain reaction; GBM, glioblastoma multiforme.
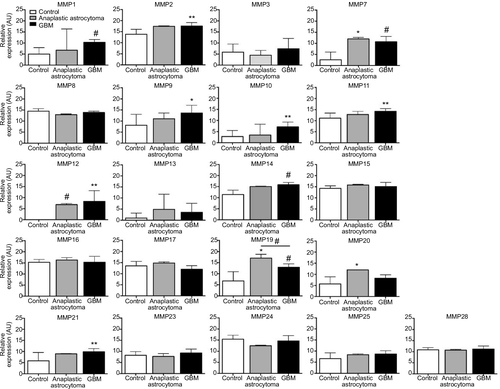
Table 1 Conserved and poorly conserved sites at the 3′-end of matrix metalloproteinases, for miRNA binding predicted by TargetScan