Figures & data
Figure 1 Identification of MMP-1-positive cells in early stage of nonalcoholic steatohepatitis (NASH) livers. (A) Hematoxylin and eosin (H&E) staining (a and c) and Azan-Mallory staining (b and d) of liver tissues from representative early-stage NASH patients are shown. Scale bar, 100 μm. (B) Immunohistochemical staining showing matrix metalloproteinase (MMP)-1-expressing cells (arrowheads). Scale bars, 63 μm in the left panel and 15 μm in the magnified right panel. (C) Immunoelectron microscopy (IEM) showing MMP-1-positive gold grains (arrowheads) on the surface of monocytes (MC). Scale bar, 63 μm. (D) Confocal laser-scanning microscopy showing co-expression of MMP-1 and the indicated cell markers. Scale bars, 100 μm in a to c, and 50 μm in d to h.
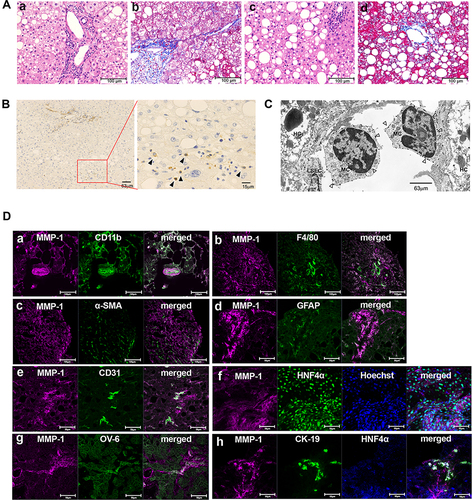
Figure 2 Identification of MMP-1-positive cells in advanced stage of NASH livers. (A) H&E staining (a and c) and Azan-Mallory staining (b and d) of liver tissues from representative advanced-stage NASH patients. Scale bar, 100 μm. (B) Confocal laser-scanning microscopy showing co-expression of MMP-1 and the indicated cell markers. Scale bars, 100 μm in a, and 50 μm in b to d.
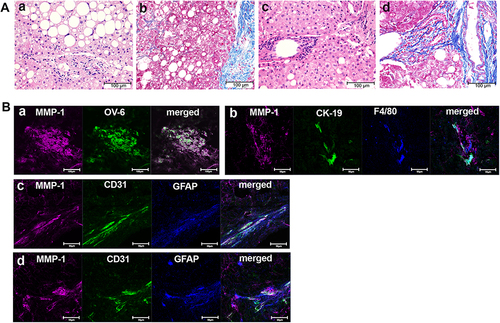
Table 1 Each Population in Peripheral Blood Mononuclear Cells from Nonalcoholic Steatohepatitis (NASH) Patients and Non-NASH Control Subjects
Figure 3 Flow cytometric analysis of peripheral blood mononuclear cells from NASH and non-NASH patients. (A) After CD45 gating, cells were fractionated into R1, R2, R3, and R4 populations depending on their expression of CD14 and CD34. Representative images of cytometric analysis are shown using a sample from NASH patient (left) and that from non-NASH control subject (right). Note a large R3 (CD45+CD14+CD34+) population in the NASH sample. Correlation between R3 (B and C) or R4 (D and E) population and each histopathological feature were examined in early (B and D) and advanced stages (C and E) of NASH patients. A significant correlation between R3 population and ductular reaction is observed in advanced-stage NASH samples (r = 0.6336, P = 0.0179).
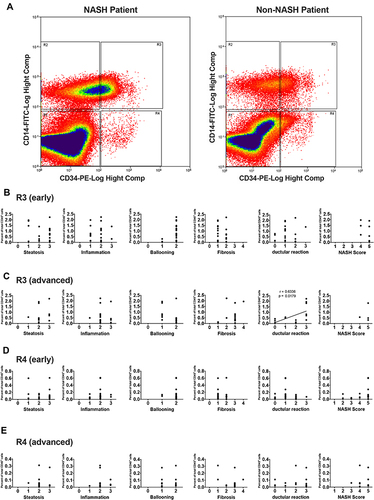
Table 2 Flow Cytometric Analysis of MMP-1 Expression in CD45+CD14+CD34+ Monocytic Progenitor Cells in NASH and Non-NASH Patients
Table 3 Relative MMP1 mRNA Expression Levels in Peripheral Blood Mononuclear Cell Fractions from NASH and Non-NASH Patients
Figure 4 Induction of MMP-1 expression in peripheral blood monocytic lineage cells after co-culture with steatosis hepatocytes. (A) Protein blot analysis showing no detectable MMP-1 in plasma exosomes from 8 patients with NASH (N). HLE cell lysates were used as a positive control for MMP-1 expression. The arrow indicates non-specific broad bands with different sizes from that observed with HLE cell lysates (arrowhead). (B) After 7-day co-culture with steatotic hepatocytes, peripheral blood monocytic progenitor cells (R3) obtained from an advanced-stage NASH patient were subjected to double immunofluorescent staining using anti-CD11b and anti-MMP-1 antibodies. Scale bar, 100 μm.
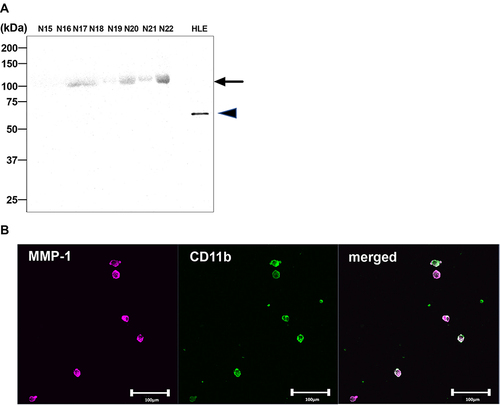
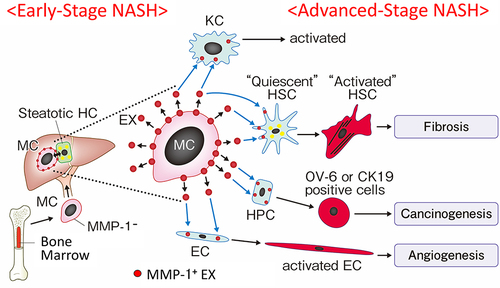
Figure 5 Schematic presentation of a hypothesis that sequential MMP-1 expression in a variety of cell populations in the liver modulates progression of NASH. CD34+ monocytic progenitor cells acquire an MMP-1-positive phenotype through interaction with steatotic hepatocytes after infiltrating early-stage NASH liver. MMP-1-containing exosomes secreted from monocytic lineage cells are then transduced to the neighboring other types of cells, which in turn modulates a number of pathophysiologic aspects of NASH.