
Figures & data
Table 1 Formulation and Characterization of BE Formulations
Table 2 Formulation of FVT BE-Loaded Gel from the Optimized Formula (F9)
Figure 1 Particle size and zeta potential of optimal TVF loaded BE (F9).
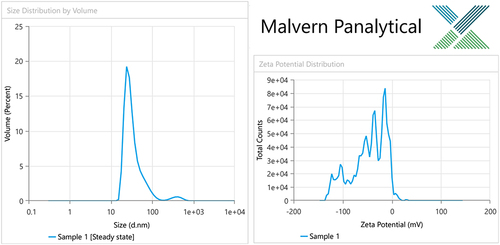
Table 3 Characterization of FVT Loaded BE
Figure 2 Entrapment efficiency (%) of various BE formulas [a column with different letters (a, b, c, d, e, and f) indicates significant differences (≤0.05)].
![Figure 2 Entrapment efficiency (%) of various BE formulas [a column with different letters (a, b, c, d, e, and f) indicates significant differences (≤0.05)].](/cms/asset/a5aaac94-6f08-41a0-ad6f-d94bf4f2ad08/dnsa_a_12300291_f0002_c.jpg)
Figure 3 Particle size (nm) of various BE formulas [a column with different letters (a, b, c, d, e, f, g, h, i, and j) indicates significant differences (≤0.05)].
![Figure 3 Particle size (nm) of various BE formulas [a column with different letters (a, b, c, d, e, f, g, h, i, and j) indicates significant differences (≤0.05)].](/cms/asset/c661c43b-719f-4e86-ba5c-06dbe2f7b232/dnsa_a_12300291_f0003_c.jpg)
Figure 4 Polydispersity index of various BE formulas [a column with different letters (a, and b) indicates significant differences (≤0.05)].
![Figure 4 Polydispersity index of various BE formulas [a column with different letters (a, and b) indicates significant differences (≤0.05)].](/cms/asset/55e04b2e-718d-4115-bcd9-bd4c4d702605/dnsa_a_12300291_f0004_c.jpg)
Figure 5 Zeta potential of various BE formulas [a column with different letters (a, b, c, and d) indicates significant differences (≤0.05)].
![Figure 5 Zeta potential of various BE formulas [a column with different letters (a, b, c, and d) indicates significant differences (≤0.05)].](/cms/asset/4af8e51e-2bd5-48bb-a019-13bc1759b650/dnsa_a_12300291_f0005_c.jpg)
Table 4 Physical Evaluation of FVT BE Gel Formulations
Figure 6 DSC Thermograms of 1) Pure Drug (FVT) [1-DSC], 2) Lipid (PL90H) [2-DSC], 3) Poloxamer 407 [4-DSC], 4) FVT-loaded BE (F9) [5-DSC], 5) FVT-loaded BE gel (G2) [8-DSC].
![Figure 6 DSC Thermograms of 1) Pure Drug (FVT) [1-DSC], 2) Lipid (PL90H) [2-DSC], 3) Poloxamer 407 [4-DSC], 4) FVT-loaded BE (F9) [5-DSC], 5) FVT-loaded BE gel (G2) [8-DSC].](/cms/asset/1e0bc29e-8e5f-4341-baf0-61eb28bdd03f/dnsa_a_12300291_f0006_c.jpg)
Figure 7 FTIR spectral studies of 1) Pure Drug (black line; line-11), 2) phospholipon 90H (red line; line-21), 3) Ethanol (white, blue; line-31), 4) propylene glycol (light green; line-41), 5) Poloxamer 407 (white gray; line-51), 6) F9 (dark red; line-61), 7) Carbopol 934 (dark green; line-71), 8) G2 (dark blue; line 81).
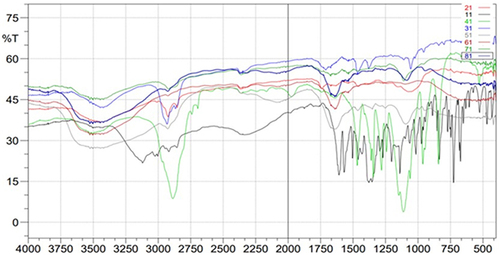
Figure 8 SEM images of optimized FVT-loaded BE F9 (A and B), optimized FVT-loaded BE gel G2 (C and D).
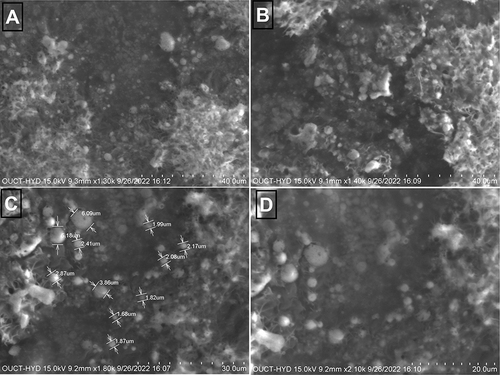
Figure 9 In vitro drug diffusion profiles of FVT solution, G2, and F9 formulation.
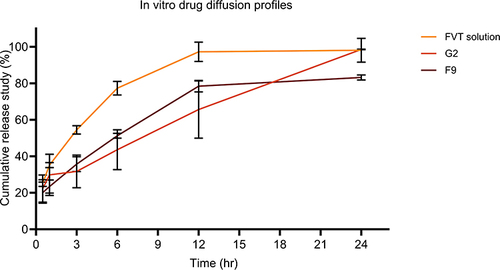
Figure 10 Ex vivo permeation study at nasal pH 6.4.
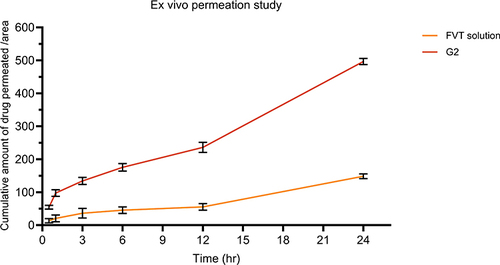
Figure 11 Light photomicrograph of (A) untreated rat epithelium and rat epithelium treated with (B) normal saline pH 6.8, (C) Drug solution, (D) F9 and (E) G2. “m”, mucosa; “c”, underlying cartilage; “o”, lamina propria of the mucosal layer; “v”, blood vessels in lamina propria.
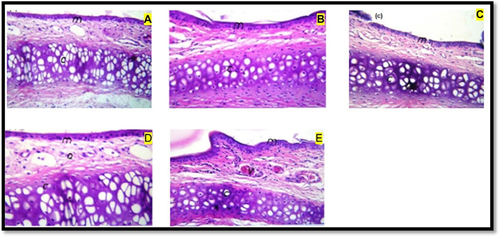
Table 5 Pharmacokinetic Parameters, Brain Targeting Efficiency, and Direct Nose-to-Brain Transport Following Administration of FVT Formulations