Figures & data
Table 1 Physicochemical Parameters of the Materials Used in the Experiments: the Average Hydrodynamic Diameter (in Nm), the Diameter of the Individual Nanomaterials (in Nm) Based on the TEM Analysis, the Zeta Potential (in mV), and the Polydispersity Index (PdI)
Figure 1 Average hydrodynamic diameter of the materials used in the experiments. (A) Ag; (B) AgF; (C) Au; (D) AuF; (E) Cu; (F) CuF; (G) ZnO; (H) ZnOF; (I) F.
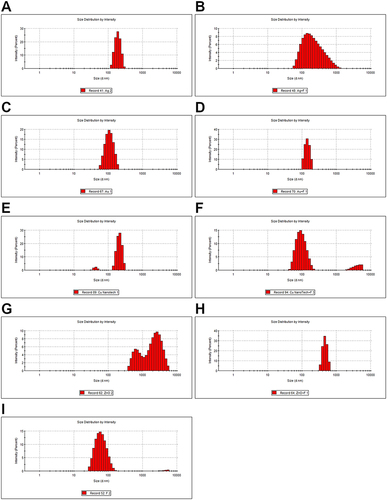
Figure 2 Zeta potential of the materials used in the experiments. (A) Ag; (B) AgF; (C) Au; (D) AuF; (E) Cu; (F) CuF; (G) ZnO; (H) ZnOF; (I) F.
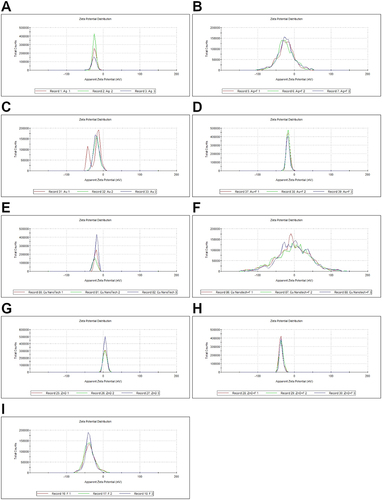
Figure 3 TEM visualization of the materials used in the experiments. (A) Ag; (B) AgF; (C) Au; (D) AuF; (E) Cu; (F) CuF; (G) ZnO; (H) ZnOF; (I) F.
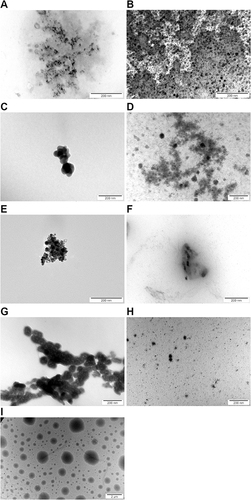
Figure 4 Viability (in %) of the microorganisms exposed to farnesol (F), silver nanoparticles (Ag), gold nanoparticles (Au), copper nanoparticles (Cu), zinc oxide nanoparticles (ZnO), and complexes of nanoparticles with farnesol (farnesol 1% and nanoparticles 10 µg/mL). The results are presented as mean ± standard deviation, the C column is the control group (untreated), and asterisks (*) show statistically significant differences (p ≤ 0.05) compared with the control.
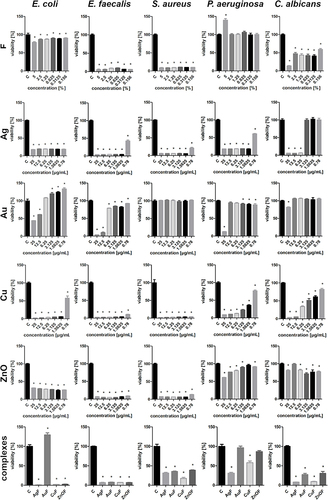
Figure 5 Confocal scanning laser microscopy images of biofilm formation by E. coli, E. faecalis, S. aureus, P. aeruginosa, C. albicans after treatment with farnesol (F) and farnesol complexes (AgF, AuF, CuF, ZnOF). C is control group.
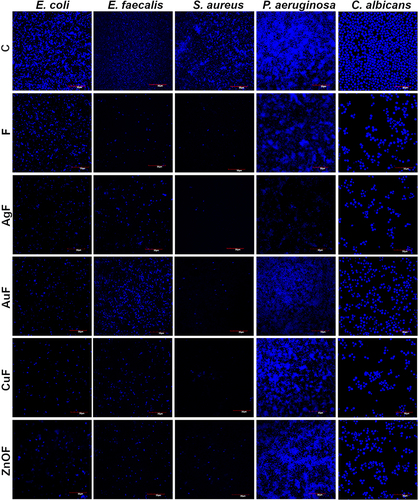
Figure 6 Biofilm structure of E. coli, E. faecalis, S. aureus, P. aeruginosa, C. albicans treated with nanocomplexes (AgF, AuF, CuF, ZnOF) in the presence of the control (untreated) group (C). All images were captured at a magnification of 10,000×.
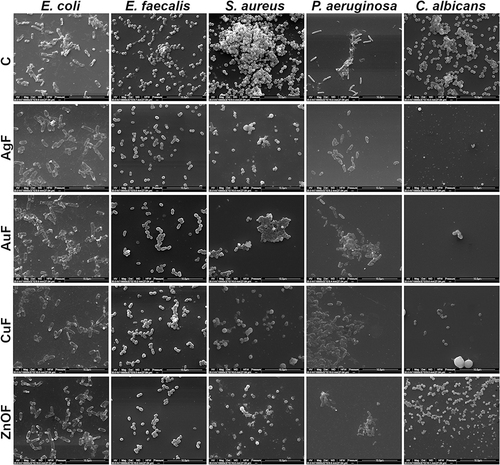
Figure 7 HFFF2 viability (in %) after treatment with nanoparticles and farnesol (A) (at final concentrations of 1 µg/mL for nanoparticles and 0.1% for farnesol) and after treatment with nanocomplexes (B). The results are presented as mean ± standard deviation. The C column is the control (untreated) group. Asterisks (*) show statistically significant differences (p ≤ 0.05) compared with the control.
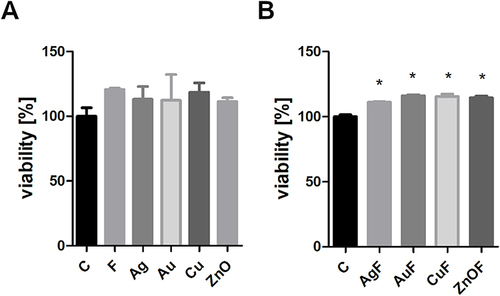
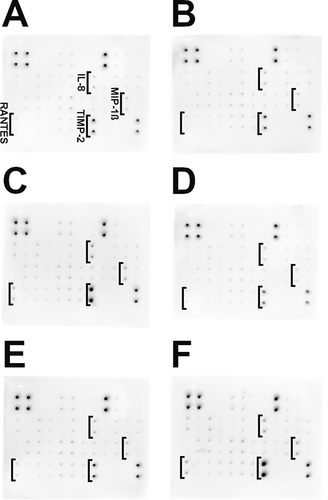
Figure 8 Protein expression in the HFFF2 cell line using a Human Inflammation Antibody Array Membrane (original drafts). (A) control (untreated); (B) F; (C) AgF; (D) AuF; (E) CuF; (F) ZnOF. The results are normalized and compared with the control groups.