Figures & data
Table 1 Clinical Characteristics and Phase Difference in Mild, Moderate, Severe, Very Severe RLS Patients and Controls
Table 2 Polysomnography Parameters in Mild, Moderate, Severe, Very Severe RLS Patients and Controls
Figure 1 The autoregulatory parameter and statistical distributions in each group. Statistical distributions of average phase difference (A) and its transfer function (B) in each group. Similar lowercase letters indicate no significant difference, while different lowercase letters indicate significant difference (P < 0.001) (One-way analysis of variance and Bonferroni’s post-hoc test). The dashed frame represents a specific frequency domain (0.06–0.12Hz).
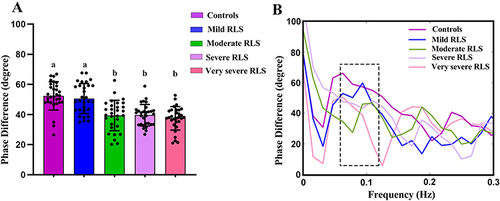
Table 3 The IRLS, Phase Difference and Polysomnography Parameters in RLS Patients with Ferritin <45 µg/L and Ferritin ≥45 µg/L
Figure 2 Relations between phase difference and IRSL (A), arousal index (B), and PMLI (C) in patients with RLS (Spearman correlation test).
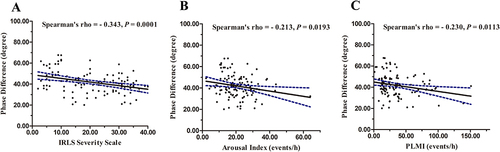
Table 4 Univariable and Multivariable Analysis for the Phase Difference
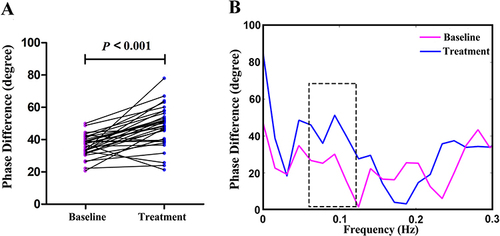
Figure 3 The autoregulatory parameter and statistical distributions in RLS patients before and after treatment. Statistical distributions of phase difference (A) and its transfer function (B) in RLS patients before and after treatment (Wilcoxon signed-rank test).