
Figures & data
Figure 1 Multistate models with single (A), independent (B), and cross-related (C, D) outcomes.
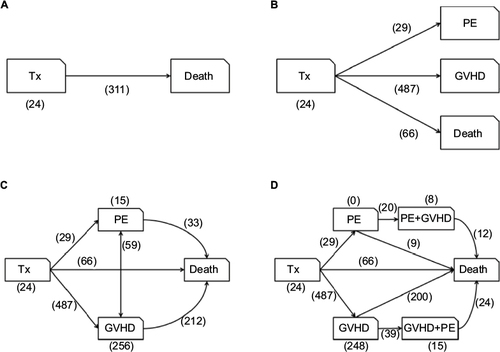
Table 1 Hazard ratios with standard errors, confidence intervals, and p-values for the Markov proportional regression model of the significant covariates at a 5% significance level
Figure 2 Nonparametric estimates of the stacked transition probabilities at time 0 year (A), 0.5 year (B), 1 year (C), and 1.5 years (D) after the transplantation.
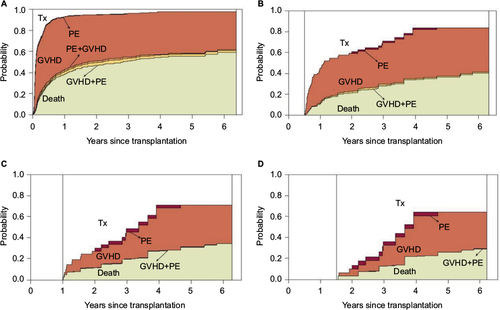
Figure 3 Nonparametric estimates of the stacked transition probabilities at time 0 year (A), 0.5 year (B), 1 year (C), and 1.5 years (D) after the transplantation. Starting state is PE.
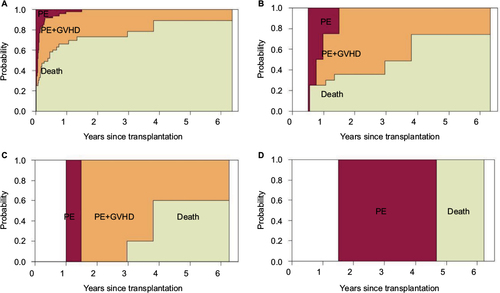
Figure 4 Nonparametric estimates of the stacked transition probabilities at time 0 year (A), 0.5 year (B), 1 year (C), and 1.5 years (D) after the transplantation. Starting state is GVHD.
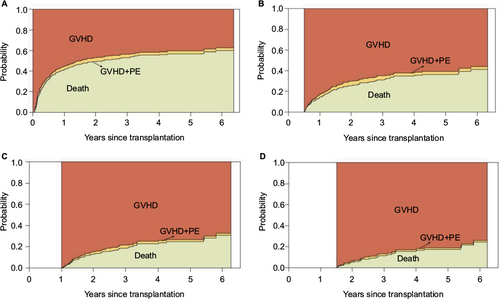
Figure 5 The probabilities of being in different states for HLA 8/8 allele match patient (A) and intermediate disease risk index patient (B).
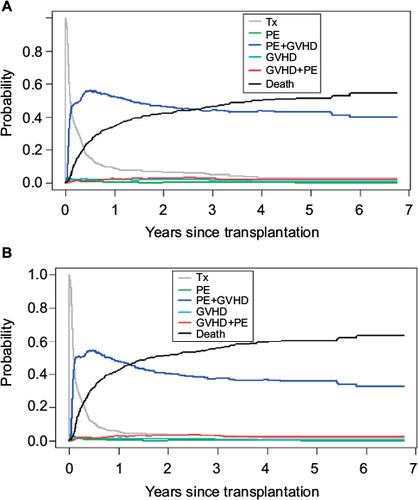
Figure 6 Comparison of the cumulative death hazard transition for each state.
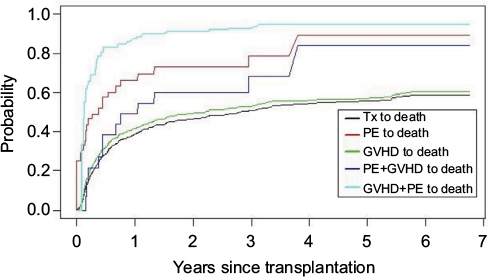
Table S1 Predicted transition probabilities at time (a) 0 year, (b) 0.5 year, (c) 1 year, and (d) 1.5 years after the transplantation
Table S2 Predicted transition probabilities at time (a) 0 year, (b) 0.5 years, (c) 1 year, and (d) 1.5 years after the transplantation (starting state is PE)
Table S3 Predicted transition probabilities at time (a) 0 year, (b) 0.5 year, (c) 1 year, and (d) 1.5 years after the transplantation (starting state is GVHD)