
Figures & data
Table 1 Summary table for time-to-good control of hypertension
Table 2 Cross-tabulation of sex, age, and systolic blood pressure of hypertensive patients with status and time
Figure 1 Kaplan–Meier estimates for hypertension data set by sex, age, SBP, FBS, BUN, and creatinine.
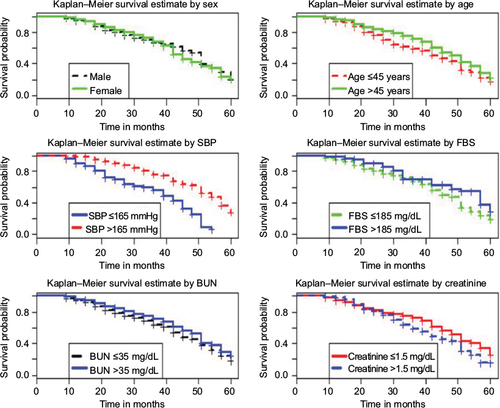
Table 3 Univariable and multivariable analyses of Cox proportional hazard
Table 4 Model selection for hypertension data set
Table 5 Multiple covariate analysis for the best model of Cox proportional hazard
Figure 2 Cox–Snell residual plot of the best-fitted model for hypertension data set.
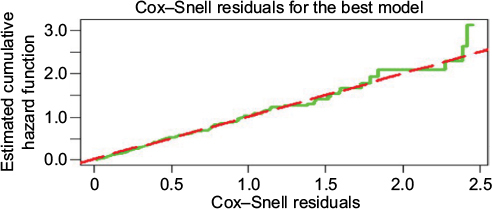
Figure 3 Martingale residuals plot of the best-fitted model for hypertension data set.
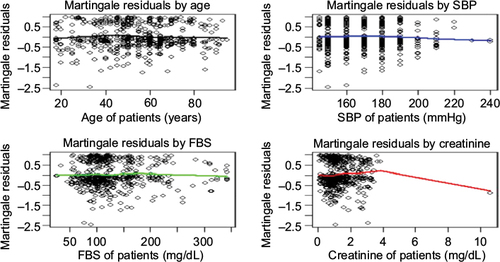
Figure 4 Schoenfeld residuals plot of the best-fitted model for hypertension data set.
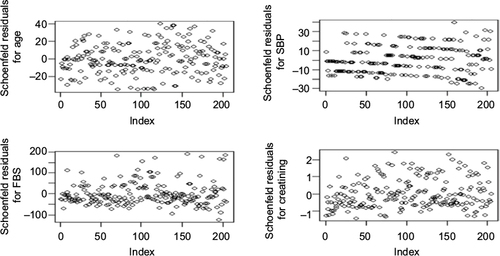
Figure 5 Deviance residuals plot of the best-fitted model for hypertension data set.
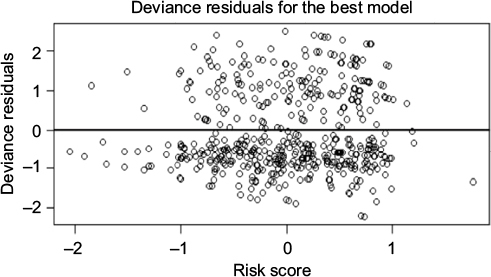
Table 6 Statistical test for proportional hazard assumption of the covariates and their interaction with log of time and Schoenfeld residual
Figure 6 Plots of scaled Schoenfeld residuals for each covariate in a best model.
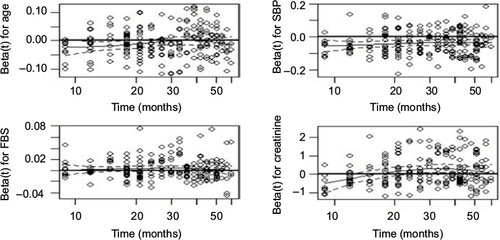
Figure 7 Plots of log [−log S(t)] versus time for each covariate in a best model.
![Figure 7 Plots of log [−log S(t)] versus time for each covariate in a best model.](/cms/asset/2c096247-9d2e-487e-bdf8-d21a494be97a/doam_a_12191755_f0007_c.jpg)
Table 7 Univariable and multivariable analyses of univariate frailty
Table 8 Parameter estimates (SE) in the univariate gamma frailty model applied to hypertension data set