
Figures & data
Table 1 Example categorization of patients following AdoMet treatment
Table 2 Patient demographics and baseline characteristics
Table 3 Clinical indicators in the stepwise multinomial logistic regression selection model
Figure 1 (A) AdoMet treatment prescription versus total bilirubin; (B) AdoMet treatment prescription versus number of symptoms; and (C) AdoMet treatment prescription versus Child–Pugh classification.
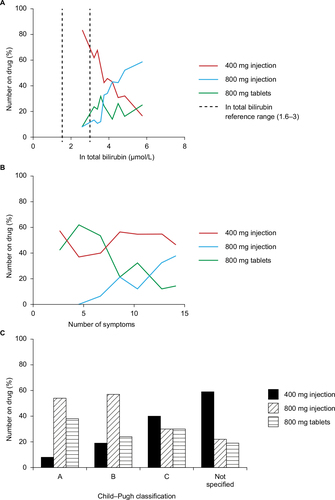
Figure 2 Distribution of patients (N) across categories (I–VII) following the calculated allocation model based on statistical significance and grid-optimization.
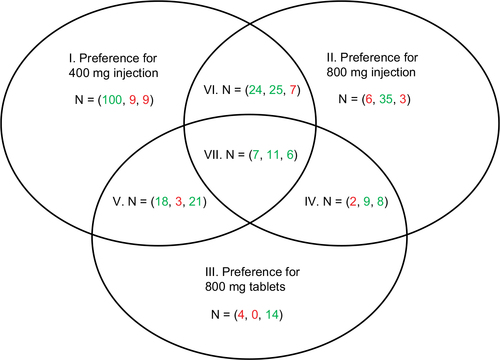
Table 4 Treatment response per AdoMet medication for the predicted categories produced by the MLR grid-optimization model
Table 5 Pairwise comparisons of response to AdoMet treatment