Figures & data
Figure 1 Structures and experimental HDAC8 inhibitory activity (pIC50), Pred A (pIC50), and fitness of the known inhibitors (1–32).
Abbreviations: HDAC, histone deacetylase; pIC50, negative logarithm of half maximal inhibitory concentration; Fitness, fitness score; Exp A, experimental activity; Pred A, predicted activity.
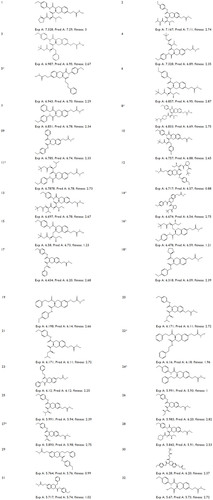
Figure 2 Distribution of activities (pIC50) for the training and test set compounds.
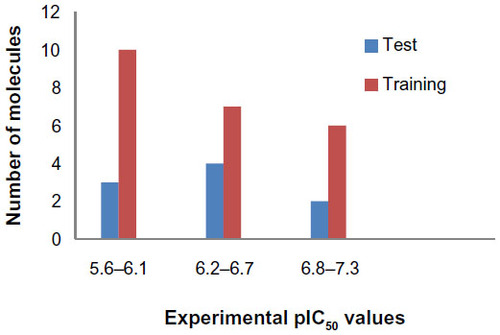
Table 1 Pharmacophore hypothesis with scoring values
Figure 3 PHASE-generated pharmacophore model of the most active ligand.
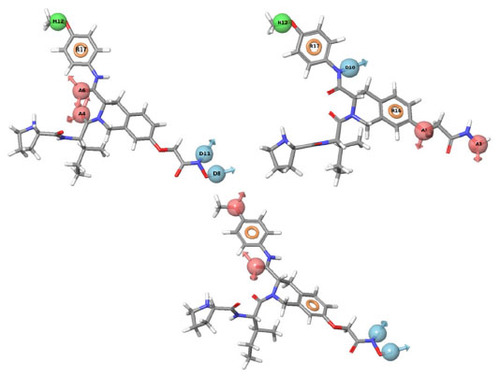
Table 2 Statistical parameters for the best three pharmacophore hypotheses
Table 3 Structure overlap between coligand and docked orientation and their RMSD values
Figure 4 Workflow for the virtual screening protocol.
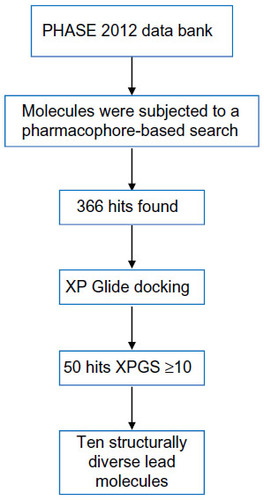
Table 4 ADME properties of identified hits with recommended range
Figure 5 Fitness graph between the observed and PHASE predicted activity for the training and test set compounds.
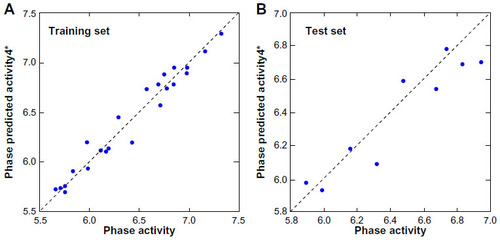
Figure 6 Hydrogen bond donor visualization of a three-dimensional QSAR model on the highest active compound (1) and the least active compound (32).
Abbreviation: QSAR, quantitative structure–activity relationship.
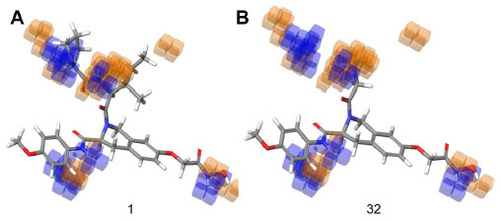
Figure 7 Hydrophobic interaction visualization of a three-dimensional QSAR model on compound 1 and compound 32.
Abbreviation: QSAR, quantitative structure–activity relationship.
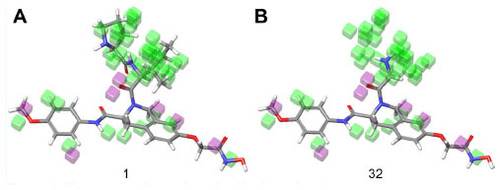
Figure 8 Electron withdrawing visual representation of a three-dimensional QSAR model of compound 1 and compound 32.
Abbreviation: QSAR, quantitative structure–activity relationship.
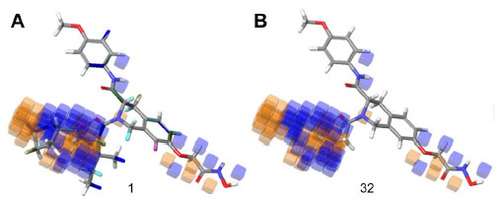
Figure 9 Important features based on three-dimensional QSAR visualization on compound 1.
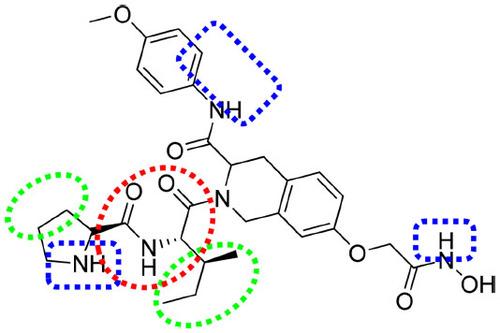
Table 5 Summary of the number of HPB, HBD, HBA, and interactions with Zn
Figure S1 Mapping of ten identified hits with pharmacophore matching and fitness score with compound ID.
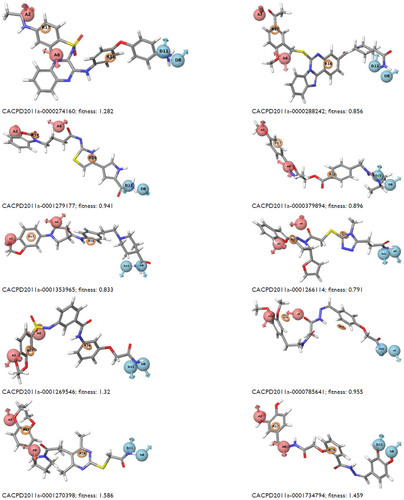
Figure S2 Experimental activity (pIC50), XPGS, type of interaction (HBD and HBA), and Zn (interaction distance) of known inhibitors.
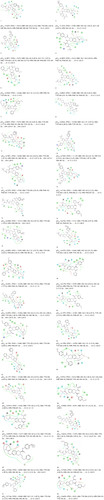
Figure S3 Predicted activity (pIC50), XPGS, type of interaction (HBD and HBA), and Zn (interaction distance) of ten potent hits.
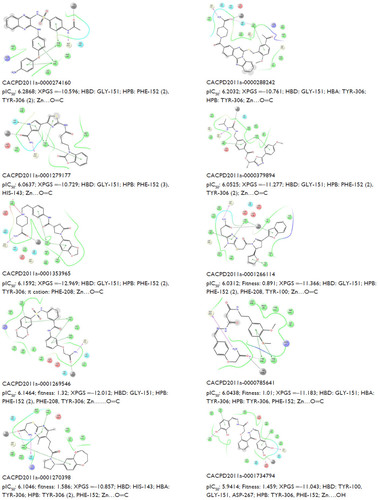
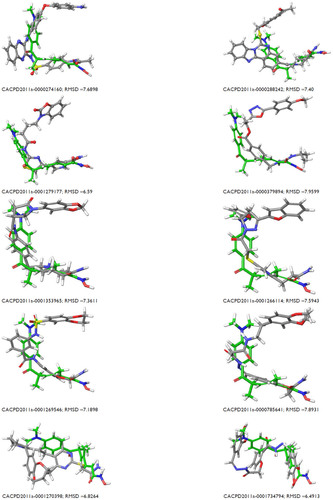
Figure S4 Superposition of reported hits on the coligand of the X-ray ligand–enzyme complex of 1T64 and RMSD values.
Abbreviation: RMSD, root-mean-square deviation.