
Figures & data
Table 1 Clinical manifestation and complications of hyperparathyroidism
Figure 1 Results of Tc-99m sestamibi study acquired at 15 and 90 minutes postinjection using pinhole collimator.Citation64
Notes: The delayed image shows differential clearance of activity from the thyroid gland, with retained and intense uptake by a large parathyroid adenoma (arrow). Springer, Pathophysiologic Basis of Nuclear Medicine. 3rd ed, Parathyroid gland, 2014, Elgazzar A, editor. © 2014 with permission of Springer Science+Business Media.Citation64
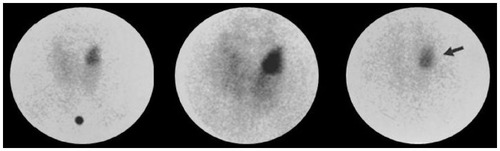
Figure 2 Tc-99m sestamibi study results.
Notes: Tc-99m sestamibi study (A–C) acquired at 15 and 120 minutes postinjection using parallel hole collimator. In addition, Tc-99m pertechnetate study (D) was also obtained using parallel hole collimator. The early image (A) show a focus of increased uptake inferior to the left lower pole that persists on the delayed image (B) after the clearance of the thyroid activity. There is also increased uptake at the right upper pole on the early image (A) which washes out on the delayed image (B). The pertechnetate study (D) shows a corresponding focus of increased uptake at the right upper pole suggesting a thyroid nodule.
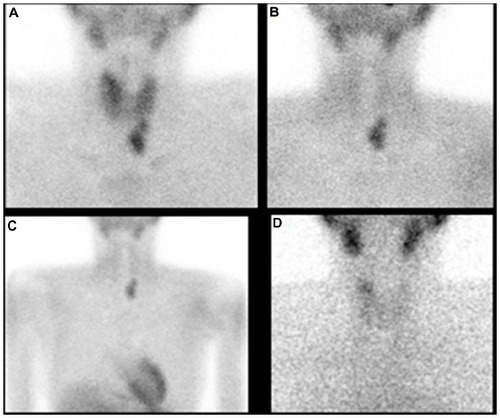
Figure 3 Tc-99m sestamibi study acquired at 15 and 120 minutes postinjection using parallel hole collimator.
Notes: Planar images (A) reveal a focus of increased uptake at the right lower pole seen on the early image and persisting on the delayed image (arrow) which showed further clearance of thyroid background activity. SPECT/CT study (B) was also obtained, showing the lesion with better contrast and anatomic localization (arrow).
Abbreviations: CT, computed tomography; SPECT, single-photon emission computed tomography.
Abbreviations: CT, computed tomography; SPECT, single-photon emission computed tomography.
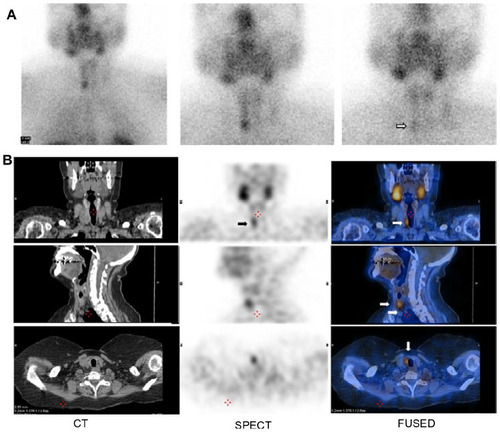
Table 2 Causes of false positive and false negative results of Tc-99m sestamibi scan