Figures & data
Figure 1 Usutu virus phylogram trees.
Notes: (A) Representative phylogram showing the genetic relatedness between different flaviviruses. Accession numbers are displayed in the tree. The scale indicates 0.8 nucleotide substitutions/site. (B) Representative phylogram showing the genetic relatedness between geographically and temporally different Usutu virus strains. Accession numbers, country, and collection date are displayed in the tree. The scale indicates 0.2 nucleotide substitutions/site. The trees were based on complete genome sequence, built from a multiple alignment using Clustal omega and Phylogeny.fr.
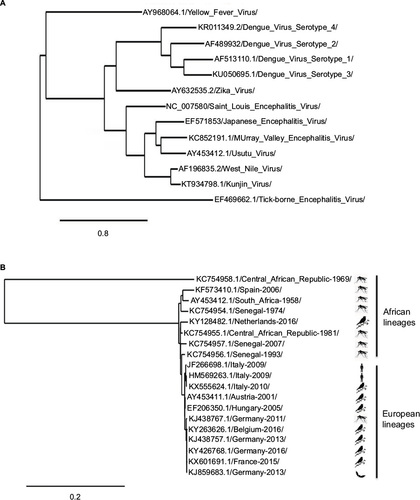
Figure 2 Schematic view of the genomic organization of USUV.
Notes: The single ORF (boxes) that encodes both structural (C-prM/M and E) and NS proteins (NS1, NS2A, NS2B, NS3, NS4A, NS4B, and NS5) is flanked by two UTRs.
Abbreviations: C, capsid; E, envelope; ORF, open reading frame; prM/M, pre-membrane/membrane; USUV, Usutu virus; UTRs, untranslated regions.
Abbreviations: C, capsid; E, envelope; ORF, open reading frame; prM/M, pre-membrane/membrane; USUV, Usutu virus; UTRs, untranslated regions.
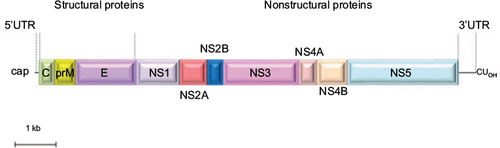
Figure 3 Transmission electron microscopy of USUV RSPs and virions.
Notes: (A) Negative stained TEM image of purified Usutu RSPs. (B) Negative stained TEM image of Vero cells infected with USUV showing VP and electron-dense Vi.
Abbreviations: RSPs, recombinant subviral particles; TEM, transmission electron microscopy; USUV, Usutu virus; VP, vesicle packets; Vi, virions.
Abbreviations: RSPs, recombinant subviral particles; TEM, transmission electron microscopy; USUV, Usutu virus; VP, vesicle packets; Vi, virions.
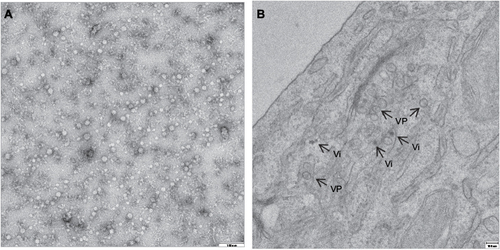
Figure 4 Confocal image of Vero cell transfected with the autophagosome marker GFP-LC3 plasmid and infected with USUV (red).
Note: Green LC3 aggregates indicate the induction of autophagy in the cell.
Abbreviation: USUV, Usutu virus.
Abbreviation: USUV, Usutu virus.
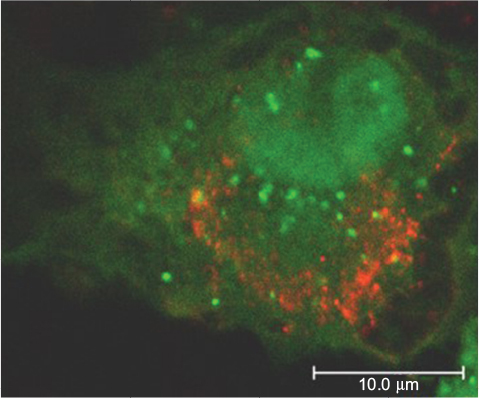
Table 1 Circulation of USUV among avian species in Europe
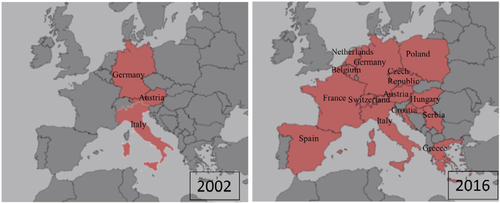
Figure 5 Map showing the spread of Usutu across Europe from 2002 to 2016.