Figures & data
Figure 1. EZH2 inhibition restores enzalutamide sensitivity in castration-resistant prostate cancer cells.
(A & B) Human (LNCaP, PC3, 22Rv1) and murine (T1525, T23, ST4787) prostate cancer cell lines were assessed for AR and EZH2 expression through western blot analysis. β-actin was used as housekeeping. (C) Murine cells were cultured with different doses of enzalutamide (0, 5, 12.5, and 25 μM) for 96 h and tested for proliferation by XTT assay. (D & E) Human and murine cells were cultured with different doses of GSK-126 (0, 1, 2.5, and 5 μM) for 96 h and tested for proliferation by XTT assay. (F) Human and murine cells were either left untreated or treated with GSK-126 (5 μM). After 96 h, H3K27me3 levels were tested by western blot. Vinculin was used as housekeeping. The western blot was repeated twice (G). Quantification of F. (H & I) Human and murine cells were cultured in the presence of enzalutamide (10 μM), GSK-126 (5 μM), or their combination (Combo) as indicated, for 96 h and tested for proliferation through trypan blue cell counting. Histograms report mean ± SD of biological replicates (represented by dots), pooled from two independent experiments. One-way Anova followed by Tukey's multiple comparison test is used, **p < 0.01; ***p < 0.001, and ****p < 0.0001. Where p-value is not indicated, the comparison between groups is not statistically significant.
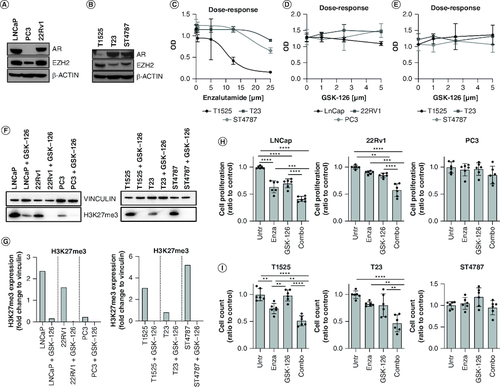
Figure 2. Antitumor effect of concomitant AR and EZH2 inhibition restrain castration-resistant prostate cancer and neuroendocrine prostate cancer in vivo and the effect is immune-dependent.
(A & B) Tumor growth in C57BL/6 mice injected subcutaneously with T23 (A) or ST4787 (B) cells and treated with enzalutamide, GSK-126, or their combination (Combo). N = 8 mice for each group, pool of two independent experiments. Left graphs represent mean tumor volume; right histograms report mean tumor volume ± SD at the day of sacrifice, each dot is a mouse. Two-way Anova followed by Tukey's multiple comparison test: *p < 0.05. (C) SYP expression (red) was assessed in excised subcutaneous tumors of (A) by immunofluorescence. Blue staining is DAPI. Experiment was repeated two-times. SYP signal intensity was evaluated with ImageJ software. Histogram report mean ± SD, each dot is a mouse. One-way Anova followed by Tukey's multiple comparison test: ***p < 0.001. (D) TRAMP mice were surgically castrated at 20 weeks of age, and after 3 weeks either left untreated (n = 11) or treated with enzalutamide (n = 13), GSK-126 (n = 13), or their combination (Combo; [n = 11]) and sacrificed at 35 weeks of age. Histograms report the frequency of tumor lesions scored as neuroendocrine prostate cancer (NEPC), castration-resistant prostate cancer (CRPC) or regression (REG); numbers written in the bars indicate the relative percentages of each type of lesion. Murine prostate lesions were scored according to histopathological and immunophenotypical analyses (Supplementary Figure 1C & D) as follows: i) CRPC: lesions of high-grade prostatic intraepithelial neoplasia or adenocarcinoma characterized by CK8 positive atypical cells forming distorted/ill-defined glands within the stroma. ii) NEPC: composed of sheets and nests of medium-sized to large cells with high nuclear to cytoplasmic ratio and/or anaplastic morphology. Cells were immunoreactive for SYP and either negative (in case of pure small-cell NEPC) or positive for CK8 (in case of tumors with mixed adenocarcinoma and NEPC features, ref. [Citation43]). When NEPC areas and CRPC or REG lesions were present in different lobes, the tumor was classified as NEPC. iii) Regression (REG): prostates with variable degree of glandular distortion characterized by dilated lumina with flattened or focally hyperplastic epithelia in the absence of overt nuclear atypia. Fisher test: *p < 0.05; **p < 0.01; ***p < 0.001, and ****p < 0.0001. (E) Tumor growth in immunodeficient NSG mice injected subcutaneously with T23 cells and treated with enzalutamide, GSK-126, or their combination (Combo). N = 8 mice for each group, pool of two independent experiments. Left graphs represent mean tumor volume; right histograms report mean tumor volume ± SD at the day of sacrifice, each dot is a mouse. Two-way Anova followed by Tukey's multiple comparison test was performed. In all graphs, where p-value is not indicated, the comparison between groups is not statistically significant.
![Figure 2. Antitumor effect of concomitant AR and EZH2 inhibition restrain castration-resistant prostate cancer and neuroendocrine prostate cancer in vivo and the effect is immune-dependent.(A & B) Tumor growth in C57BL/6 mice injected subcutaneously with T23 (A) or ST4787 (B) cells and treated with enzalutamide, GSK-126, or their combination (Combo). N = 8 mice for each group, pool of two independent experiments. Left graphs represent mean tumor volume; right histograms report mean tumor volume ± SD at the day of sacrifice, each dot is a mouse. Two-way Anova followed by Tukey's multiple comparison test: *p < 0.05. (C) SYP expression (red) was assessed in excised subcutaneous tumors of (A) by immunofluorescence. Blue staining is DAPI. Experiment was repeated two-times. SYP signal intensity was evaluated with ImageJ software. Histogram report mean ± SD, each dot is a mouse. One-way Anova followed by Tukey's multiple comparison test: ***p < 0.001. (D) TRAMP mice were surgically castrated at 20 weeks of age, and after 3 weeks either left untreated (n = 11) or treated with enzalutamide (n = 13), GSK-126 (n = 13), or their combination (Combo; [n = 11]) and sacrificed at 35 weeks of age. Histograms report the frequency of tumor lesions scored as neuroendocrine prostate cancer (NEPC), castration-resistant prostate cancer (CRPC) or regression (REG); numbers written in the bars indicate the relative percentages of each type of lesion. Murine prostate lesions were scored according to histopathological and immunophenotypical analyses (Supplementary Figure 1C & D) as follows: i) CRPC: lesions of high-grade prostatic intraepithelial neoplasia or adenocarcinoma characterized by CK8 positive atypical cells forming distorted/ill-defined glands within the stroma. ii) NEPC: composed of sheets and nests of medium-sized to large cells with high nuclear to cytoplasmic ratio and/or anaplastic morphology. Cells were immunoreactive for SYP and either negative (in case of pure small-cell NEPC) or positive for CK8 (in case of tumors with mixed adenocarcinoma and NEPC features, ref. [Citation43]). When NEPC areas and CRPC or REG lesions were present in different lobes, the tumor was classified as NEPC. iii) Regression (REG): prostates with variable degree of glandular distortion characterized by dilated lumina with flattened or focally hyperplastic epithelia in the absence of overt nuclear atypia. Fisher test: *p < 0.05; **p < 0.01; ***p < 0.001, and ****p < 0.0001. (E) Tumor growth in immunodeficient NSG mice injected subcutaneously with T23 cells and treated with enzalutamide, GSK-126, or their combination (Combo). N = 8 mice for each group, pool of two independent experiments. Left graphs represent mean tumor volume; right histograms report mean tumor volume ± SD at the day of sacrifice, each dot is a mouse. Two-way Anova followed by Tukey's multiple comparison test was performed. In all graphs, where p-value is not indicated, the comparison between groups is not statistically significant.](/cms/asset/a9bcc891-6bc4-4a26-9975-eed6de0aa606/iepi_a_2337510_f0002_c.jpg)
Table 1. Patients' characteristics and EZH2 staining score.
Figure 3. EZH2 is expressed in murine and human prostate cancer lesions.
(A) Pictures show immunohistochemistry for H3K27me3 in T23 and ST4787 tumors collected from the experiments reported in A, B and E. Histograms report staining intensity quantification, evaluated with ImageJ software. (B) Immunohistochemistry for AR and EZH2 on subcutaneously T23 and ST4787 lesions. Scale bars indicate magnifications. The lower panels are digital magnifications of selected areas indicated by a dotted line in the middle panels; red and black arrows indicate selected tumor and stromal cells, respectively (C). Real time PCR for Ar and Ezh2 on RNA samples collected from whole T23 and ST4787 tumors and from CD45+ cells FACS sorted from T23 tumors (n = 2). (D) Immunohistochemistry for EZH2 on human prostate cancer lesions with different Gleason Score. Scale bars indicate magnifications. Black arrows indicate stromal cells.
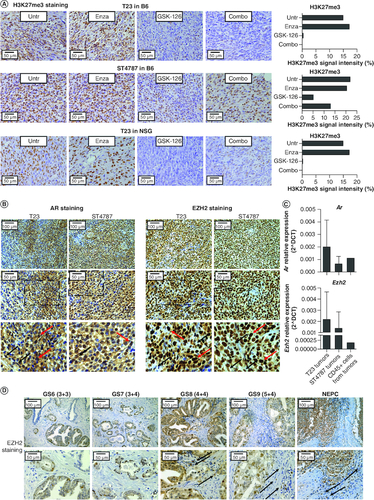
Figure 4. The COMBO treatment does not affect the frequency of immune subpopulations in subcutaneous tumors.
Analysis of immune infiltrate of subcutaneous T23 (A) and ST4787 (B) tumors by flow cytometry. Histograms report mean ± SD, each dot is a mouse. One-way Anova followed by Tukey's multiple comparison test: *p < 0.05; **p < 0.01. Where p-value is not indicated, the comparison between groups is not statistically significant.
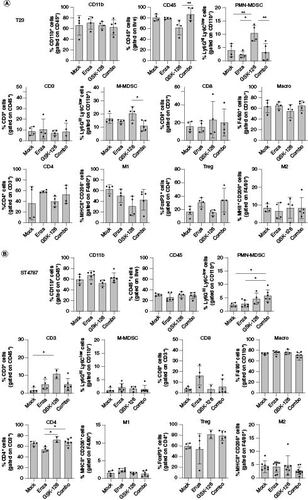
Figure 5. Concomitant inhibition of AR and EZH2 enhances cytotoxic activity and cytokine production of tumor-specific CD8+ T cells.
(A) Scheme of the in vivo cytotoxicity assay in TRAMP mice. 15-week-old TRAMP mice were treated with enzalutamide, GSK-126, or their combination (Combo). 2 weeks later treated TRAMP and control non-tumor-bearing naive C57BL/6 (B6) mice were immunized with DCs pulsed with TagIV peptide. 1 week later, in vivo cytotoxicity was tested as described in methods (B). From these mice we also evaluated frequency (C) and cytokine production (D) of prostate-infiltrating immune cells, after 4 h stimulation with PMA-ionomycin and brefeldin A. Histograms report mean ± SD, each dot is a mouse. One-way ANOVA followed by Tukey's multiple comparison test: *p < 0.05; **p < 0.01; ***p < 0.001 and ****p < 0.0001. Where p-value is not indicated, the comparison between groups is not statistically significant.
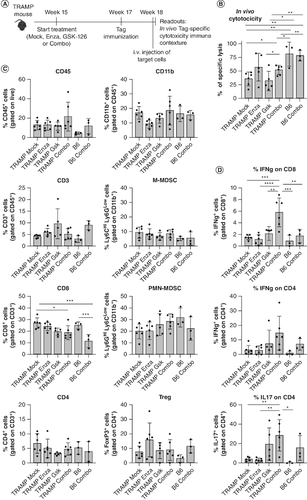
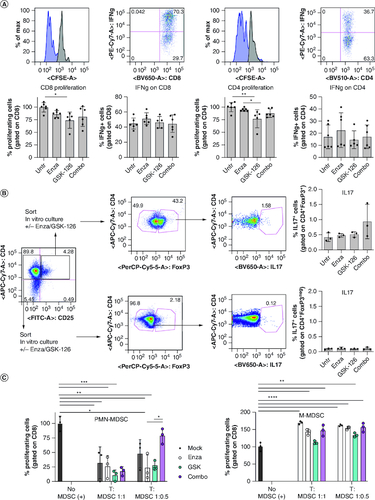
Figure 6. The COMBO treatment does not affect T cell and MDSC activity in vitro.
(A) Naive T lymphocytes purified from the spleen of C57BL/6 mice were labeled with CFSE, activated in vitro with CD3/CD28 and treated with enzalutamide, GSK-126 or the Combo. 4 days later, proliferation (CFSE dilution) and IFN-γ production were evaluated by flow cytometry. (B) Flow cytometry evaluation of IL-17 production by T regulatory (CD4+CD25+FoxP3+) or effector (CD4+CD25negFoxP3neg) T cells purified from tumor bearing mice and treated in vitro with enzalutamide, GSK-126 or combo. (C) PMN-MDSCs (CD11b+Ly6GhiLy6Cint) and M-MDSC-like cells (CD11b+Ly6GlowLy6Chi) isolated from TRAMP mice previously treated with enzalutamide, GSK-126 or the Combo were tested in vitro for suppressive activity against responder T cells. MDSC: responder ratio 1:1, 1:0.5 as indicated. All histograms report mean ± SD of biological replicates, represented by dots. One-way ANOVA followed by Tukey's multiple comparison test *p < 0.05; **p < 0.01; ***p < 0.001, and ****p < 0.0001. Where P-value is not indicated, the comparison between groups is not statistically significant.