1,136
Views
42
CrossRef citations to date
0
Altmetric
ORIGINAL RESEARCH

The Relationship between Particulate Matter (PM10) and Hospitalizations and Mortality Of Chronic Obstructive Pulmonary Disease: A Meta-Analysis

, , , , &
Pages 307-315 | Published online: 16 Jan 2013

Figures & data

Figure 1.  Study selection flow chart. The initial search found 1322 titles, of which 1210 citations were excluded after identification based on abstracts and titles, and there were 31 original studies that met the inclusion criteria for this meta-analysis.

Figure 1.  Study selection flow chart. The initial search found 1322 titles, of which 1210 citations were excluded after identification based on abstracts and titles, and there were 31 original studies that met the inclusion criteria for this meta-analysis.

Table 1.  Studies included in the meta-analysis investigating the short term effects between PM10 on COPD

Figure 2.  Forest plot of COPD hospitalizations and PM10 in the meta-analysis Random-effect models were used to calculate the pooled effect size for OR (chi-squared χ2 = 117.82, [degree of freedom, df = 19], I2 = 83.9%, p < 0.001; and Z = 6.61, p < 0.001). The random pooled effect size (OR) for COPD hospitalizations due to PM10 was 1.03 (95%CI = 1.02–1.04).

Figure 2.  Forest plot of COPD hospitalizations and PM10 in the meta-analysis Random-effect models were used to calculate the pooled effect size for OR (chi-squared χ2 = 117.82, [degree of freedom, df = 19], I2 = 83.9%, p < 0.001; and Z = 6.61, p < 0.001). The random pooled effect size (OR) for COPD hospitalizations due to PM10 was 1.03 (95%CI = 1.02–1.04).

Figure 3.  Forest plot of COPD mortality and PM10 in the meta-analysis Fixed effect models were used to calculate the pooled effect size for OR (χ2 = 23.03, df = 15, I2 = 34.9%, p > 0.05; and Z = 7.40, p < 0.001). The pooled effect size (OR) for COPD mortality and PM10 was 1.011 (95%CI = 1.008 –1.014).

Figure 3.  Forest plot of COPD mortality and PM10 in the meta-analysis Fixed effect models were used to calculate the pooled effect size for OR (χ2 = 23.03, df = 15, I2 = 34.9%, p > 0.05; and Z = 7.40, p < 0.001). The pooled effect size (OR) for COPD mortality and PM10 was 1.011 (95%CI = 1.008 –1.014).

Figure 4.  Funnel plot for PM10 and COPD hospitalizations in the meta-analysis. Publication bias was tested by using funnel plots for COPD hospitalization. The combined data obtained from Egger's test for COPD hospitalization (bias = 1.97, P>|t| = 0.250) showed that there was no evidence of publication bias on the association between PM10 and COPD hospitalizations with PM10. The pseudo 95% CI is computed as part of the analysis that produces the funnel plot, and corresponds to the expected 95%CI for a given standard error (SE). OR indicates odds ratio.

Figure 4.  Funnel plot for PM10 and COPD hospitalizations in the meta-analysis. Publication bias was tested by using funnel plots for COPD hospitalization. The combined data obtained from Egger's test for COPD hospitalization (bias = 1.97, P>|t| = 0.250) showed that there was no evidence of publication bias on the association between PM10 and COPD hospitalizations with PM10. The pseudo 95% CI is computed as part of the analysis that produces the funnel plot, and corresponds to the expected 95%CI for a given standard error (SE). OR indicates odds ratio.

Figure 5.  Funnel plot for PM10 and COPD mortality in the meta-analysis. Publication bias was tested by using funnel plots for COPD mortality. The combined data obtained from Egger's test for COPD mortality (bias = 0.16, P>|t| = 0.882) showed that there was no evidence of publication bias on the association between PM10 and COPD mortality with PM10. The pseudo 95% CI is computed as part of the analysis that produces the funnel plot, and corresponds to the expected 95%CI for a given standard error (SE). OR indicates odds ratio.

Figure 5.  Funnel plot for PM10 and COPD mortality in the meta-analysis. Publication bias was tested by using funnel plots for COPD mortality. The combined data obtained from Egger's test for COPD mortality (bias = 0.16, P>|t| = 0.882) showed that there was no evidence of publication bias on the association between PM10 and COPD mortality with PM10. The pseudo 95% CI is computed as part of the analysis that produces the funnel plot, and corresponds to the expected 95%CI for a given standard error (SE). OR indicates odds ratio.

Table 2.  Studies included in the meta-analysis in different groups between PM10 and COPD hospitalizations and mortality
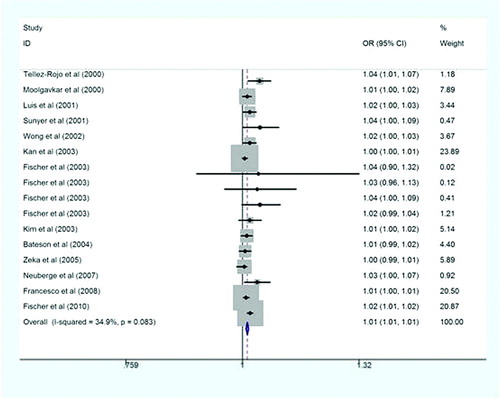
Reprints and Corporate Permissions

Please note: Selecting permissions does not provide access to the full text of the article, please see our help page How do I view content?

To request a reprint or corporate permissions for this article, please click on the relevant link below:

Academic Permissions

Please note: Selecting permissions does not provide access to the full text of the article, please see our help page How do I view content?

Obtain permissions instantly via Rightslink by clicking on the button below:

If you are unable to obtain permissions via Rightslink, please complete and submit this Permissions form. For more information, please visit our Permissions help page.