Figures & data
Fig. 1 Apigenin (API) enhances the expression of human neural precursor cell markers. Representative immunofluorescence images for detection of neural precursor cell markers nestin (NES; green, a and c) and SOX2 (green, b and d) counterstained with DAPI (blue). Human embryonic stem (hES) cells treated with 10 µM API for the six initial days of culture showed intense immunostaining for (c) NES and (d) SOX2. Bar graph showing the percentage of NES (e) and SOX2 (f) positive cells in each treatment group. Control cells (cells cultured without API) displayed few cells staining for both markers: (a) NES (p=0.00103) and (b) SOX2 (p=0.00421). Scale bar=50 µm. The values are expressed as the mean±SEM; n=3.
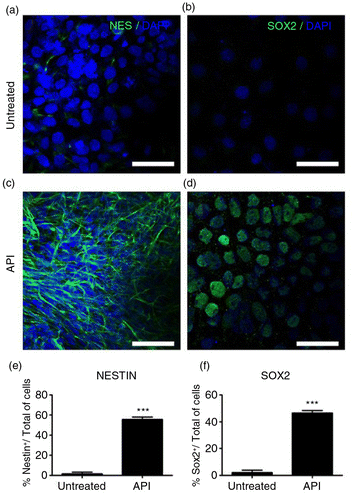
Fig. 2 Estrogen receptor (ER) activation is required for API-induced differentiation into neural progenitors. Representative immunofluorescence images staining for (a) NES (green) counterstained with DAPI (blue). hES cells were treated with 10 µM API for the six initial days of culture in the presence of ER antagonists applied starting 2 h prior to API treatment. The antagonists used were (b) 10 nM methyl-piperidino-pyrazole (MPP; ESR1) and (c) 1 µM pyrazolo[1,5-a]pyrimidine (PHTPP; ESR2). API-induced neural differentiation was inhibited by ER antagonists. A reduction in the number of NES+ cells was observed after treatment with MPP (one-way ANOVA, p=0.0000833769) and with PHTPP (one-way ANOVA, p=0.00478). (d) Bar graph showing the percentage of NES+ cells in each treatment group; the values are expressed as the mean±SEM; n=3. Scale bar=50 µm.
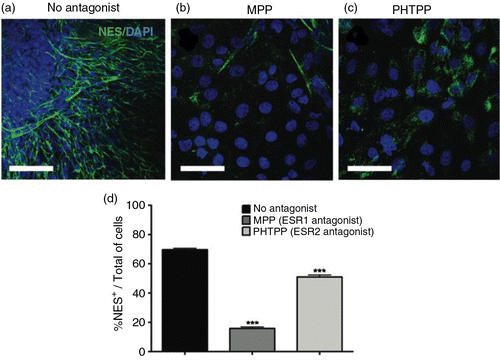
Fig. 3 API modulates retinoic acid receptor (RAR) expression. Images of dual labeling for NES (green) and RARA (red) show more intense staining for both proteins in hES cells (b) treated with 10 µM API compared to (a) untreated control cells. (c) The fluorescence intensity as a percentage of the total number of cells shows significantly increased RARA staining in API-treated cells compared to untreated controls (p=0.00047). (d) Western blotting showed increased expression of RARB (p=0.00276) and RXRG (p=0.00633), but not for RARG1 (p=0.10777), RXRA (p=0.70516), or RXRB in treated cells. Quantification of Western blotting for (e) RARB, (f) RARG1, (g) RXRA, and (h) RXRG are shown. The results were normalized relative to a control group considered as 100% and at least three independent experiments. The values are expressed as the mean±SEM; n=3, t-test. Scale bar=50 µm.
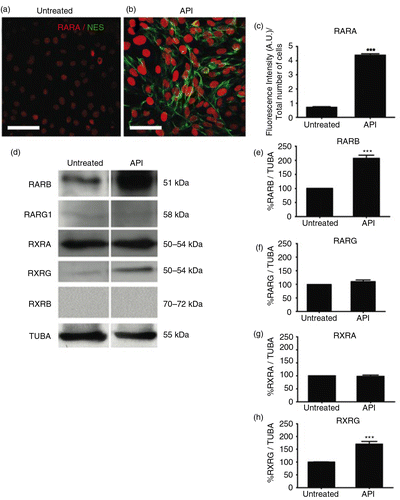
Fig. 4 RARs participate in neural differentiation. hES cells were treated with 10 µM API for the first 6 days of culture (18 days total) (a). RAR antagonists were applied to cell cultures starting 2 h before and during the entirety of API treatment. Images show immunofluorescence staining for NES (green) counterstained with DAPI (blue). API-induced neural differentiation was inhibited by RAR antagonists. A reduction in the number of NES+ cells was observed after treatment with (b) 10 µM ER 50891 (p=0.00701), (c) 10 µM LE 135 (p=0.000281), (d) 10 µM MM 11253 (p=0.001171), and (e) 10 µM UVI 3003 (p=0.001787) compared to (a) cells treated with API alone. Quantification is shown in (f). The values are expressed as the mean±SEM; n=3 (one-way ANOVA). Scale bar=50 µm.
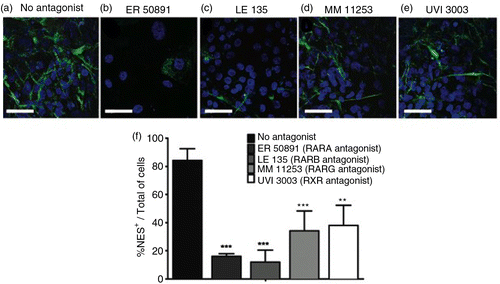
Fig. 5 API induces human neuronal differentiation. Neural progenitors obtained from hES cells treated with API were allowed to differentiate for an additional 25 days in medium without API (see Methods in the Supplementary file). Undifferentiated hES cells were used as a negative control. Phase-contrast microscopy (a, b) or immunofluorescence staining for the following neuronal markers: (c, d) microtubule-associated protein 2 (MAP2), (e, f) synapsin 1 (SYN1), (g, h) calretinin (CALB2), (i, j) β-tubulin class III (TUBB3), (k, l) polysialic acid form of neural cell adhesion molecule (PSA-NCAM), (m, n) neurofilament (NEF), and (m, n) myelin basic protein (MBP), (o, p) synaptophysin (SYP), and (o, p) DLG4. Scale bar=50 µm.
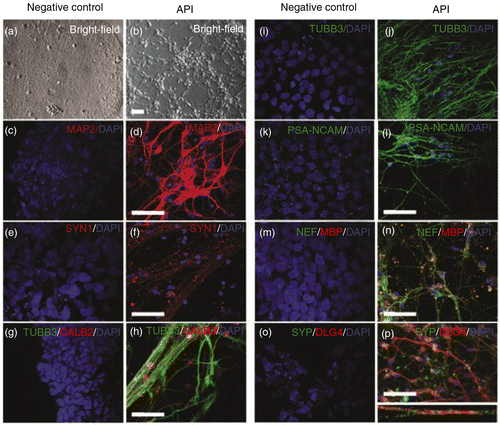
Fig. 6 Distinct neuronal and glial markers after API neuronal differentiation. Neuronal diversity induced by API treatment is characterized by the presence of specific neuronal subtype markers such as (a, b) choline acetyltransferase (CHAT), (a, b) glutamate decarboxylase (GAD1), (c, d) glial fibrillary acidic protein (GFAP), (c, d) brain lipid-binding protein (FABP7), (e, f) parvalbumin (PVALB), and (e, f) tau protein (MAPT). Pluripotent hES H9 cells were used as a control and were negative for all neuronal and glial markers (a, c, e). Scale bar=50 µm.
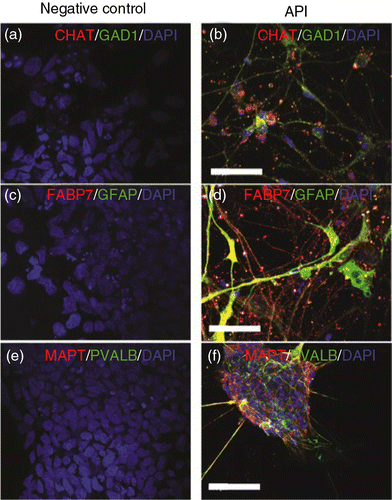
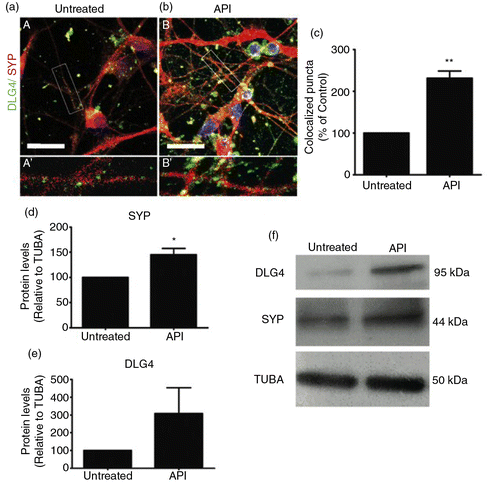
Fig. 7 API augments formation of synapses. Confocal microscopy of dual staining for the synaptic markers SYP (red) and DLG4 (green). Retinoic acid-induced neurons were treated with 1 µM API for 72 h. Untreated (A and A′) and API-treated (B and B′) cells presented neuronal morphology and were positively stained for SYP and DLG4. (b) API-treated cells showed more intense staining for both markers compared to (a) the untreated group. Insets show high-magnification images of selected areas in A and B with co-localized puncta in yellow (A′ and B′). (c) Higher co-localization indexes were measured after API treatment (t-test, p=0.0016; n=3). (d–f) Levels of synaptic protein expression were evaluated by Western blotting. Western blotting showed increased expression of SYP (p=0.0063287) but not DLG4 (p=0.287319) in treated cells. The results were normalized relative to a control group considered as 100% and at least three independent experiments. The values are expressed as the mean±SEM. Scale bar=50 µm.