
 ?Mathematical formulae have been encoded as MathML and are displayed in this HTML version using MathJax in order to improve their display. Uncheck the box to turn MathJax off. This feature requires Javascript. Click on a formula to zoom.
Abstract
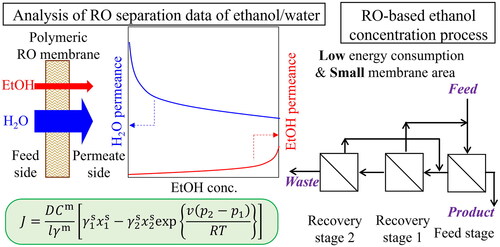
This study successfully analyzed the reverse osmosis (RO) separation performances of ethanol/water mixture (1–37 wt% of ethanol) with polymeric RO membranes using transport equations derived on the basis of the solution-diffusion mechanism in which the permeation flux is proportional to the chemical potential gradient. It was demonstrated that the obtained permeation data were well correlated with the transport equations. By utilizing the analyzed results, multi-stage RO processes for ethanol concentration from 5 to 40 wt% were evaluated in terms of required energy with the conventional distillation design. According to the process evaluation, existing polymeric RO membranes for desalination were not applicable to the ethanol concentration since estimated required energy was larger than distillation. Instead, RO membrane having assumed hypothetical permeance values for ethanol of 0.1 times and water of 2 times was proved to be feasible to achieve lower energy consumption, which can be used as a design guide.
Graphical abstract
1. Introduction
Prevention of global warming has become an urgent issue, and various technologies such as CO2 separation and recovery, emissions reduction, and recycling are being actively developed. Given that biomass grows by absorbing CO2 from the atmosphere, it is considered a carbon-neutral energy source, and the development of technology to utilize it is attracting attention. A representative technology is the fermentation of biomass to obtain ethanol as fuel (Aditiya et al. Citation2016; Guo and Song Citation2019). Biomass ethanol has already been put into practical use as a fuel for automobiles in Brazil and other countries (Lopes et al. Citation2016; Soccol et al. Citation2010). In the fermentation process, the concentration of ethanol product is affected by characteristics of the main feedstock (e.g., corn or sugarcane) and fermentation conditions, and it ranges from several to 10 wt%. However, ethanol must be anhydrous for use as automobile fuel. Although distillation is usually used to concentrate the ethanol product, further extractive distillation is required to obtain anhydrous ethanol because there is an azeotropic point at 96 wt% at atmospheric pressure. Such a series of distillation steps becomes an energy-intensive process and accordingly is not favorable in terms of reducing CO2 emissions (Biasi et al. Citation2021; Kaymak Citation2019; Kiss and Suszwalak Citation2012).
In recent years, the use of hydrogen as a secondary form of energy has attracted attention (Dawood et al. Citation2020; Muradov Citation2017). The development of hydrogen combustion power generation, hydrogen engines, hydrogen fuel cells, and related technologies is actively progressing. However, because hydrogen is not a primary energy source, it must be produced in some way. The most widely used method of hydrogen production is steam reforming of methane (Akamatsu et al. Citation2011; Angeli et al. Citation2014; Broda et al. Citation2012), but this reaction produces CO2 and is meaningless as an approach to address global warming. In such processes, consideration must be given to the requirements for the separation, recovery, reuse, and storage of the generated CO2. By contrast, when the steam reforming reaction of biomass ethanol is used to obtain hydrogen (C2H5OH + 3 H2O ⇄ 6 H2 + 2 CO2), the generated CO2 is not formally considered an emission because of the carbon-neutral nature of the fuel. The stoichiometric ratio of ethanol and water in the ethanol steam reforming reaction is 1:3 (Ghungrud and Vaidya Citation2020; Jia et al. Citation2020; Ni et al. Citation2007), which means the required ethanol concentration is 46 wt% at the highest. Thus, in case of ethanol reforming, anhydrous ethanol is not required to produce hydrogen from biomass ethanol. Assuming that the concentration of fermentation ethanol is 5 wt%, it would be sufficient to concentrate the product from 5 to 40–46 wt%, and, if this could be achieved by an appropriate membrane process, it would be much less energy intensive than conventional distillation methods. In fact, membranes for pervaporation (PV) have been developed extensively (Dharupaneedi et al. Citation2014; Guo et al. Citation2010; Kamtsikakis et al. Citation2021; Zhan et al. Citation2012; Zhou et al. Citation2014). Generally, PV is less energy-consuming than distillation, but the permeation accompanies the phase change from liquid to vapor, which requires the energy. Reverse osmosis (RO) is more promising in principle because the permeation accompanies no phase change (Liu et al. Citation2021). For example, Chiao et al. (Citation2023) developed RO membranes having over 90% ethanol rejection when aqueous solution containing 1 wt% ethanol was fed. However, process design and optimization of the concentrating aqueous ethanol solution by RO in terms of energy consumption and required membrane area have not been investigated.
In assessing the feasibility of ethanol concentration by RO with commercially available polymeric RO membranes, two major issues should be addressed. First, we should clarify the permeation performances of ethanol and water, in particular the relationships between the ethanol concentration and flux with rejection. Furthermore, we should analyze the separation data to generate quantitative equations that can predict the permeations, based on the transport equations in RO. However, there are few data on the separation of ethanol solution with such high concentrations (∼40 wt%) with polymeric RO membranes. For the analysis, the Kimura–Sourirajan permeation equation using two membrane permeation coefficients (Kimura and Sourirajan Citation1967) and the Kedem–Katchalsky transport equation based on non-equilibrium thermodynamics with three transport parameters (Kedem and Katchalsky Citation1958) are generally used in RO, especially for seawater desalination. In these transport equations, the membrane permeation flux is treated as the solution permeation flux and the solute permeation flux, where the solute volume is ignored. However, the volume of ethanol is not negligible when considering such high concentrations of ethanol. By contrast, Kataoka et al. (Citation1991a) developed general permeation equations based on the solution-diffusion model that can be applied to RO as well as PV and vapor permeation (VP). In their theory, the permeation flux is proportional to its chemical potential gradient rather than the pressure difference. Very recently, the feasibility of this fundamental concept was recognized by Moriyama et al., and they discussed a generalized pore-flow model to describe the separation performance of the organosilica membrane with micropores smaller than 1 nm (Moriyama et al. Citation2022). The theory by Kataoka et al. could enable the analysis of RO data for such highly concentrated ethanol solution. However, Kataoka et al. only demonstrated the validity of their theory by comparing experimental separation data with theoretical predictions for PV and VP (Kataoka et al. Citation1991b). No conclusion has been reached for separations based on RO.
The second aspect of assessing the feasibility of RO for concentrating aqueous ethanol involves the consideration of energy requirements through the use of transport equations. Here, we should give special consideration to the limitations caused by osmotic pressure. The respective osmotic pressures for 10, 19, and 46 wt% are approximately 5, 10, and 25 MPa. Generally, polymeric RO membranes suffer from compaction problems when exposed to 10 MPa or higher (Kumakiri et al. Citation2000), so it would be almost impossible to achieve a one-stage membrane process even if the RO membranes could completely reject ethanol permeation at high concentration. To overcome such osmotic pressure limitations in concentration of brine, osmotically assisted reverse osmosis (OARO) and low salt-rejection reverse osmosis (LSRRO) have been developed (Bartholomew et al. Citation2017; Chen and Yip Citation2018; Chong et al. Citation2015; Peters and Hankins Citation2019; Togo et al. Citation2019; Wang et al. Citation2020, Citation2021). OARO is an operation where a solution having similar or identical osmotic pressure as feed solution is also fed to the permeate side to decrease the osmotic pressure difference. In LSRRO, the use of RO membranes having low salt-rejections results in the permeation with a little lower concentration than the feed. This means that the osmotic pressure difference becomes smaller. The permeation of water might be discussed in terms of the Kimura–Sourirajan model or the Kedem–Katchalsky equation for both OARO and LSRRO, and both methods alleviate the applied pressure that is required for separation by decreasing the osmotic pressure difference, as explained above. However, no study has considered the process design of ethanol concentration with RO by analyzing permeation performance data with the transport equations of Kataoka et al., which focuses on the chemical potential gradient rather than the pressure difference.
In this study, two commercially available polymeric RO membranes that had been originally developed for desalination were used to conduct permeation tests of aqueous solutions containing 1 − 37 wt% ethanol. The experimental data were analyzed with the transport equations developed by Kataoka et al. to demonstrate the validity of the transport model. Next, we designed ethanol concentration processes. Membranes with low ethanol rejection were assumed to concentrate up to high concentration; however, use of these membranes resulted in low ethanol recovery. To obtain a high recovery ratio, it is necessary to set up a multi-stage recycling process. In this study, we demonstrated the optimized multi-staged processes with recycle, were able to concentrate ethanol from 5 to 40 wt% with acceptable recovery ratio. Process evaluation was performed from the viewpoints of membrane area and energy required for the concentration. For comparison, the energy required for concentration by distillation was also calculated.
2. Transport Equations and Experimental
2.1. Transport equations
It is considered that the permeations of ethanol/water mixtures through RO membranes are subject to the solution-diffusion mechanism. As pointed out in the Introduction, Kataoka et al. (Citation1991a) proposed a transport equation for membrane permeation based on this mechanism. Briefly, according to their derivation, the permeation flux is proportional to the chemical potential gradient as follows.
(1)
(1)
When the pressure in the membrane pm is assumed to be constant and equal to the feed-side pressure p1, then
(2)
(2)
Assuming that the membrane thickness is l, integrating EquationEq. (2)(2)
(2) from z = 0 to z = l gives
(3)
(3)
EquationEquation (3)(3)
(3) shows diffusion flux in the membrane.
At the interface of the membrane surface and the solution, equilibrium is regarded to be established and the chemical potential in the solution is equal to the chemical potential in the membrane. Therefore, at the feed side,
(4)
(4)
and at the permeate side,
(5)
(5)
is assumed to be independent of the concentration. Substituting EquationEqs. (4)
(4)
(4) and Equation(5)
(5)
(5) into EquationEq. (3)
(3)
(3) thus gives
(6)
(6)
EquationEquation (6)(6)
(6) holds for both ethanol and water and can be applied to the RO method as a transport equation based on the solution-diffusion mechanism. In this article, subscript e indicates ethanol, subscript w indicates water, and the coefficient part of EquationEq. (6)
(6)
(6) is expressed as P (permeance). Therefore, the transport equations are
(7)
(7)
for ethanol, and
(8)
(8)
for water.
2.2. Experimental
Two commercially available polymeric RO membranes (UTC-80S, Toray Industries; SWC4+, Nitto Denko), which are generally used for desalination and accordingly expected to have higher ethanol rejection than other low-pressure RO membranes, were used to measure the flux with the rejection. Both are the flat-sheet type. The characteristics and performances of the RO membrane elements fabricated with these membranes, which was provided by the manufacturers, were shown in . The ethanol aqueous solution was prepared using reagent-grade ethanol (Wako Pure Chemical Industries, Japan) and pure water prepared with an ultrapure water production apparatus. The ethanol concentration was measured by a total organic carbon analyzer (TOC; TOC-VCSH, Shimadzu, Japan). When the ethanol concentration was high, the sample was diluted by a factor of 100–1000 for the TOC measurement. The experiment was carried out in a total circulation system equipped with a plunger pump and a flow cell, as shown in . The ethanol concentration in the feed varied from 1 to 37 wt%. The effective membrane area was 4.42 × 10⁻³ m2. All experiments were performed at transmembrane pressures of 3, 5, and 8 MPa, and flow rates of 3 and 6 L min−1. The pressure drop was confirmed negligible in the series of the tests. The feed temperature was maintained at 25 °C.
Figure 1. A schematic diagram of the RO separation tests of ethanol/water mixture.

Table 1. Characteristics and performances of the RO membrane elements fabricated with UTC-80S and SWC4+.
To estimate the activity coefficients for the analysis, Aspen Plus Version 8.8 was used to obtain the relationship between the ethanol molar ratio and the binary activity coefficients at 25 °C by using NRTL activity coefficient model (Renon and Prausnitz Citation1968) with Aspen Plus NRTL binary parameters. The osmotic pressure was calculated from the activity coefficient, as follows.
(9)
(9)
shows the osmotic pressure as a function of ethanol concentration [activity coefficient γ determined from EquationEq. (11)(11)
(11) ]. As shown later in , γ was well estimated and accordingly the osmotic pressure was also well calculated, based on the definition.
Figure 2. Osmotic pressure of aqueous solution containing ethanol calculated with EquationEqs. (9)(9)
(9) and Equation(11)
(11)
(11) at 25 °C.

Figure 3. Activity coefficients of ethanol and water calculated by ASPEN PLUS with NRTL model. Comparison with other reports are also shown.

3. Results and Discussion
3.1. Concentration Dependence of Flux and Rejection
and show the concentration dependence of permeation flux through the UTC-80S membrane and the SWC4+ membrane, respectively. The permeation flux was higher at higher operating pressures. It decreased rapidly with increased ethanol concentration in the feed solution, and the decrease became very slight from about 15 wt%. As shown in , the osmotic pressure was about 10 MPa at 20 wt% ethanol, and about 16 MPa at 30 wt%, which exceeded the maximum operating pressure of 8 MPa. However, permeation fluxes were obtained. This was because the osmotic pressure differences were small because of low rejection. The most important point is the fact that the permeation occurs when the transmembrane pressure is larger than the osmotic pressure difference between the feed solution and the permeate solution. The absolute value of the osmotic pressure in feed and permeate does not matter. The reason why permeation fluxes were almost constant over 15 wt% ethanol was the fact that the osmotic pressure difference was not dependent on the feed concentration due to lower rejection at such a higher concentration range. We should also note that the effect of the flow rate on flux was hardly observed for both membranes. Overall, the UTC-80S membrane showed higher permeation fluxes within the measured concentration range.
Figure 4. (a) Flux through UTC-80S membrane. (b) Observed rejection by UTC-80S membrane. Lines calculated with EquationEqs. (7)(7)
(7) and Equation(8)
(8)
(8) and EquationEqs. (12)–(14).
![Figure 4. (a) Flux through UTC-80S membrane. (b) Observed rejection by UTC-80S membrane. Lines calculated with EquationEqs. (7)(7) Je=Pe[γe1sxe1s−γe2sxe2sexp{ve(p2−p1)RT}] (7) and Equation(8)(8) Jw=Pw[γw1sxw1s−γw2sxw2sexp{vw(p2−p1)RT}] (8) and EquationEqs. (12)–(14).](/cms/asset/aecac376-9aca-40d7-9119-77fae4b98067/tjce_a_2294934_f0004_c.jpg)
Figure 5. (a) Flux through SWC4+ membrane. (b) Observed rejection by SWC4+ membrane. Lines calculated with EquationEqs. (7)(7)
(7) and Equation(8)
(8)
(8) and EquationEqs. (15)–(18).
![Figure 5. (a) Flux through SWC4+ membrane. (b) Observed rejection by SWC4+ membrane. Lines calculated with EquationEqs. (7)(7) Je=Pe[γe1sxe1s−γe2sxe2sexp{ve(p2−p1)RT}] (7) and Equation(8)(8) Jw=Pw[γw1sxw1s−γw2sxw2sexp{vw(p2−p1)RT}] (8) and EquationEqs. (15)–(18).](/cms/asset/55e108b5-3b91-465a-b2f6-692ed3b0ef27/tjce_a_2294934_f0005_c.jpg)
and show the concentration dependence of the observed rejection by the UTC-80S and SWC4+ membranes, respectively. The observed rejection was higher at higher operating pressures. Both membranes showed rejection of 70–80% in the low concentration range, and the rejection decreased drastically with increasing ethanol concentration. The decrease became gradual above 15 wt%. In particular, the SWC4+ membrane had higher rejection at each concentration. A trade-off relationship between flux and rejection was observed. In addition, any effect of flow rate on rejection was barely noticeable. This was because the membrane cell used in this study was designed to promote mass transfer. Given that the flow rate had little effect on permeation flux and rejection, we concluded that concentration polarization was negligible in the series of experiments. Concentration polarization was not considered in the subsequent analyses.
3.2. Permeance
Based on the transport equations developed by Kataoka et al., the activity coefficient is required to obtain the permeance from the experimental results. The obtained isothermal binary activity coefficient curves were translated into polynomial functions for ethanol and water with the function of ethanol concentration as indicated in EquationEqs. (10)(10)
(10) and Equation(11)
(11)
(11) , respectively.
(10)
(10)
(11)
(11)
where γ and x are activity coefficient and molar fraction of ethanol, respectively. The calculation results are shown in . Compared with the reported values by other researchers (Dobson Citation1925; Hall et al. Citation1979; Nikolskaya Citation1946; Phutela et al. Citation1979; Yamamoto et al. Citation1995), the estimation by NRTL model is demonstrated to be quite good.
The permeance Pe and Pw, defined by EquationEqs. (7)(7)
(7) and Equation(8)
(8)
(8) , were estimated from experimental results shown in and . and show the respective results for the UTC-80S membrane and the SWC4+ membrane. As discussed in the previous section, the permeation flux and rejection did not dependent on pressure or flow rate, and accordingly, the permeances do not depend on them. Approximation equations for Pe and Pw through each membrane were obtained by fitting the obtained data as a function of ethanol concentration, and they were used in subsequent process design. When the entire concentration region could not be approximated by one equation, it was divided into smaller regions where the decrease or increase was rapid and where the decrease or increase was slight. These regions were then expressed by two approximation formulas. The connection point between the two approximations was made as smooth as possible. The obtained approximation formulas for UTC-80S membrane were
(12)
(12)
for ethanol, and
(13)
(13)
(14)
(14)
for water.
Figure 6. Concentration dependency of water and ethanol permeance of UTC-80S membrane. Lines calculated from EquationEqs. (12)–(14).

Figure 7. Concentration dependency of water and ethanol permeance of SWC4+ membrane. Lines calculated from EquationEqs. (15)–(18).

The obtained approximation formulas for SWC4+ membrane were
(15)
(15)
(16)
(16)
for ethanol, and
(17)
(17)
(18)
(18)
for water, where y is ethanol concentration in the feed solution [wt%]. The calculation lines using the approximation formulas are also shown in and as solid lines. They are in good agreement with the experimental values. Consequently, permeation flux and rejection can be estimated by using the abovementioned approximations of permeance shown in and with the transport equations [EquationEqs. (7)
(7)
(7) and Equation(8)
(8)
(8) ]. The results calculated using the experimental conditions are also shown in and . It is clear that each calculated line agrees well with the experimental values. The permeance P is determined by D, Cm, l and
When the membrane thickness is constant regardless of the ethanol concentration in the membrane, we have to investigate how the relationships between the ethanol concentration in the feed and D, Cm and
are correlated to understand the behaviors of P shown in and , and accordingly the trends of flux and rejection. Furthermore, membrane swelling, in particular at higher concentration range, might occur and accordingly D, Cm and
might be affected. This is our challenge for the future. Based on the above results, we can conclude that it is possible to use EquationEqs. (7)
(7)
(7) and Equation(8)
(8)
(8) , which are based on the solution-diffusion model, as transport equations for analyzing RO separation data for ethanol/water mixtures.
3.3. Design of Concentration Processes
3.3.1. Process Design Conditions
The RO process was designed to concentrate ethanol from 5 wt%, which is a typical concentration of fermentation ethanol, to 40 wt%, which is close to the stoichiometric ratio for steam reforming. The final concentration was not set at 46 wt% because the steam reforming of ethanol is often carried out under an excess amount of water vapor to avoid carbon deposition. At every stage, the RO process was a crossflow process, the operating pressure was 8 MPa, and the solution temperature was 25 °C. The flow rate of the feed solution was set to be 1 L min−1 for simplicity. Concentration polarization was not considered, and the approximation formula for the experimental values shown in Section 3.2 were used for the permeances of ethanol and water.
3.3.2. Single-Stage Concentration
The process calculation revealed that a concentration of up to 40 wt% could be achieved in a one-stage concentration using either the UTC-80S membrane or the SWC4+ membrane. However, the ethanol recovery ratio, defined by EquationEq. (19)(19)
(19) , was extremely low at 1.07% with UTC-80S and 3.31% with SWC4+.
(19)
(19)
The required membrane area was 2.81 m2 for UTC-80S membrane and 4.58 m2 for SWC4+. In each case, the recovery ratio was too low, and the process requires recovery stages, which is discussed in the next section.
3.3.3. Multi-Stage Recycling Processes
Multi-stage circulation processes with recovery stages were designed under the following conditions:
SWC4+ membrane is used.
The retentate is mixed with the feed of the previous stage.
Make the concentration of the circulating fluid equal to that of the mixed fluid.
Calculate the pressurization energy E [MJ kg−1 ethanol] of the supplied liquid according to EquationEq. (20)
(20)
Membrane area is proportional to process feed flow rate.
Pressure drop in each stage is negligible.
The last assumption is also valid because the operation pressure is as high as 8 MPa. In addition, we don’t consider a specific membrane module here and accordingly we cannot estimate the pressure drop because it is affected by the module structure. The flow type is cross-flow. For processes consisting of a feed stage and a recovery stage (FS-RS1), a feed stage and two recovery stages (FS-RS2), and a feed stage and three recovery stages (FS-RS3), calculations were performed to determine the flow rates, concentrations, membrane areas of each stream, and pressurization energies. The schematic illustrations of FS-RS1, FS-RS2 and FS-RS3 are shown in Figure S1 in the supplementary information. shows the results for the FS-RS2 process as an example. The numbers in the upper part of each box indicate the flow rate [L min−1], and the numbers in the lower part indicate the ethanol concentration [wt%]. The material balance of ethanol was confirmed by considering the density that is dependent on the ethanol concentration. This process requires three pressurization pumps: one for the process feed, one for the FS permeate, and one for the RS1 permeate.
Figure 8. Concentration and flow rate of each flow in FS-RS2 multi-stage recirculating process.

summarizes the ethanol recovery ratio, membrane area, and required energy for the three types of multi-stage recycling process. Although the recovery ratio was greatly improved by providing a recovery stage, two recovery stages were required to obtain a recovery ratio of 95% or more. The membrane area is very large for a feed liquid flow rate of 1 L min−1 because the water permeance of the membrane is low in the high concentration range as shown in . The required energy is also very large. This is because the flow rate supplied to the first recovery stage is very high.
Table 2. Ethanol recovery ratio, membrane area, and energy required for multi-stage recycling processes.
Aqueous ethanol solutions are usually concentrated by distillation. Therefore, we designed a distillation process and calculated the required energy for comparison with the energy requirements of the RO method. The feed preheat can be heated by the cooling duty at bottom stream. The condenser and ethanol product cooler duty at top is very little cost impact on energy since no reflux liquid and small flow rate of ethanol product and using cooling water, compared with the reboiler using a low pressure steam of 3 bar. The feed ethanol concentration was 5 wt% and it was concentrated to 40 wt%. The ethanol feed stream was fed into the top stage of the distillation column because the relative volatility of ethanol over water at low ethanol concentration is large, and accordingly the concentration section of the distillation column is not needed. Reflux drum is neither needed. However, some stages were needed to achieve 98% ethanol recovery. To evaluate the energy consumption with heat recovery from the waste water from the bottom section of the column, the temperature of the feed was varied from 25 °C (no heat recovery) to 75 °C (maximum heat recovery). The energy requirement was calculated for six to eight theoretical stages with the constraints of 40 wt% ethanol product and 98% ethanol recovery. The energy required to power the liquid feed pump was negligible compared with the reboiler energy. The results are summarized in .
Table 3. Energy required in distillation column to concentrate ethanol from 5 to 40 wt% with recovery ratio of 98%.
As shown in and , RO concentration requires more energy than distillation. This is because the membrane used in this study was a polymeric membrane for desalination and was optimized for the purpose. Therefore, the rejection ability of ethanol is low in the high concentration range. This suggests that novel RO membranes should be prepared that provide higher rejection of ethanol even at high ethanol concentrations.
3.3.4. Membrane Performance Required for Developing a Process that Uses Less Energy than Distillation
To reduce the energy required for concentration by RO below the levels required for distillation, we investigated the required level of ethanol separation performance for the RO membrane. The separation performance of the membrane improves with decreasing ethanol permeance Pe and with increasing water permeance Pw. Here, for the sake of simplification, we introduced the multiple factors for the permeances Pw and Pe obtained by experiment [EquationEqs. (12)–(18)]. The data in indicates that three recovery stages are required to obtain a 98% recovery or higher. However, if the membrane performance is improved, two recovery stages would be sufficient to obtain 98% recovery or higher. Therefore, the FS-RS2 process was selected to study high-performance membranes.
summarizes the results for analysis of the FS-RS2 process. Ethanol permeances of 0.5 times and 0.1 times were examined, and water permeances of 2 times and 5 times were examined. All the ethanol recoveries were higher than 98%, and the membrane area decreased as the membrane performance improved. The required energy also decreased. As shown in (the material balance of ethanol was also confirmed by considering the density that is dependent on the ethanol concentration) and , if a membrane with a Pe of 0.1 times and a Pw of 2 times is successfully prepared, the ethanol recovery will be 99.99% with a total membrane area as low as 9.34 m2, and the required energy of 4.80 MJ kg−1 ethanol would be lower than the energy required for the eight-stage distillation method (6.91 MJ kg−1 ethanol). If Pw is increased by a factor of 5, more energy will be saved. However, current polymeric RO membranes are very thin, so it would be difficult to increase Pw by a factor of 5. Alternatively, it may be more important to lower the ethanol permeance by a factor of 10 through the development of membrane materials that highly reject ethanol permeation. Furthermore, it will be possible to optimize membrane performance for each stage for achieving more energy-efficient with smaller membrane area, even though the process design in this study just assumed one membrane for all the stages. This is a challenge for future.
Figure 9. Concentration and flow rate of each flow in FS-RS2 multi-stage recirculating process with Pe × 0.1 and Pw × 2.

Table 4. Summary of FS-RS2 processes with Qe and Qw changed.
4. Conclusions
We carried out RO separation tests of ethanol/water mixtures with ethanol concentrations ranging from 1 to 37 wt%. The permeation data were analyzed using transport equations that were based on the solution-diffusion model developed by Kataoka et al. Based on the analyses, we assessed the feasibility of multi-stage recycling RO processes for concentrating ethanol from 5 to 40 wt%. It was experimentally demonstrated that the transport equations [EquationEqs. (7)(7)
(7) and Equation(8)
(8)
(8) ] can be used to analyze the membrane permeation performance of an aqueous ethanol solution up to a concentration of 40 wt%. Membrane performance was expressed in terms of the permeances of ethanol and water, and these values were found to be dependent on concentration. For the RO process, it was possible to concentrate ethanol up to 40 wt%, even in a single stage, but the recovery of ethanol was too low. The RO membrane used in the experiment had a low ethanol rejection performance in the high ethanol concentration range. As a result, the circulating flow rate became large in multi-stage recirculating processes, thereby requiring high membrane area and high energy consumption. As a result, we concluded that the existing polymeric RO membranes for desalination were not sufficient to reduce the required energy from the existing distillation processes. In order to obtain the development target for RO membrane for the ethanol concentration applications, we introduced the multiple factors for the correlated permeances to demonstrate the acceptable performance of the ethanol concentration processes. Assumed hypothetical RO permeance model demonstrates that lower energy requirement than that of distillation and acceptable membrane area could be achieved with the permeance factors of 0.1 for ethanol and 2 for water.
| Nomenclature | ||
| Cm | = | concentration in membrane [mol m−3] |
| D | = | diffusion coefficient [m2 s−1] |
| E | = | pressurized energy [J s−1] |
| J | = | flux [mol m−2 s−1] |
| k | = | mass transfer coefficient [m s−1] |
| l | = | membrane thickness [m] |
| p | = | pressure [Pa] |
| pm | = | pressure in membrane [Pa] |
| Pe | = | permeance of ethanol [mol m−2 s−1] |
| Pw | = | permeance of water [mol m−2 s−1] |
| R | = | gas constant [J mol−1 K−1] |
| T | = | absolute temperature [K] |
| v | = | molar volume [m3 mol−1] |
| x | = | molar fraction of ethanol [−] |
| xm | = | molar fraction in membrane [−] |
| y | = | ethanol concentration of ethanol in feed [wt%] |
| z | = | position [m] |
| γ | = | activity coefficient [−] |
| ηe | = | power generation efficiency [−] |
| ηp | = | pump efficiency [−] |
| μ | = | chemical potential [J mol−1] |
| π | = | osmotic pressure [Pa] |
| Subscripts | ||
| 1 | = | feed side |
| 2 | = | permeate side |
| e | = | ethanol |
| w | = | water |
| Superscripts | ||
| m | = | inside membrane |
| s | = | outside membrane |
Supplemental Material
Download MS Word (64.3 KB)Acknowledgements
We thank Toray Industries, Inc, Japan and Nitto Denko Corporation, Japan for kindly supplying RO membranes. We also thank Austin Schultz, PhD, from Edanz (https://jp.edanz.com/ac) for editing a draft of this manuscript.
References
- Aditiya HB, Mahlia TMI, Chong WT, Nur H, Sebayang AH. 2016. Second generation bioethanol production: a critical review. Renew Sust Energ Rev. 66:631–653. doi: 10.1016/j.rser.2016.07.015.
- Akamatsu K, Murakami T, Sugawara T, Kikuchi R, Nakao S. 2011. Stable equilibrium shift of methane steam reforming in membrane reactors with hydrogen-selective silica membranes. AIChE J. 57:1882–1888. doi: 10.1002/aic.12404.
- Angeli SD, Monteleone G, Giaconia A, Lemonidou AA. 2014. State-of-the-art catalysts for CH4 steam reforming at low temperature. Int J Hydro Ener. 39:1979–1997. doi: 10.1016/j.ijhydene.2013.12.001.
- Bartholomew TV, Mey L, Arena JT, Siefert NS, Mauter MS. 2017. Osmotically assisted reverse osmosis for high salinity brine treatment. Desalination. 421:3–11. doi: 10.1016/j.desal.2017.04.012.
- Biasi LCK, Batista FRM, Zemp RJ, Romano ALR, Heinkenschloss M, Meirelles AJA. 2021. Parastillation and metastillation applied to bioethanol and neutral alcohol purification with energy savings. Chem Eng Process. 162:108334. doi: 10.1016/j.cep.2021.108334.
- Broda M, Kierzkowska AM, Baudouin D, Imtiaz Q, Copéret C, Müller CR. 2012. Sorbent-enhanced methane reforming over a Ni–Ca-based, bifunctional catalyst sorbent. ACS Catal. 2:1635–1646. doi: 10.1021/cs300247g.
- Chen X, Yip NY. 2018. Unlocking high-salinity desalination with cascading osmotically mediated reverse osmosis: energy and operating pressure analysis. Environ Sci Technol. 52:2242–2250. doi: 10.1021/acs.est.7b05774.
- Chiao YH, Mai Z, Hung WS, Matsuyama H. 2023. Osmotically assisted solvent reverse osmosis membrane for dewatering of aqueous ethanol solution. J Membr Sci. 672:121434. doi: 10.1016/j.memsci.2023.121434.
- Chong TH, Loo SL, Krantz WB. 2015. Energy-efficient reverse osmosis desalination process. J Membr Sci. 473:177–188. doi: 10.1016/j.memsci.2014.09.005.
- Dawood F, Anda M, Shafiullah GM. 2020. Hydrogen production for energy: An overview. Int J Hydro Ener. 45:3847–3869. doi: 10.1016/j.ijhydene.2019.12.059.
- Dharupaneedi SP, Anjanapura RV, Han JM, Aminabhavi TM. 2014. Functionalized graphene sheets embedded in chitosan nanocomposite membranes for ethanol and isopropanol dehydration via pervaporation. Ind Eng Chem Res. 53:14474–14484. doi: 10.1021/ie502751h.
- Dobson HJE. 1925. CCCXCVII.—the partial pressures of aqueous ethyl alcohol. J Chem Soc Trans. 127:2866–2873. doi: 10.1039/CT9252702866.
- Ghungrud SA, Vaidya PD. 2020. Improved hydrogen production from sorption-enhanced steam reforming of ethanol (SESRE) using multifunctional materials of cobalt catalyst and Mg-, Ce-, and Zr-modified CaO sorbents. Ind Eng Chem Res. 59:693–703. doi: 10.1021/acs.iecr.9b05472.
- Guo J, Zhang G, Wu W, Ji S, Qin Z, Liu Z. 2010. Dynamically formed inner skin hollow fiber polydimethylsiloxane/polysulfone composite membrane for alcohol permselective pervaporation. Chem Eng J. 158:558–565. doi: 10.1016/j.cej.2010.01.053.
- Guo M, Song W. 2019. The growing U.S. bioeconomy: drivers, development and constraints. N Biotechnol. 49:48–57. doi: 10.1016/j.nbt.2018.08.005.
- Hall DJ, Mash CJ, Penberton RC. 1979. Vapor–liquid equilibrium for the systems water + methanol, water + ethanol, methanol + ethanol and water + methanol + ethanol. NPL Rep Chem. 95:1–32.
- Jia H, Xu H, Sheng X, Yang X, Shen W, Goldbach A. 2020. High-temperature ethanol steam reforming in PdCu membrane reactor. J Membr Sci. 605:118083. doi: 10.1016/j.memsci.2020.118083.
- Kamtsikakis A, McBride S, Zoppe JO, Weder C. 2021. Cellulose nanofiber nanocomposite pervaporation membranes for ethanol recovery. ACS Appl Nano Mater. 4:568–579. doi: 10.1021/acsanm.0c02881.
- Kataoka T, Tsuru T, Nakao S, Kimura S. 1991a. Permeation equations developed for prediction of membrane performance in pervaporation, vapor permeation and reverse osmosis based on the solution-diffusion model. J Chem Eng Japan. 24:326–333. doi: 10.1252/jcej.24.326.
- Kataoka T, Tsuru T, Nakao S, Kimura S. 1991b. Membrane transport properties of pervaporation and vapor permeation in ethanol–water system using polyacrylonitrile and cellulose acetate membranes. J Chem Eng Japan. 24:334–339. doi: 10.1252/jcej.24.334.
- Kaymak DB. 2019. Design and control of an alternative bioethanol purification process via reactive distillation from fermentation broth. Ind Eng Chem Res. 58:1675–1685. doi: 10.1021/acs.iecr.8b04832.
- Kedem O, Katchalsky A. 1958. Thermodynamic analysis of the permeability of biological membranes to non-electrolytes. Biochim Biophys Acta. 27:229–246. doi: 10.1016/0006-3002(58)90330-5.
- Kimura S, Sourirajan S. 1967. Analysis of data in reverse osmosis with porous cellulose acetate membranes used. AIChE J. 13:497–503. doi: 10.1002/aic.690130319.
- Kiss AA, Suszwalak DJPC. 2012. Enhanced bioethanol dehydration by extractive and azeotropic distillation in dividing-wall columns. Sep Purif Technol. 86:70–78. doi: 10.1016/j.seppur.2011.10.022.
- Kumakiri I, Tsuru T, Nakao S, Kimura S. 2000. Reverse osmosis performance at high pressure with high water recovery. J Chem Eng Japan. 33:414–419. doi: 10.1252/jcej.33.414.
- Liu C, Dong G, Tsuru T, Matsuyama H. 2021. Organic solvent reverse osmosis membranes for organic liquid mixture separation: a review. J Membr Sci. 620:118882. doi: 10.1016/j.memsci.2020.118882.
- Lopes ML, de Lima Paulillo SC, Godoy A, Cherubin RA, Lorenzi MS, Giometti HC, Bernardino CD, de Amorim Neto HB, de Amorim HV. 2016. Ethanol production in Brazil: a bridge between science and industry. Braz J Microbiol. 47(Suppl 1):64–76. doi: 10.1016/j.bjm.2016.10.003.
- Moriyama N, Nagasawa H, Kanezashi M, Tsuru T. 2022. Water permeation in gas and liquid phases through organosilica membranes: a unified theory of reverse osmosis, pervaporation, and vapor permeation. Chem Eng Sci. 263:118083. doi: 10.1016/j.ces.2022.118083.
- Muradov N. 2017. Low to near-zero CO2 production of hydrogen from fossil fuels: status and perspectives. Int J Hydro Ener. 42:14058–14088. doi: 10.1016/j.ijhydene.2017.04.101.
- Ni M, Leung DYC, Leung MKH. 2007. A review on reforming bio-ethanol for hydrogen production. Int J Hydro Ener. 32:3238–3247. doi: 10.1016/j.ijhydene.2007.04.038.
- Nikolskaya AV. 1946. The vapor pressure of ternary stratified systems. Aqueous alcohol solutions of potassium carbonate and magnesium sulfate. Zh Fiz Khim. 20:421–431
- Peters CD, Hankins NP. 2019. Osmotically assisted reverse osmosis (OARO): five approaches to dewatering saline brines using pressure-driven membrane processes. Desalination. 458:1–13. doi: 10.1016/j.desal.2019.01.025.
- Phutela RC, Kooner ZS, Fenby DV. 1979. Vapour pressure study of deuterium exchange reactions in water-ethanol systems: equilibrium constant determination. Aust J Chem. 32:2353–2359. doi: 10.1071/CH9792353.
- Renon H, Prausnitz JM. 1968. Local compositions in thermodynamic excess functions for liquid mixtures. AIChE J. 14:135–144. doi: 10.1002/aic.690140124.
- Soccol CR, de Souza Vandenberghe LP, Medeiros ABP, Karp SG, Buckeridge M, Ramos LP, Pitarelo AP, Ferreira-Leitão V, Gottschalk JMF, Ferrara MA, et al. 2010. Bioethanol from lignocelluloses: status and perspectives in Brazil. Bioresour Technol. 101:4820–4825. doi: 10.1016/j.biortech.2009.11.067.
- Togo N, Nakagawa K, Shintani T, Yoshioka T, Takahashi T, Kamio E, Matsuyama H. 2019. Osmotically assisted reverse osmosis utilizing hollow fiber membrane module for concentration process. Ind Eng Chem Res. 58:6721–6729. doi: 10.1021/acs.iecr.9b00630.
- Wang Z, Deshmukh A, Du Y, Elimelech M. 2020. Minimal and zero liquid discharge with reverse osmosis using low-salt-rejection membranes. Water Res. 170:115317. doi: 10.1016/j.watres.2019.115317.
- Wang Z, Feng D, Chen Y, He D, Elimelech M. 2021. Comparison of energy consumption of osmotically assisted reverse osmosis and low-salt-rejection reverse osmosis for brine management. Environ Sci Technol. 55:10714–10723. doi: 10.1021/acs.est.1c01638.
- Yamamoto H, Terano T, Nishi Y, Tokunaga J. 1995. Vapor-liquid equilibria for methanol + ethanol + calcium chloride, + ammonium iodide, and + sodium iodide at 298.15 K. J Chem Eng Data. 40:472–477. doi: 10.1021/je00018a026.
- Zhan X, Lu J, Tan T, Li J. 2012. Mixed matrix membranes with HF acid etched ZSM-5 for ethanol/water separation: preparation and pervaporation performance. Appl Surf Sci. 259:547–556. doi: 10.1016/j.apsusc.2012.05.167.
- Zhou H, Shi R, Jin W. 2014. Novel organic–inorganic pervaporation membrane with a superhydrophobic surface for the separation of ethanol from an aqueous solution. Sep Purif Technol. 127:61–69. doi: 10.1016/j.seppur.2014.02.032.