
 ?Mathematical formulae have been encoded as MathML and are displayed in this HTML version using MathJax in order to improve their display. Uncheck the box to turn MathJax off. This feature requires Javascript. Click on a formula to zoom.
Abstract
The article reports a new approach for flow regime (FR) identification and a modified correlation for gas holdup prediction in a bubble column (BC) (0.1 m inner diameter) operated with aqueous solutions of 2-pentanol at ambient conditions. The hydrodynamic behavior of mixtures of deionized water (DW) and 2-pentanol with different volume concentrations (0.5 − 2.0 vol.%) was examined. A new algorithm for estimation of the information amount (IA) from a gauge pressure (GP) signal is proposed. It is based on simultaneous statistical and error analyses of the sub-divided GP time series. The new approach extracts detailed hidden information from every sector of the time-dependent GP signal. In case of 0.5 vol.% 2-pentanol dissolved in DW, by means of the local well-pronounced IA minima, three transition velocities Utrans (at 0.043, 0.054 and 0.073 m/s) were reliably identified. The first critical velocity was comparable with the prediction of a well-known empirical correlation. When the volume concentration of 2-pentanol in DW was doubled, then the three Utrans values were distinguished at 0.049, 0.063 and 0.074 m/s, respectively. In addition, the end of the gas maldistribution state was identified at 0.041 m/s. It was found that the increase of the alcohol concentration affects the first and second Utrans values but not the third one, i.e. the onset of the complete foaming state. The overall gas holdups were also successfully predicted in both homogeneous and transition flow regimes of BC operation. One of the parameters (taking part in a dimensionless group about the scale effect) in an existing empirical correlation was modified in order to predict the overall gas holdups recorded in different aqueous solutions of 2-pentanol. The modified parameter was fitted for every mixture investigated. The average relative error was reasonably low in every case.
1. Introduction
Bubble columns (BCs) are being widely used in both chemical and petrochemical industries. The BC performance is characterized with complicated interactions between numerous hydrodynamic parameters. For instance, such complex interactions exist among the bubble slip velocity, radial holdup profile and internal circulation (Ranade Citation1992). One of the most complicated flow structures in the bubble bed is the internal liquid circulation due to the non-uniform radial gas holdup profile. This flow pattern is encountered in the fully developed churn-turbulent (heterogeneous) flow regime (FR).
The identification of the main transition velocities Utrans is essential for understanding the BC hydrodynamic behavior and for controlling the BC performance. In general, there are three main FRs: homogeneous, transition and heterogeneous. The mixing, mass and heat transfer coefficients depend on the prevailing FR. Hydrodynamic parameters such as overall gas holdup and bubble rise velocity also exhibit such a dependence on FR. There are no generally valid universal empirical correlations for these parameters. For every particular FR, a different correlation has been established. By using reliable methods for identification of the FR boundaries, the operating regime of the BC should be determined and then the corresponding empirical correlation should be used to derive the parameters of interest.
There are many substantial differences between homogeneous (bubbly flow) and heterogeneous (churn-turbulent flow) FRs. In the first case, small bubbles (spherical or ellipsoidal) are being formed in the bubble bed and rise rectilinearly. Bubble coalescence or liquid circulation is negligible. A narrow bubble size distribution is observed in this FR. Both the liquid velocity and gas holdup exhibit flat radial profiles and thus no liquid circulation is observed in the bubble bed. Moreover, the gas distributor (GD) plays an important role on the hydrodynamics and mixing in this FR. Many BCs operate in the homogeneous FR for biochemical applications. Usually, in the case of air–water system, the homogeneous FR is stable up to superficial gas velocities Ug of 0.04 m/s (Leonard et al. Citation2015).
On the other hand, the heterogeneous FR is characterized by a wide bubble size distribution and significant bubble coalescence and break-up phenomena. The radial profiles of both liquid velocity and gas holdup are parabolic and this causes a global macro-circulation in the bubble bed. There are two bubble classes: large spherical-cap bubbles rising in the core and small ellipsoidal bubbles rising in the annulus. Accordingly, the gas holdup structure can be subdivided into small bubble holdup and large bubble holdup (Krishna and Ellenberger Citation1996). The GD plays a negligibly small role in this FR. Many industrial BCs operate in the churn-turbulent FR since the mass transfer is enhanced in the presence of large bubbles. In most cases, the heterogeneous FR begins at Ug value of 0.06–0.07 m/s.
1.1. Previous FR identification based on different parameters
In the past, different numerical techniques have been used for FR identification in BCs. They can be grouped into the following types of analyses: statistical (Drahoš et al. Citation1991; Letzel et al. Citation1997; Nedeltchev et al. Citation2006), spectral (Letzel et al. Citation1997), fractal (Drahoš et al. Citation1992; Luewisuthichat et al. Citation1995; Briens et al. Citation1997; Maucci et al. Citation1999), chaotic (Luewisuthichat et al. Citation1996; Letzel et al. Citation1997; Johnsson et al. Citation2000; Lin et al. Citation2001; Nedeltchev et al. Citation2003, Citation2006, Citation2011) and time–frequency analysis (Bakshi et al. Citation1995; Vial et al. Citation2000). The only comparison among all these techniques has been performed by Vial et al. (Citation2000), who found that most of these methods are capable of identifying reliably only the first transition velocity, i.e. the end of the homogeneous FR. The spectral, fractal and chaos analyses are more sophisticated methods of analysis as compared to the statistical analysis. They are based on concepts with completely different physical meaning and calculation principle. Spectral analysis uses the power spectral density function; fractal analysis uses both the fractal dimension and Hurst exponent; and chaos analysis uses both correlation dimension and Kolmogorov’s entropy.
In spite of the availability of many articles focused on the identification of the boundaries of the main FRs in BCs, only one FR map has been developed by Shah et al. (Citation1982). It is valid mainly for BCs operated with an air–water system and it does not consider the GD effect. This is a serious drawback of this FR map. In fact, the GD design determines the initial bubble diameter and the height of the equilibrium zone (in which the equilibrium and stable bubble diameter is formed). In addition, the identification criterion used to derive this FR map has not been mentioned. There are two competing empirical correlations for predicting the first Utrans value (end of homogeneous FR). In case of an air–water system, the correlation of Reilly et al. (Citation1994) is more accurate, whereas in case of organic liquids the correlation of Im et al. (Citation2019) is recommendable.
Based on the previously published results, it could be concluded that several different entropies and new parameters are capable of identifying reliably the first and second Utrans values. The Kolmogorov entropy (Letzel et al. Citation1997; Nedeltchev et al. Citation2006, Citation2011) is a complicated parameter (based on multiple reconstructions of the signal) but a very reliable chaotic invariant for identification of the first Utrans value. The information entropy (Nedeltchev and Shaikh Citation2013) is also a very useful parameter for this purpose. Nedeltchev (Citation2015) has introduced the novel concept of reconstruction entropy. It was demonstrated that this parameter is capable of identifying the main Utrans values based on its calculation from photon counts recorded by means of computed tomography. All these three entropic concepts are considered generally applicable to any physically significant signal, which is sensitive enough to detect the bubble motion. In addition, Nedeltchev et al. (Citation2020) have introduced the concept of degree of randomness, which also distinguishes accurately the boundaries of the main FRs. The latest concept for FR identification in BCs is called novel hybrid index (NHI) (Nedeltchev et al. Citation2022, Citation2023). This parameter identifies accurately the two main Utrans values based on well-pronounced local minima. Comprehensive reviews on the different methods for FR identification are available in Nedeltchev and Shaikh (Citation2013) and Nedeltchev et al. (Citation2022).
In summary, most of the previous parameters are not capable of identifying all main transition velocities based on the same criterion (local minimum) and also quite often their transition results are not supported by the predictions of the most popular empirical correlations. Last but not least, there are only few studies (in addition to Nedeltchev et al. Citation2023) about the hydrodynamics of BCs operated with aqueous alcohol solutions. This topic in the field of BCs is still open for new research. Kazakis et al. (Citation2008) reported that bubble coalescence does not occur in an aqueous isobutanol solution. Besagni et al. (Citation2016) studied the hydrodynamics of BCs operated with an aqueous solution of ethanol (0.05% in mass). The authors found that the increase of the ethanol concentration in the aqueous solution increases the gas holdup and stabilizes the homogeneous FR. In addition, the bubble size and bubble size distribution are modified due to the change of the bubble properties. Gourich et al. (Citation2008) studied the gas holdup evolution as a function of Ug in aqueous solutions of propanol (0.01 and 0.05% v/v), methanol (0.05% v/v) and butanol (0.05% v/v). The mass transfer coefficients have been also analyzed.
The first objective of this article is to propose a new reliable method for identification of the main Utrans values in a BC of 0.1 m inner diameter operated with a mixture of deionized water (DW) and 2-pentanol system and aerated with air at ambient conditions. This new method is capable of extracting useful transition information even when the bubbles are small and the pressure fluctuations are not very intensive. Under these conditions, for instance the NHI experiences difficulties to identify clearly the main Utrans values. A comparison with some reliable empirical predictions will be also performed.
1.2. Prediction of gas holdups in various BCs operated with different systems
Most of the correlations for gas holdup prediction are well summarized in Wilkinson et al. (Citation1992) and Kemoun et al. (Citation2001). It is clear that numerous correlations have been developed for different gas–liquid systems. There is no universal correlation for prediction of gas holdups at all operating conditions (or all FRs) and in all gas–liquid systems. For instance, most of the correlations have not been tested in foaming systems. Other important correlations derived for pure organic liquids, which are not reported in the above-mentioned review articles, are the ones of Jordan and Schumpe (Citation2001) and the semi-empirical approach of Nedeltchev and Schumpe (Citation2008), which is explicitly valid in the homogeneous FR. These approaches also do not take into account the foaming process.
In addition to the prediction of the overall gas holdups, empirical correlations have been proposed for the prediction of the radial gas holdup profile (Wu and Al-Dahhan Citation2001) responsible for the occurrence of the liquid circulation and transitional gas holdups (Reilly et al. Citation1994; Im et al. Citation2019). All these correlations have not been applied to aqueous solutions of alcohols.
The second objective in this work is to predict the overall gas holdups in the mixture of DW and 2-pentanol (at various volume concentrations) aerated with air at ambient conditions. Such a gas holdup correlation in a foaming system is not available in the BC literature hitherto. Most of the reported empirical correlations lead to considerable deviations in this system, so an important modification in one of the correlations will be introduced. The reliable prediction of the gas holdups is very important for the successful BC design and scale-up.
2. Information Amount (IA) Algorithm Based on a Modified Error Analysis
Many different methods have been developed for FR identification in BCs. These methods work well for an air–water system since the mean bubble diameters are around 4 mm and the bubbles generate detectable and intensive fluctuations. In case of bubbles smaller than 4 mm (like in foaming systems), the previous methods are facing some challenges. Later in the article will be demonstrated that our previously developed method (NHI) cannot identify the main transition velocities in aqueous solutions of 2-pentanol (0.5 vol.% and 1.0 vol.%). That is why, especially for these cases a new more advanced approach is needed. The new original algorithm for extraction of the IA from the pressure signal will be described in this section.
None of the previous identification methods was based on a detailed error analysis. Since they were applied predominantly to air–water system, the bubbles were relatively big and their pressure fluctuations were generating enough statistical information. When the system is foaming and consists of very small bubbles then the average absolute deviation (AAD) is a too simple statistical parameter to distinguish the flow pattern changes. So, in this work, it will be demonstrated that the average relative errors (AREs) extracted from a statistical information (local AADs) from a gauge pressure (GP) signal could provide a very useful information about the FR identification. In principle, the distribution of the errors in a time-dependent GP signal is considered to be a stochastic phenomenon. The first step is to subdivide the measured GP signal (consisting of 10,000 points) into different intervals (consisting of 1000 points). Then, the local AAD in each interval is calculated. AAD is a robust statistical estimator of the data width around the signal’s mean. In the next step, the local ARE is calculated for every interval as well as the mean ARE (based on all 10 local values). The GP signal was measured in mbar and in order to render it dimensionless the summed AAD was divided by 100 mbar since this is the maximum value that could be measured at an axial position of 0.65 m in most of the lab-scale BCs. The summed ARE (in percentage) was rendered dimensionless by dividing it by 100. So, the dimensionless ratio of summed ARE to summed AAD was used for calculating the IA. The IA algorithm could be summarized as follows:
(1)
(1)
where N is the total number of points (10,000 in this work) in the fluctuating pressure signal. The index j corresponds to the number of the interval selected. It varies from 1 to 10.
The modified local ARE is defined (Wilkinson et al. Citation1992) as follows:
(2)
(2)
where M is the total number of pre-selected intervals (10 in this work) in the GP signal.
The new dimensionless ratio has the meaning of probability (that the total AAD would become equal to the total ARE) and it is formulated as follows:
(3)
(3)
The probability P takes into account not only the error analysis but also the statistical analysis of the pressure data. According to the information entropy theory (Nedeltchev et al. Citation1999), the IA can be defined as follows:
(4)
(4)
The IA varies between 0 and 1 bit. Minimum IA means that the information adding (gain) is the lowest (since the regime transition in that Ug range is not surprising) and the behavior of the GP signal is more predictable and more uniformly distributed in all intervals. This means that a minimum amount of information is needed to predict the behavior of the gas–liquid system over the entire time series interval. Such a system is called a dissipative ordered system. On the contrary, maximum IA means that the information adding is the highest and the behavior of the GP signal is less predictable and less uniformly distributed in all intervals. This means that a maximum amount of information is needed to predict the behavior of the gas–liquid system over the entire time series interval. In other words, the behavior of the system is surprising and almost unpredictable. Such a system is called stochastic.
The IA is related to the average amount of information conveyed by an event (for instance, regime transition), when considering all possible outcomes expressed in terms of probabilities. It measures the expected (i.e. average) amount of information obtained by measuring some representative signal. The IA could be interpreted as a measure of how informative the average outcome of a monitored event is. The IA definition is based on the probability distribution when observing a regime transition. In case of a highly likely event, very little amount of new information is obtained and vice versa. Uniform probability yields maximum uncertainty and therefore maximum IA. On the contrary, when the IA is zero, then there is no uncertainty at all. When the regime transition is approaching, the flow pattern becomes better ordered (Letzel et al. Citation1997), the local AAD values become lower and thus the probability for a surprising outcome in the BC behavior becomes lower. According to EquationEq. (4)(4)
(4) , this leads to a local IA minimum. The better ordered gas–liquid dispersion is characterized with lower degree of chaos (lower entropy) and more uniform pressure signal. The IA of a system can also be interpreted as the amount of “missing” information needed to determine a local state in the behavior of the system provided that the global state is known.
3. Experimental Setup and Measurement Technique
Gauge pressure (GP) measurements were performed in a BC of 0.1 m inner diameter operated with an air and a mixture of DW and 2-pentanol with different volumetric concentrations (0.5, 1.0, 1.5 and 2.0 vol.%). The DW conductivity has varied in the range 0.7–2.5 µS/cm. The GP transducer (type PR-33X, range: 0–1 bar) was manufactured by Keller AG (Winterthur, Switzerland). It was flush mounted at the wall at an axial position of 0.65 m above the GD. This axial position was strategically selected in order to make sure that the pressure sensor is positioned above the equilibrium zone and in the fully developed region of the column. The BC was equipped with a perforated plate GD (96 orifices × ∅ 1 mm, open area: 0.96%). The perforated plate GD layout is schematically illustrated in Nedeltchev et al. (Citation2022). Photos of the column’s bottom (including the gas chamber below the GD) and the formed gas maldistribution in the vicinity of the GD are shown later in this article in Section 4.
Since the BC (made of PA) was transparent, the experimental overall gas holdups were estimated from the classical equation based on the aerated bed height L and clear liquid height L0: (L – L0)/L. In all experiments, the clear liquid height L0 was set at 1.1 m. After every two runs, the initial clear liquid height was carefully checked for potential liquid losses (e.g. caused by evaporation). The experimental error in the gas holdup measurements was always less than 5%.
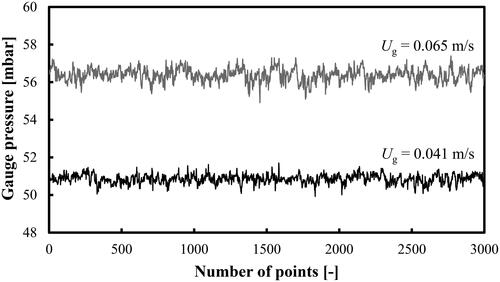
Superficial gas velocities Ug in the range 0.03–0.085 m/s were studied. The data were always recorded from the highest Ug value down to the lowest one in order to minimize the effect of a potential alcohol evaporation on the raw pressure data and gas holdups. The GP fluctuations at two different Ug values in an aqueous solution of 2-pentanol (0.5 vol.%) in both the homogeneous and heterogeneous FRs are shown in . For better illustration of the pressure time series, only 3000 points are included in the figures. They correspond to a time span from 0 to 91 s.
Figure 1. GP fluctuations in an aqueous solution of 2-pentanol (0.5 vol.%) at two Ug values.
The physicochemical properties of the aqueous solutions of 2-pentanol are listed in . We have measured them at the beginning and end of the measurement campaign and since the differences were negligibly small, mean values were taken for the empirical gas holdup calculations.
Table 1. Physicochemical properties of the various mixtures of DW and 2-pentanol.
4. Results and Discussion
4.1. FR identification in a BC operated with different mixtures of DW and 2-pentanol
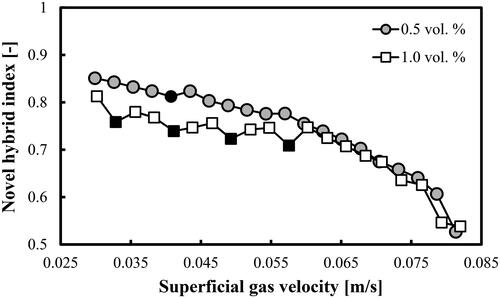
The topic of FR identification in aqueous solutions of alcohols is not very well studied. For instance, in the latest review article (Leonard et al. Citation2015) on BCs, the effect of the addition of alcohols to water on the regime boundaries is not considered. Due to the formation of numerous small bubbles and especially formation of a foaming layer in the bubble bed, it is not clear whether only the three main FRs (like in the air–water system) exist or some sub-regimes could also be identified. It was found that our previously developed FR identifier (NHI) at alcohol concentrations less than 1.0 vol.% is not capable of identifying distinctly the boundaries of the main FRs. shows that in the case of a mixture of DW and 2-pentanol (0.5 vol.%) no well-pronounced minima could be detected. Only at Ug = 0.041 m/s, a small NHI minimum (marked by a filled circle) is observed, which is supposed to identify the end of the homogeneous FR. The other boundaries cannot be clearly distinguished in . When the volume concentration of 2-pentanol in DW is increased to 1.0%, then four local minima (at Ug = 0.033, 0.041, 0.049 and 0.058 m/s) are observed. However, the first, third and fourth ones are based on single points, which could be also interpreted as random deviations. It can be concluded that for 2-pentanol concentrations ≤1.0 vol.% a new more sensitive and sophisticated parameter is needed.
Figure 2. NHI profiles as a function of Ug in a BC operated with a mixture of DW and 2-pentanol (0.5 vol.% and 1.0 vol.%) aerated with a compressed air.
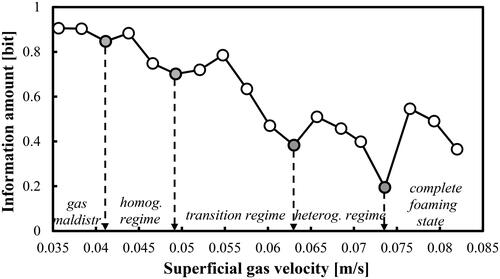
In this work, the boundaries of the main FRs were successfully identified by means of the IA algorithm (see Section 2). shows that in the case of aqueous solution of 2-pentanol (0.5 vol.%), the IA profile is capable of identifying the three main transition velocities Utrans based on well-pronounced local minima at Ug = 0.043, 0.054 and 0.073 m/s, respectively. They correspond to critical Reynolds numbers of 5033.80, 6288.80 and 8478.90. The IA minima can be interpreted as the minimum adding (gain) of information since the transition is an expected and predictable event. For instance, the first transition velocity at Ug = 0.043 m/s coincides practically with the one (0.046 m/s) predicted by the empirical correlation of Im et al. (Citation2019). Nedeltchev et al. (Citation2020) have also reported a main transition velocity of 0.040 m/s but in the case of air–water system. The interpretation of the IA minimum as an indication of regime transition is in agreement with the concept of transition put forward by Letzel et al. (Citation1997). According to these authors, the main transition (end of homogeneous FR) is characterized with a minimum Kolmogorov entropy, which means minimum information loss or gain (depending on the viewpoint). Such a condition is typical for a well ordered signal or dispersed system. According to these authors at the first transition velocity, some reorganization (establishment of a better order) of the system takes place before again a more chaotic behavior occurs. In , the first critical Ug value identifies the end of the homogeneous FR, the second critical Ug value distinguishes the end of the transition FR and the third one identifies the onset of the complete foaming state in the bubble bed. From an industrial viewpoint, the second transition velocity is the most important one since many BC applications in the chemical industry are performed in the heterogeneous FR. Under the conditions of complete foaming state, it was visually observed that numerous small bubbles occupied completely the upper zone of the bubble bed. No gross circulations were observed and the entire upper zone was moving up and down like a piston. In addition, the overall gas holdups become higher than 0.35. These high gas holdups are an indication for the presence of many small bubbles. The reliable identification of the three main Utrans values in the aqueous solution of 2-pentanol (0.5 vol.%) is very important for the understanding of the onset of the complete foaming state in this specific gas–liquid system.
Figure 3. FR identification based on the information amount in a BC operated with a mixture of DW and 2-pentanol (0.5 vol.%) aerated with a compressed air.
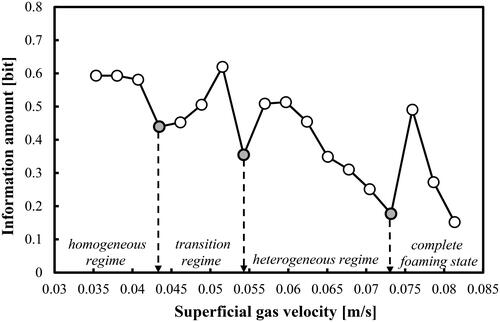
In the case of the first and third transition velocities the local IA minima are formed by several points (not by a single randomly deviating point). This renders the new FR identifier as a very reliable parameter for determining the FR boundaries. Below Ug = 0.035 m/s, a gas maldistribution process was observed as demonstrated by Nedeltchev et al. (Citation2020).
The profile of the gas holdups (calculated based on a removal of the foaming layer height from L) confirms the correct identification of the first and last Utrans values. shows that at Ug = 0.043 m/s the transitional gas holdup has a value of 0.139, which practically coincides with the transitional gas holdup (0.144) predicted by the correlation of Im et al. (Citation2019). In addition, at this Utrans value the gas holdup changes its rate of increase. So, the results from and are in agreement with the value of the first transition velocity.
Figure 4. Gas holdup (based on a removal of the foaming layer height) profile as a function of Ug in a mixture of DW and 2-pentanol (0.5 vol.%) aerated with a compressed air.
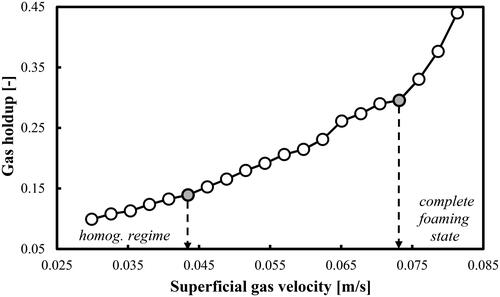
At Ug = 0.073 m/s, the gas holdups start suddenly to increase at a much faster rate and this fact is associated with the formation of the complete foaming state especially in the upper zone of the column. So, again the results from and about the last transition velocity (onset of complete foaming state) are in full agreement. The three transitional gas holdups corresponding to the main transitional velocities identified in are as follows: 0.139, 0.191 and 0.296, respectively.
shows that in the case of higher volume concentration (1.0 vol.%) of 2-pentanol in DW based on the local well-pronounced IA minima three main Utrans values (at 0.049, 0.063 and 0.074 m/s) could be identified. They correspond to critical Reynolds numbers of 5626.20, 7197.4 and 8403.30, respectively. In addition, at Ug = 0.041 m/s, the end of the gas maldistribution is observed.
Figure 5. FR identification based on the information amount in a BC operated with a mixture of DW and 2-pentanol (1.0 vol.%) and aerated with a compressed air.
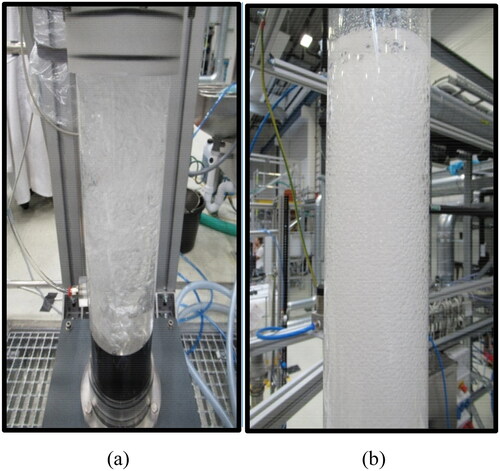
exhibits that at very low Ug values always one part of the GD is malfunctioning, i.e. some orifices are not forming bubbles. The homogeneous FR ends at Ug = 0.049 m/s. This critical value is close to the prediction (0.044 m/s) of Im et al. (Citation2019). Such an upper limit (0.05 m/s) of the homogeneous FR has been reported by Letzel et al. (Citation1997) and Medjiade et al. (Citation2017) but in the case of an air–water system. Up to Ug = 0.063 m/s prevails the transition FR and then it transforms itself into a heterogeneous FR. Such a transition gas velocity (0.062 m/s) has been reported by Deckwer et al. (Citation1973) in the case of two BCs equipped with a glass sintered plate as a GD. The gas–liquid system was not specified in their article. A well pronounced local IA minimum at Ug = 0.073 m/s distinguishes the onset of the complete foaming state. This condition is illustrated in . The gas holdups are very high (over 0.30) and only foaming process (numerous small bubbles) is observed without any gross circulation in the bubble bed.
Figure 6. Illustration of: (a) the gas maldistribution (at Ug = 0.035 m/s) and (b) complete foaming state (at Ug = 0.076 m/s) in DW and 2-pentanol (1.0 vol.%) system aerated with air at ambient conditions.
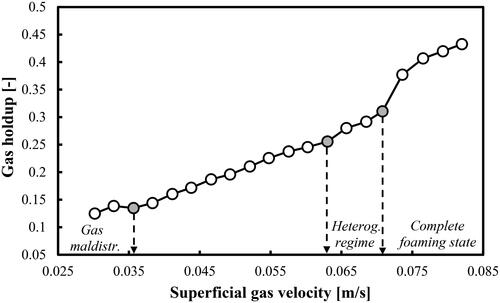
The gas holdups (without considering the foaming layer height) corresponding to a mixture of DW and 2-pentanol (1.0 vol.%) are shown in . In principle, the gas holdup profile cannot be used alone for FR identification due to its low sensitivity to the specific changes in the flow pattern. The change of the rate of increase of the gas holdup could be the criterion for FR transition. shows that the rate of increase changes at Ug = 0.036, 0.063 and 0.071 m/s, respectively. In comparison with the results in , only the first Utrans value is somewhat lower. The other two Utrans values are practically the same. The boundary between the homogeneous FR and transition FR cannot be distinguished from the gas holdup profile shown in . This fact demonstrates the advantage of the IA algorithm and its results (see ). The three transitional gas holdups corresponding to the main transitional velocities identified in are as follows: 0.196, 0.256 and 0.377, respectively.
Figure 7. Gas holdup (based on a removal of the foaming layer height) profile as a function of Ug in a mixture of DW and 2-pentanol (1.0 vol.%) aerated with air.
In summary, the new IA algorithm should be applied at alcohol concentrations less than 1.0 vol.% since in that range the NHI parameter (based on GP time series) is not sensitive enough.
4.2. Prediction of overall gas holdups in a BC operated with different mixtures of DW and 2-pentanol
All overall gas holdups that will be presented in this section belong to the homogeneous and transition FRs since their dependence on Ug values is characterized with an exponent higher than 1.0. According to Shah et al. (Citation1982), this is typical for these two main FRs.
The overall gas holdups will be predicted by means of a modification of the dimensionless empirical correlation of Sotelo et al. (Citation1994). The original correlation reads as:
(5)
(5)
where d in the original correlation is meant to be the orifice diameter of the GD and D is the column diameter. Except for d and D, the overall gas holdup depends on Ug and physicochemical properties of both phases (see EquationEq. (5)
(5)
(5) ). The second dimensionless group on the right-hand side of EquationEq. (5)
(5)
(5) is the Morton number. In fluid dynamics, the Morton number is a dimensionless number used together with the Bond number to characterize the shape of bubbles or drops moving in a surrounding fluid or a continuous phase.
In this work except for the IA algorithm and the results based on it, the additional originality is that d is set as the only fitting parameter in EquationEq. (5)(5)
(5) since this approach improves substantially the gas holdup predictions. In other words, the last dimensionless ratio on the right-hand side of EquationEq. (5)
(5)
(5) is defined in a new way. It is expected that d is related to the maximum bubble size in the dispersion. In the case of aqueous solutions of alcohols, EquationEq. (5)
(5)
(5) cannot be applied directly with d as an orifice diameter since the ARE is 25.52% and the maximum relative error (MRE) is 36.63%, which is not acceptable. In the following figures, the bad predictions of the original EquationEq. (5)
(5)
(5) are also presented. When d is fitted, then both errors become much lower: ARE = 2.12% and MRE = 6.25%. This approach is promising since all exponents of the dimensionless groups remain intact and some analogies with pure organic liquids could be drawn. This particular correlation (EquationEq. 5
(5)
(5) ) was selected since all other empirical correlations (summarized in Wilkinson et al. Citation1992; Kemoun et al. Citation2001) lead to substantial errors and EquationEq. (5)
(5)
(5) could be easily modified by changing the meaning of only one parameter. The correlation of Sotelo et al. (Citation1994) was originally developed for the systems air/CO2–H2O/ethanol/saccharose/glycerin, column diameters D of 0.04 and 0.08 m, clear liquid heights 1.5–2.0 m and porous gas diffusers (30, 65 and 150 µm). Ambient pressure was only used.
show that in the case of volumetric concentrations up to 2.0% of 2-pentanol in DW, the predicted gas holdups by means of the modified EquationEq. (5)(5)
(5) with a fitting parameter d that takes different values compare very well with the experimental values. The predictions of the original correlation of Sotelo et al. (Citation1994) are more than 20% higher (see the grey line in each figure). Both the d and MRE values are shown in . In the case of mixture of DW and 2-pentanol (0.5 vol.%), the mean d value (7.48 × 10⁻³ m) is very close to the prediction of the maximum bubble diameter (7.21 × 10⁻³ m) by the correlation of Mersmann (Citation1978).
Figure 8. Prediction of overall gas holdups in a BC operated with a mixture of DW and 2-pentanol (0.5 vol.%) and aerated with a compressed air. Mean d value was fitted at 7.48 × 10⁻³ m.
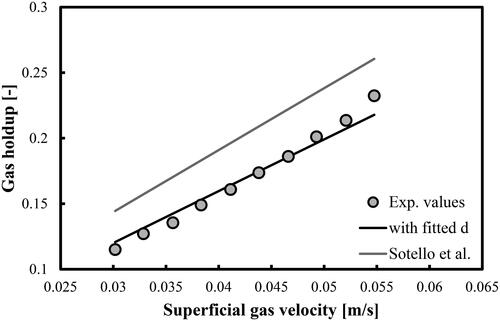
Figure 9. Prediction of overall gas holdups in a BC operated with a mixture of DW and 2-pentanol (1.0 vol.%) and aerated with a compressed air. Mean d value was fitted at 8.96 × 10⁻³ m.
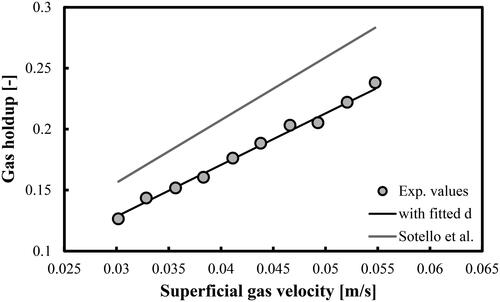
Figure 10. Prediction of overall gas holdups in a BC operated with a mixture of DW and 2-pentanol (1.5 vol.%) and aerated with a compressed air. Mean d value was fitted at 1.53 × 10⁻² m.
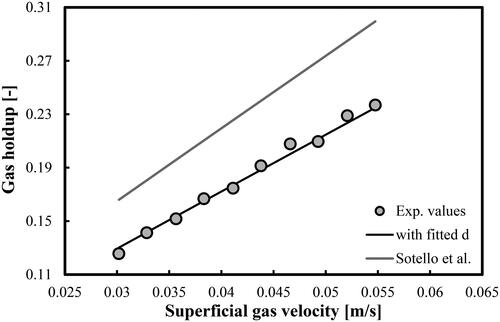
Figure 11. Prediction of overall gas holdups in a BC operated with a mixture of DW and 2-pentanol (2.0 vol.%) and aerated with a compressed air. Mean d value was fitted at 2.214 × 10⁻² m.
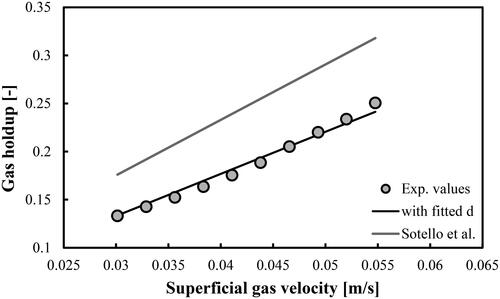
Table 2. Values of d and MRE for the various mixtures studied.
In summary, the modified correlation proposed by Sotelo et al. (Citation1994) is capable of predicting the overall gas holdups in aqueous solutions of 2-pentanol (at volumetric concentrations up to 2.0 vol.%). The authors argue that their original empirical dimensionless correlation is valid for air–ethanol system and porous gas spargers (30, 60 and 150 µm). In this work, we found that for DW-2-pentanol mixtures aerated with perforated plate GD the correlation should be modified and then it could be successfully applied as well.
More research about the physical meaning of d is needed; however, there are some indications that it might be associated with the maximum or initial bubble diameter. The latter is a function of the orifice diameter, so it might turn out that only the constant in EquationEq. (5)(5)
(5) is being changed. For the practitioners, it is enough to have the fitted d values and then to apply the modified EquationEq. (5)
(5)
(5) to their operating conditions. There are no correlations for estimation of the Sauter mean bubble diameter, maximum bubble size or initial bubble size in foaming aqueous solutions of alcohols.
The overall gas holdups could be also correlated directly to Ug values: εG = 5.576Ug1.087. This simple correlation is valid for all gas holdups reported in . The exponent is higher than 1.0 as expected in the homogeneous and transition FRs (Shah et al. Citation1982). The main disadvantage of such a simple direct fitting is that the physicochemical properties of both phases (in terms of dimensionless numbers) are not considered, which is a serious limitation. It is expected that once the alcohol type is changed, both the constant and the exponent will change, as well. Moreover, the ARE in this approach is 3.52% (for 40 points) and the deviations are higher than the predictions exhibited in . MRE is equal to 9.86%. The errors of the three approaches are summarized in . In all three approaches, 40 points were used. The comparison is in favor of the new approach based on the modified empirical correlation of Sotelo et al. (Citation1994) with a fitted parameter d (assumed to be proportional to the maximum bubble diameter).
Figure 12. Variations of overall gas holdups as a function of Ug in a BC operated with different mixtures of DW and 2-pentanol and aerated with a compressed air.
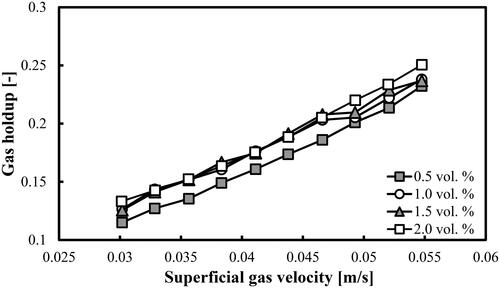
Table 3. Comparison of the errors among the different approaches.
shows the variations of the experimental overall gas holdups as a function of Ug in different mixture of DW and 2-pentanol. The various volume concentrations of 2-pentanol are exhibited in the legend. Only one clear trend can be distinguished. The overall gas holdups at the lowest volume concentration of alcohol are the lowest. Beyond Ug = 0.047 m/s seems that the overall gas holdup increases with the increase of the volume concentration of 2-pentanol.
5. Conclusions
In this work, a new approach for FR identification was presented. It was based on sub-division of the pressure signal into different intervals and calculating the local AAD and ARE values for each interval. Based on them the IA was extracted. This new parameter is capable of identifying successfully the three main transition velocities. The new approach should be applied at low concentrations (less than 1.0 vol.%) of alcohol (2-pentanol) since the NHI algorithm is not sensitive enough in this range.
In the second part of this work, the overall gas holdups in the homogeneous and transition FRs were predicted by means of the modified empirical correlation of Sotelo et al. (Citation1994). Only one parameter was fitted in order to predict successfully the experimental gas holdup data. The predictions were very good (ARE = 2.12%). The fitting parameter increased slightly up to volume concentration of 1.0 vol.% of 2-pentanol in DW. However, beyond this critical value the fitting parameter started to increase steeply with the volume concentration of 2-pentanol in DW. This trend is very interesting and would help to reveal in the near future the physical meaning of the fitting parameter. For this purpose, a reliable correlation for estimation of the mean bubble diameter in foaming aqueous solutions of alcohols is needed.
| Abbreviations | ||
| BC | = | bubble column |
| DW | = | deionized water |
| FR | = | flow regime |
| GD | = | gas distributor |
| GP | = | gauge pressure |
| MRE | = | maximum relative error |
| Nomenclature | ||
| AAD | = | average absolute deviation (mbar) |
| ARE | = | average relative error (%) |
| d | = | fitting parameter in EquationEq. (5) |
| D | = | column diameter (m) |
| IA | = | information amount (bit) |
| L | = | aerated liquid height (m) |
| L0 | = | clear liquid height (m) |
| M | = | number of pre-selected intervals (−) |
| N | = | number of points in the signal (−) |
| P | = | probability based on a new definition (−) |
| Ug | = | superficial gas velocity (m/s) |
| Utrans | = | transitional velocity (m/s) |
| x | = | point in the pressure signal (mbar) |
| Greek symbols | ||
| εG | = | gas holdup (−) |
| µG | = | dynamic viscosity of gas (Pa s) |
| µL | = | dynamic viscosity of liquid (Pa s) |
| ρG | = | gas density (kg/m3) |
| ρL | = | liquid density (kg/m3) |
| σL | = | liquid surface tension (N/m) |
| Subscripts | ||
| i | = | number of a particular point in the time series |
| j | = | number of preselected interval consisting of 1000 points |
| mean | = | mean value of a parameter |
Acknowledgments
The authors are thankful to Mr. Michael Knobel for evaluating the physicochemical properties of the aqueous solutions of 2-pentanol.
Additional information
Funding
References
- Bakshi BR, Zhong H, Jiang P, Fan L-S. 1995. Analysis of flow in gas–liquid bubble columns using multi-resolution methods. Trans Inst Chem Eng A Chem Eng Res Des. 73:608–614.
- Besagni G, Inzoli F, De Guido G, Pellegrini LA. 2016. Experimental investigation on the influence of ethanol on bubble column hydrodynamics. Chem Eng Res Des. 112:1–15. doi: 10.1016/j.cherd.2016.06.009.
- Briens LA, Briens CL, Hay J, Hudson C, Margaritis A. 1997. Hurst’s analysis to detect minimum fluidization and gas maldistribution in fluidized beds. AIChE J. 43:1904–1908. doi: 10.1002/aic.690430725.
- Deckwer W, Graeser U, Langemann H, Serpemen Y. 1973. Zones of different mixing in the liquid phase of bubble columns. Chem Eng Sci. 28:1223–1225. doi: 10.1016/0009-2509(73)85031-6.
- Drahoš J, Bradka F, Punčochář M. 1992. Fractal behaviour of pressure fluctuations in a bubble column. Chem Eng Sci. 47:4069–4075. doi: 10.1016/0009-2509(92)85158-8.
- Drahoš J, Zahradník J, Punčochář M, Fialová M, Bradka F. 1991. Effect of operating conditions of the characteristics of pressure fluctuations in a bubble column. Chem Eng Process. 29:107–115. doi: 10.1016/0255-2701(91)87019-Y.
- Gourich B, Vial C, Azher NE, Soulami MB, Ziyad M. 2008. Influence of hydrodynamics and probe response on oxygen mass transfer measurements in a high aspect ratio bubble column reactor: effect of the coalescence behavior of the liquid phase. Biochem Eng J. 39:1–14. doi: 10.1016/j.bej.2007.08.011.
- Im H, Park J, Lee JW. 2019. Prediction of main regime transition with variations of gas and liquid phases in a bubble column. ACS Omega. 4:1329–1343. doi: 10.1021/acsomega.8b02657.
- Johnsson F, Zijerveld RC, Schouten JC, Van den Bleek CM, Leckner B. 2000. Characterization of fluidization regimes by time series analysis of pressure fluctuations. Int J Multiphase Flow. 26:663–715. doi: 10.1016/S0301-9322(99)00028-2.
- Jordan U, Schumpe A. 2001. The gas density effect on mass transfer in bubble columns with organic liquids. Chem Eng Sci. 56:6267–6272. doi: 10.1016/S0009-2509(01)00255-X.
- Kazakis NA, Mouza AA, Paras SV. 2008. Coalescence during bubble formation at two neighbouring pores: an experimental study in microscopic scale. Chem Eng Sci. 63:5160–5178. doi: 10.1016/j.ces.2008.07.006.
- Kemoun A, Ong BC, Gupta P, Al-Dahhan MH, Dudukovic MP. 2001. Gas holdup in bubble columns at elevated pressure via computed tomography. Int J Multiphase Flow. 27:929–946. doi: 10.1016/S0301-9322(00)00037-9.
- Krishna R, Ellenberger J. 1996. Gas holdup in bubble column reactors operating in the churn-turbulent flow regime. AIChE J. 42:2627–2634. doi: 10.1002/aic.690420923.
- Leonard C, Ferrasse J-H, Boutin O, Lefevre S, Viand A. 2015. Bubble column reactors for high pressures and high temperatures operation. Chem Eng Res Des. 100:391–421. doi: 10.1016/j.cherd.2015.05.013.
- Letzel HM, Schouten JC, Krishna R, Van den Bleek CM. 1997. Characterization of regimes and regime transitions in bubble columns by chaos analysis of pressure signals. Chem Eng Sci. 52:4447–4459. doi: 10.1016/S0009-2509(97)00290-X.
- Lin T-J, Juang R-C, Chen Y-C, Chen C-C. 2001. Predictions of flow transitions in a bubble column by chaotic time series analysis of pressure fluctuation signals. Chem Eng Sci. 56:1057–1065. doi: 10.1016/S0009-2509(00)00322-5.
- Luewisuthichat W, Tsutsumi A, Yoshida K. 1995. Fractal analysis of particle trajectories in three-phase systems. Trans Inst Chem Eng A Chem Eng Res Des. 73:222–227.
- Luewisuthichat W, Tsutsumi A, Yoshida K. 1996. Deterministic chaos analysis of particle dynamics in three-phase systems. J Chem Eng Japan. 29:675–682. doi: 10.1252/jcej.29.675.
- Maucci E, Briens CL, Martinuzzi RJ, Wild G. 1999. Detection and characterization of piston flow regime in three-phase fluidized beds. Powder Technol. 103:243–259. doi: 10.1016/S0032-5910(99)00035-2.
- Medjiade WT, Alvaro AR, Schumpe A. 2017. Flow regime transitions in a bubble column. Chem Eng Sci. 170:263–269. doi: 10.1016/j.ces.2017.04.010.
- Mersmann A. 1978. Design and scale-up of bubble and spray columns. German Chem Eng. 1:1–11.
- Nedeltchev S, Katerla J, Basiak E. 2022. Novel hybrid methods for identifying the main transition velocities in various bubble columns. J Chem Eng Japan. 55:201–216. doi: 10.1252/jcej.21we082.
- Nedeltchev S, Kumar SB, Dudukovic MP. 2003. Flow regime identification in a bubble column based on both Kolmogorov entropy and quality of mixedness derived from CARPT data. Can J Chem Eng. 81:367–374. doi: 10.1002/cjce.5450810305.
- Nedeltchev S, Marchini S, Schubert M, Hlawitschka MW, Hampel U. 2023. Novel identifier of transitions in bubble columns operated with water and aqueous alcohol solutions. Chem Eng Technol. 46:1782–1790. doi: 10.1002/ceat.202300095.
- Nedeltchev S, Ookawara S, Ogawa K. 1999. A fundamental approach to bubble column scale-up based on quality of mixedness. J Chem Eng Japan. 32:431–439. doi: 10.1252/jcej.32.431.
- Nedeltchev S, Schumpe A. 2008. A new approach for the prediction of gas holdup in bubble columns operated under various pressures in the homogeneous regime. J Chem Eng Japan. 41:744–755. doi: 10.1252/jcej.08we005.
- Nedeltchev S, Shaikh A, Al-Dahhan M. 2011. Flow regime identification in a bubble column via nuclear gauge densitometry and chaos analysis. Chem Eng Technol. 34:225–233. doi: 10.1002/ceat.201000308.
- Nedeltchev S, Shaikh A, Al-Dahhan MH. 2006. Flow regime identification in a bubble column based on both statistical and chaotic parameters applied to computed tomography data. Chem Eng Technol. 29:1054–1060. doi: 10.1002/ceat.200600162.
- Nedeltchev S, Shaikh A. 2013. A new method for identification of the main transition velocities in multiphase reactors based on information entropy theory. Chem Eng Sci. 100:2–14. doi: 10.1016/j.ces.2013.03.039.
- Nedeltchev S, Top Y, Hlawitschka M, Schubert M, Bart H-J. 2020. Identification of the regime boundaries in bubble columns based on the degree of randomness into the signals. Can J Chem Eng. 98:1607–1621. doi: 10.1002/cjce.23719.
- Nedeltchev S. 2015. New methods for flow regime identification in bubble columns and fluidized beds. Chem Eng Sci. 137:436–446. doi: 10.1016/j.ces.2015.06.054.
- Ranade VV. 1992. Flow in bubble columns: some numerical experiments. Chem Eng Sci. 47:1857–1869. doi: 10.1016/0009-2509(92)80304-U.
- Reilly IG, Scott DS, De Bruijn TJW, MacIntyre D. 1994. The role of gas phase momentum in determining gas holdup and hydrodynamic flow regimes in bubble column operations. Can J Chem Eng. 72:3–12. doi: 10.1002/cjce.5450720102.
- Shah YT, Kelkar BG, Godbole SP, Deckwer W-D. 1982. Design parameters estimations for bubble column reactors. AIChE J. 28:353–379. doi: 10.1002/aic.690280302.
- Sotelo JL, Benitez FJ, Beltran-Heredia J, Rodriguez C. 1994. Gas holdup and mass transfer coefficients in bubble columns. 1. Porous plate diffusers. Int Chem Eng. 34:82–91.
- Vial C, Camarasa E, Poncin S, Wild G, Midoux N, Bouillard J. 2000. Study of hydrodynamic behaviour in bubble columns and external loop airlift reactors through analysis of pressure fluctuations. Chem Eng Sci. 55:2957–2973. doi: 10.1016/S0009-2509(99)00551-5.
- Wilkinson PM, Spek AP, Van Dierendonck LL. 1992. Design parameters estimation for scale-up of high-pressure bubble columns. AIChE J. 38:544–554. doi: 10.1002/aic.690380408.
- Wu Y, Al-Dahhan MH. 2001. Prediction of axial liquid velocity profile in a bubble column. Chem Eng Sci. 56:1127–1130. doi: 10.1016/S0009-2509(00)00330-4.