
ABSTRACT
Increasingly, mathematics educators see the importance of representation of diversity in pedagogical texts. The number of identity markers often considered has increased over the previous half century, and now includes, for instance, gender, class, ethnicity, religion, functionality, and sexual orientation. We investigate representation of different identity markers in Norwegian mathematics exams in compulsory school (Grunnskolen) during the period 1962–2020. Through a quantitative content analysis of 1514 exam tasks, we gain a detailed picture of change over time. Representation in Norwegian examination tasks has improved gradually over the past half century. While representation of girls approached 50% in the 1980s, people with non-stereotypical Scandinavian names or appearances (non-white) were in the single digits until the 2000s. However, it appears that inclusion has been selective, and that some groups are still invisible. There are no clear examples of homosexuality and only two of explicitly disabled people in our material.
Introduction
Ensuring diversity among students and supporting their identity as mathematics learners are pressing concerns in mathematics education. Scholars have pursued these challenges using various frameworks, such as culturally responsive pedagogy, which aims to establish an inclusive and culturally relevant learning environment (Ladson-Billings, Citation2014). Studies on students’ identities have demonstrated how cultural discourses and small-scale events may influence their positioning as mathematics learners (Foyn, Citation2021; Solomon, Citation2009).
A crucial aspect of mathematics education that requires ongoing investigation is the representation of diversity and identity in pedagogical materials (Norén & Caligari, Citation2020; Rubel & McCloskey, Citation2021). The significance of representation extends beyond seeing oneself reflected in educational materials to developing an appreciation and understanding of diversity in society. In recent years, researchers have examined how identity markers such as gender, class, ethnicity, religion, functionality, and sexual orientation are represented in mathematics educational materials (for instance, Parise, Citation2021).
Despite the importance of mathematics examination tasks in teaching, little research has focused on how diversity and identity markers are incorporated into these critical pedagogical materials. Examining mathematics exams over time provides a distinctive opportunity to observe how society’s emphasis on diversity has been integrated into these texts. Through an analysis of the evolution of diversity and representation in mathematics exams, this study offers insights into how mathematics education can become more inclusive and culturally responsive.
Background
In Norway since 1962, students have taken national written exams at the end of 9 – or, from 1997, 10 – years of schooling, after the expansion of compulsory school from seven to nine years in 1960.Footnote1 These exams constitute a continuous series that may provide insight into different aspects of the subject of mathematics. In earlier investigations, we documented the important changes made to these exams over time, demanding greater skills in language, use of tools, and handling of task formats and information presented in different ways (Smestad & Fossum, Citation2019). Exams can also provide fruitful material for considering identity markers.
School and society have also changed profoundly in the period from 1962 to today. To give three examples: in 1962, women comprised less than one-quarter of the working population (Statistisk sentralbyrå, Citation1963, p. 17), only 15,293 foreigners worked in Norway (Statistisk sentralbyrå, Citation1963, p. 47), and male homosexuality was illegal. By 2022, women comprised 47.2% of the working population (Statistics Norway, Citation2023d), 497,977 foreigners worked in Norway (Statistics Norway, Citation2023a), and same-sex marriage was legal. Awareness that students should see themselves represented in school has increased during the 60 years of exam provision. We will look at how representation of diversity has developed throughout that period.
Theoretical background and earlier research
In this section, we discuss research on students’ identities as mathematics learners and how identities can be influenced by mathematics tasks. We also discuss the special role of exam tasks, and summarise research findings on representation of gender, ethnicity, culture, religion, functionality, sexuality, and class in mathematics tasks.
Students’ identities as mathematics learners
Students’ identities can be conceptualised in different ways. The definition of identities as “a set of reifying, significant, endorsable stories about a person” (Sfard & Prusak, Citation2005, p. 14) is often used, while others see identity “as something you do, not something you are” (Gutiérrez, Citation2013, p. 45). For the purposes of this article, it is not necessary to choose one definition over the other – the salient point is that researchers agree that students’ identities can be important factors in their relationship with mathematics. All human beings participate in different practices, and “any given practice positions an individual through and in race, class, ethnicity, sexuality, gender, religion, language, and so forth” (Gutiérrez, Citation2013, p. 46). These classifications we will refer to as “identity markers”.
In their discussion of contextualisation in mathematics, Rubel and McCloskey (Citation2021) argue that recognising themselves may provide students with a feeling of being included and accepted, which can then mean that mathematics is experienced as more relevant. This experience has been referred to as viewing a mirror: it “reflects their lives back at them” (Horn & Garner, Citation2022, p. 29). Examples of diversity in textbooks may also, in the words of Luecke (Citation2011), serve as “curricular windows” allowing children to become aware of minorities that may not be part of their everyday life. Horn and Garner (Citation2022) remind us that, “[i]n practice, most contexts represent windows for some students and mirrors for others: in inclusive classrooms, students encounter some windows and some mirrors, with no student having windows or mirrors all of the time” (p. 29).
On the other hand, groups can be represented in stereotypical ways. We follow Gjøvik et al. (Citation2023) in defining a stereotype as a belief held by one group of people (who are stereotyping) about a group of other people (who are stereotyped). Stereotypes appear to be rooted in observations of the stereotyped group by the stereotyping group, following which the observed behaviours of individual members are explained as traits of the stereotyped group (Koenig & Eagly, Citation2019). While such stereotypical representations may, at best, make students feel included, they can simultaneously narrow how they are seen. At worst, the stereotypes may be pejorative and hurtful (Rubel & McCloskey, Citation2021). Neto and da Silva (Citation2021) argue that mathematics problems can be interpreted as a “handbook” detailing how certain groups are expected to behave, echoing Dowling’s (Citation1991) point that a school text “defines and constructs us in relation to it” (p. 6).
We stress that, here, we only examine representation of diversity in tasks. There are many other ways in which the subject of mathematics relates to identity markers, which are equally important to research (Becker & Hall, Citation2023). Consider, for instance, how different groups are believed to have different beliefs about and attitudes to the subject (Mendick, Citation2005); how different groups of students are positioned by teachers or each other (Solomon, Citation2009); or how groups can benefit from a social justice approach to mathematics (Xenofontos, Citation2019). We will not consider these here.
When discussing lack of representation, it may be useful to consider the concept of micro-aggressions: “everyday brief, low-intensity events that convey negative messages towards marginalized groups” (Ogunyemi et al., Citation2020, p. 97). Micro-aggressions can range from micro-assaults (that are meant to hurt) to micro-invalidations (that are often unconscious). While each instance can seem too insignificant to even warrant attention, the combined effect of years of micro-aggressions can be powerful. In this light, every new textbook page or every new exam task that lacks representation may be another micro-aggression to add to previous feelings of exclusion. In the words of Yeh and Otis (Citation2019), “word problems are carriers of cultural values and privilege certain worldviews” (p. 90).
In real life, every human being has many identity markers. We are inspired by the concept of intersectionality, the idea that investigating one identity marker at a time is misleading because “people are simultaneously positioned – and position themselves – in multiple categories” (Christensen & Jensen, Citation2012, p. 110). Research related to intersectionality shows that several identity markers may interact, and that important insights are lost if markers are viewed in isolation (Bowleg, Citation2008; Bullock, Citation2018).
The role of exam tasks
Traditionally, mathematics is a subject centred on tasks (Walls, Citation2005). Exam tasks occupy a special position, in that they are the most important mathematical tasks published by the government. In Norway, the official purpose of exams is to allow students to document their competence (Forskrift til opplæringslova, Citation2020). Exam tasks are developed so as to be in line with current ideas regarding what is important in mathematics. They also signal to teachers what they need to emphasise in their teaching (Burkhardt & Schoenfeld, Citation2018). Exam tasks are also used by teachers in their teaching, to prepare students for the exam (Andresen et al., Citation2017). Exam tasks are therefore read and solved not only by the thousands of students sitting the exam, but also by many more students in subsequent years.
Tasks in textbooks can potentially be modified by teachers to make them more suitable for the students in question (Nusbaum et al., Citation2020), as can tasks in oral exams (Fyhn et al., Citation2016). Written exam tasks, on the other hand, are given to students exactly as they are designed. Therefore, any representation of diversity deemed to be important must be included in the exam tasks as they are provided.
Selected identity markers
Many identity markers can be included in exam tasks. In this article, we will look at theories and research related to gender, ethnicity, culture, religion, functionality, sexuality, and class, as these seem to be the identity markers most prevalent in the literature. Our review of previous research on these identity markers needs to be concise. We prioritise research on Scandinavian exam tasks in mathematics. However, as it is very limited in some cases, we supplement it with research on textbook tasks rather than exam tasks, regions other than Scandinavia, and even, when necessary, subjects other than mathematics.
Gender
As Leyva (Citation2019) points out, in mathematics educational research the word “gender” has often been used as a binary concept (male and female), which would today more often be referred to as “sex”; rarely has it been used as a non-binary social construct. By the early 1950s, researchers had already pointed out that mathematics tasks tended to be suited to boys’ interests more than girls’, and that this influenced girls’ attitudes towards mathematics (e.g., Milton, Citation1959). This line of research is still active today. Norén and Boistrup (Citation2016), for instance, reveal that more boys than girls are featured in Swedish mathematics textbooks for grades 8 and 9, and that boys are more active and more often have jobs, while girls to a larger degree are care-givers in the home, while also having jobs. Other studies present a similar picture of textbooks used in Brazil (Neto & da Silva, Citation2021), Britain (Macintyre & Hamilton, Citation2010), Palestine (Karama, Citation2020), Spain (Guichot-Reina & De la Torre-Sierra, Citation2023), and the US (Parise, Citation2021; Piatek-Jimenez et al., Citation2014), as well as exams used in Brazil (Pereira, Citation2019).
Ethnicity
Piatek-Jimenez et al. (Citation2014), in a study of US textbooks, found that white people are portrayed as being more mathematical and active than people from minorities. Similarly, in a study of Brazilian exams, Pereira (Citation2019) found that nearly all characters could be perceived as white. Flottorp and Poorgholam (Citation2003) analyzed Norwegian mathematics textbooks using multicultural perspectives and identified varying usage of Asian or African names or physical appearance.
Culture
The cultural aspects of textbooks are important, as can be seen when a textbook is adapted to another culture (Fan et al., Citation2018). Still, we have found little research on cultural aspects of tasks. Flottorp and Poorgholam (Citation2003) found that Norwegian mathematics textbooks reflected the traditional Norwegian way of life: a nuclear family in a detached house, vacation spots at a cabin or in Mallorca, and tasks connected to buying foodstuffs consistent with a traditional Norwegian diet. Students were sometimes asked to calculate the area of their own room, assuming they had their own room. When places on other continents were mentioned, they were often places of economic importance to Norway. Mathematicians mentioned were from Western countries. Currencies mentioned were European or US dollars. Fyhn and Nystad (Citation2013), in an analysis of the 2009 mathematics exam, found that tasks focusing on a process were in harmony with Sami values, which consider knowledge to be a process. It can thus be seen that analysing whether an exam is in harmony with the values of a particular culture is a more complicated process than seeking explicit examples of cultural practices in exams.
Religion
According to Flottorp and Poorgholam (Citation2003), religion barely features in textbooks, and, when it does, its mostly Christianity. Yilmaz and Ozyigit (Citation2017) found no examples of religious context in the most recent Turkish high school textbooks they studied. However, in a textbook from 1908, they found several examples involving religious ethics. We found few other studies on religion in mathematics textbooks.
Functionality
The only study we identified on functionality in mathematics textbooks found no representation of disability (Macintyre & Hamilton, Citation2010). In other subjects, studies found limited and stereotypical representation in textbooks (Hardin & Hardin, Citation2004) and electronic media (Hodkinson, Citation2012). Jensen et al. (Citation2021) studied Norwegian textbooks in several subjects, not including mathematics, and found limited representation of disability. They also interviewed the authors of textbooks about why people with disability are absent from so many of them. Among reasons given were that it was an unconscious omission, that disability is not explicitly mentioned in the curriculum, and that it is a difficult, irrelevant, or sensitive subject.
Sexuality
Studies on sexuality in mathematics textbooks have found a lack of inclusion of homosexuality (Macintyre & Hamilton, Citation2010; Parise, Citation2021), and that couples are often portrayed as heterosexual (Parise, Citation2021).
Class
In the period covered, schools have at times been criticised for mostly targeting middle-class children – or even that textbooks “construct equivalences between ‘high ability’ and ‘high social class’ and between ‘low ability’ and ‘low social class’” (Dowling, Citation1991, p. 6). International research reveals that elements of school mathematics are not equally adapted to children from different social classes (Nusbaum et al., Citation2020). At the same time, Schaub et al. (Citation2019) demonstrate how US textbooks improved in this respect between 1904 and 1999.
The overall picture seems to be that women, non-white people, and non-European cultures are underrepresented, while religion, disability, and sexuality other than heterosexuality, tend not to be included in tasks.
We note that societal change has occurred in Norway in relation to all of these identity markers during the period under discussion. Concerning gender, from under a quarter in 1962 (Statistisk sentralbyrå, Citation1963), women comprised 47% of the workforce by 2020 (Statistics Norway, Citation2023b). Important milestones along the way were the United Nations designation of 1975 as International Women’s Year, and the so-called women’s cabinet of 1986, when 8 of 18 cabinet members were women. Concerning ethnicity, culture, and religion, Norway used to be predominantly white, monocultural and Christian, but became more multi-ethnic, multicultural, and multi-religious during the second half of the twentieth century. This can be illustrated by the increase in immigrants and Norwegian-born children to immigrant parents from less than 60,000 in 1970 to almost 1 million in 2020 (Statistics Norway, Citation2023c). However, “whiteness” can still be considered a key part of being “Norwegian” (Guðjónsdóttir, Citation2014). During our research period (1962–2020) attitudes towards functionality changed, and several groups now experience greater visibility in society. The Salamanca Statement (UNESCO, Citation1994), for example, emphasised disabled people’s right to be included in education. Concerning sexuality, family structures also changed throughout this period. For instance, male homosexuality was decriminalised in Norway in 1972, registered partnerships were introduced in 1993, and same-sex marriage was introduced in 2009. Concerning class, income inequality, measured by the Gini coefficient, “was low and stable between 1953 and 1980 and has risen again since 1980” (Aaberge et al., Citation2020, p. 12).
Including many of these identity markers in textbooks and exams may appear to be a simple approach. Giving a few people “women’s names” or “foreign names” or making sure that some of the photos include a variety of skin tones may ensure that tasks appear to have become more diverse. Such a strategy will, however, be criticised as “tokenism”; that is, that such changes are purely cosmetic. Researchers identifying tokenism argue that diversity is not addressed simply by including a variety of names and skin tones, and that how people are positioned, and whether stereotypes are perpetuated or challenged, is important (Deckman et al., Citation2018). Addressing these issues may be more demanding. On the other hand, placing people from a particular culture consistently in contexts particular to that culture may contribute to upholding stereotypes, even pejorative ones (Rubel & McCloskey, Citation2021). Assuring a mix of contexts for each subgroup necessitates a certain number of “representatives” of these subgroups, suggesting that quantitative representation is a prerequisite, but not a guarantee, of adequate diversity.
This literature review shows that there is valuable research to be found on individual identity markers, but also that the research base is uneven. A compound analysis of identity markers may, however, provide an overview that is currently lacking. Also, we found little research on representation in exam tasks, and almost no research providing information on change over time.
Based on this literature review, our research question is: How has representation of different identity markers in Norwegian mathematics exams in Grunnskolen (compulsory school) changed during the period 1962–2020?
Method
As there is little suitable previous research to provide a holistic overall view of such a long period, we found it reasonable to start out with a quantitative focus, counting instances of inclusion. Using this approach, we could provide an overview of the change, which, at a later stage, could provide a foundation for more in-depth, qualitative analyses. These could focus on particular periods or identity markers or progress from representation to positioning – analysing whether the representation was marred by tokenism or stereotypical portrayals. We will come back to ideas for further research in the conclusion. Our approach was in line with recommendations for historical studies of representation in textbooks (Chisholm, Citation2018), as well as advice to first “lay out an overview of how certain diversity-related categories are represented” (Niehaus, Citation2018, p. 334), followed by more in-depth content analyses (which we do not do in the present article). The methodology outlined here is a continuation of the methodological paper (Smestad, Citation2021).
As some of the identity markers studied could, based on previous research, be expected to be of low frequency (e.g., sexuality; see Parise, Citation2021), it would be unsatisfactory to have a small sample of tasks. We therefore chose to study all of the 9th grade – and later 10th grade – exam tasks from 1962 to 2020. The starting point (1962) was chosen as this was the first year of national examinations, while the endpoint (2020) was the last year of exams as a result of the COVID-19 pandemic. The number of tasks involved (1514) made it important to strive for as simple and objective criteria as possible.
Unfortunately, no public collection of all the tasks in question exists. Most were found in official publications, while others had to be identified in a variety of books, journals, and collections of exam tasks on the internet. In some of these sources, the original layout was not kept intact. This does not influence our analyses, so long as the texts and illustrations are correct. We compared the texts and illustrations used in exams for which several versions were available, supporting our belief that errors are few.
Some of the exams included booklets for students to study in advance. We were unable to collect all of these and chose not to include any of them in the analysis. We also omitted the front pages of exams or exams for students involved in special projects, such as the New Math experiments or the individualised mathematics teaching project.
Our unit of analysis was the person. People can appear in texts, illustrations (drawings or photos), or both. While we considered ignoring people in the background of illustrations, the difficulty of deciding what constituted the background led us to abandon this idea. People who are mentioned only in tables, illustrations such as movie posters, or TV listings are excluded. People who figure only in names such as Pytagorassetningen (the Pythagorean theorem) are also excluded. As the impact of one individual may diminish as a group grows in size, we did not analyse, individually, people appearing in groups of more than six or in groups of indeterminate size.
People featuring in mathematics tasks are often not real and, as such, they do not necessarily have a gender, ethnicity, and so on. On the other hand, they will often be perceived as belonging to certain groups, based on the stereotypical image of people from these groups. A person who conforms to what is stereotypically viewed as a man will tend to be perceived as a man. Therefore, we did not count men and women, for instance; rather, we counted which people would, in our view, most likely be perceived as men and women. Likewise, a person with a stereotypically Scandinavian name tended to be perceived as Scandinavian when no other information was available. While we know that people with stereotypically Scandinavian names can have other ethnicities (for instance, through adoption), these stereotypical Scandinavian names still contribute to an overrepresentation of people perceived to be Scandinavian. While the first instinct may be to analyse those who are underrepresented (e.g., disabled people), we also included those we expected to be overrepresented (e.g., able-bodied people) (Rogel et al., Citation2023). This ensured that we could differentiate between a situation in which functionality was absent and a situation in which only people with a disability were left out while able-bodied people were included.
We analysed place names in tasks, but not if they were included only as parts of maps or tables. We also excluded names of buildings/attractions such as the “Eiffel Tower”.
We coded the following aspects of tasks:
Perceived gender. We coded this as man/woman if the name, pronoun, and/or appearance in illustrations were stereotypically those of a man/woman. While some occupations were dominated by men at the time of an exam, we did not infer gender based on occupation. Where we could not decide on a perceived gender, we coded it as unknown gender.
Perceived ethnicity. We decided whether or not a name was stereotypically Scandinavian. We also decided whether or not people looked white.
For culture, we looked for foreign language use and for cultural expressions that were not stereotypically Norwegian. In Norwegian, we also included groups traditionally living in Norway, for instance Sami people.
For religion, we coded contexts in which religions, including deities, were mentioned.
For functionality, we counted people with an explicit/visible disability and people with an explicit/visible ability, for instance engaging in sport.
For sexuality, we coded contexts concerning family, and in particular those in which romantic couples were involved. We also looked at whether untraditional family forms featured.
We also coded place names mentioned in tasks, and coded whether they were in Norway, the rest of Europe, or the rest of the world.
Even though class is an important identity marker, we were unable to find a way to code it for quantitative analysis. In our material, there were many examples of people buying expensive houses, having good jobs, or taking expensive holidays. While identifying extreme examples was simple, we found it difficult to operationalise this in a way that would work throughout a period of almost 60 years, during which time Norwegian society has progressed economically. Therefore, class was omitted from the present study.
In addition to the coding described above, we also looked for signs of “immigrant culture” in tasks to enable a discussion of tokenism. We did not, however, analyse the roles performed by different people in tasks; that is, whether perceived boys performed more roles than perceived girls. This approach would be too time-consuming.
The coding criteria were developed collaboratively but each author analysed the complete dataset alone. The first author made preliminary summaries of his individual analyses. Subsequently, we decided to omit some aspects for now (e.g., people’s role in tasks and the distinction between active and passive roles). Then we discussed all instances of the remaining analyses where our views did not match. There were some notable differences that needed to be discussed:
When coding for functionality, one of the authors included all people doing sports, based on the idea that there was an explicit functionality and no explicit disability. The other author did not include, for instance, swimming, as that is also a popular sport among paralympic athletes. We finally agreed that we would code people doing sports as having functionality, so long as there was no explicit disability.
When coding for sexuality, one of the authors included all mentions of family (for instance, an aunt) to test the theory that task authors try to avoid mention of families. The other author included families only when a couple (for instance, mother and father) were included, as this is most relevant to identifying whether homosexual couples are underrepresented compared to heterosexual couples. During the coding, we decided that both authors should do both versions of this coding, although in the results section of this article, only the last one is used.
In coding for whether a person looks stereotypically Scandinavian, we noticed that we sometimes tended to include other aspects of the image in the analysis. In that way, a person would be more easily coded as looking stereotypically Scandinavian if involved in a stereotypically Scandinavian activity. We decided to recode without drawing on the other aspects of the image in the analysis, and ultimately used the codes white and non-white, as previous researchers have done.
We give two examples of tasks to explain our coding. In , the person is coded as a woman based on the name Ingrid. She is coded as having an explicit ability, based on cycling 10,000 metres in 30 minutes. We did not conclude, based on the image, whether she should be coded as white. In , the Hansen family was coded as two women/girls and three men/boys based on the words mother/father and their names. The three children have stereotypically Scandinavian names. The words mother/father also point towards a heterosexual relationship.
Figure 1. Task 1b from spring 2020, part 1. “Ingrid cycles 10,000 m in 30 minutes. The average speed of Ingrid is ___ km/h.”
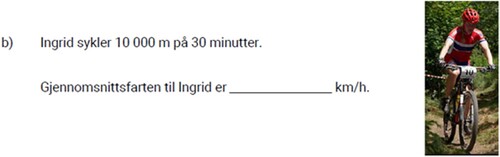
Figure 2. Part of task 11 from spring 1988, part 2. “In the Hansen family are mother, father, Anne (14 years), Hans (10 years) and Per (8 years). They are going on holiday and the travel agency can offer: […] Date – 1 week per person – 2 weeks per person:”
![Figure 2. Part of task 11 from spring 1988, part 2. “In the Hansen family are mother, father, Anne (14 years), Hans (10 years) and Per (8 years). They are going on holiday and the travel agency can offer: […] Date – 1 week per person – 2 weeks per person:”](/cms/asset/aec40ccb-ccd4-4e7c-a79b-638812196571/csje_a_2322950_f0002_oc.jpg)
In this article we illustrate our findings with further examples of tasks. These tasks are a way of connecting the numbers we present to the underlying archive material – the numbers remain the main result of the analyses upon which this article is based.
Research ethics
The goal of a research study is to produce good results, which is contingent on it being conducted carefully and diligently, which we tried to achieve. The goal of our research is to consider how representation has changed over time. To do that, we use stereotypes as a tool. Research on representation has been criticised for using a binary view of gender (Höhne & Heerdegen, Citation2018), and the main ethical issue we struggle with is how to study and discuss issues of race and gender without unwittingly adopting racial categories or a binary gender model. We argue that, as the people in tasks are mostly fictional and presented with very little information, they tend to be assigned to a group if the information provided fits the prevalent stereotype about that group. We had to keep reminding ourselves, and we want to remind the reader, that we were not setting out to categorise (fictional) people as Scandinavian/non-Scandinavian or men/women. Our objective was to investigate exam tasks to see whether the people portrayed in the tasks provided diversity and thus representation for underrepresented groups, or whether they fit with stereotypes of the overrepresented groups. Thus, in discussing whether a person’s appearance fits the stereotype of a man, we were not trying to enforce rigid rules for what a man should look like, but rather to try to determine how the person would be read by a student in Norway on the basis of prevalent pre-existing stereotypes. Likewise, we were not claiming that names and ethnicities should be connected, but that people with certain names will tend to be assumed to be Scandinavian.
Results
As we want to create an overview, we will start by looking at some key numbers () and percentages () for each decade. The numbers are included mainly to help interpret the percentages. The exams have changed over the years. In some periods, exams gave students many tasks to choose from, meaning that the table gives a false image of how many people each student would engage with. However, the average student does encounter many people in the tasks. For instance, the 2020 exam included 28 tasks that all students were supposed to complete, which included 23 people.
Table 1. Some key numbers for each decade (2020 is included in the 2010s).
Table 2. Some key percentages for each decad (2020 is included in the 2010s).
For gender, the percentages in are based on the total number of people. For names and appearance, the percentages are calculated based on the total number of people whose names and appearance, respectively, have been coded by category not total number of people. This is because fewer people have been coded on the basis of appearance or name. For functionality, the percentages are based on the total number of people. For place names, percentages are based on the total number of place names.
In terms of gender, from the 1980s onwards the number of women increased; 1979 was the last year in which only men were featured (two of them). Between 1980 and 1983, there were only two to six gendered people in each year; in 1984, the number of gendered people reached nine: five men and four women. In the 2010s, there were on average 15 gendered people per year: nine men and six women.
For ethnicity, the proportion of non-stereotypically Scandinavian names increased from the 2000s onwards, and the proportion of non-white people has increased in the last ten years. Of these, many are mathematicians or scientists from history, rather than people taking part in Norwegian society today.
The proportion of non-European place names was low until 2010 but has increased to almost a quarter since then. During the 11 years 2010–2020, 13 place names outside of Europe were included, none of which were connected to areas from which most immigrants to Norway originate.
Although change over time is our main concern, for some identity markers – functionality, sexuality, and religion – there is no change to talk of, simply because there are almost no examples to be found in the exams. For functionality, we found two examples of visibly disabled people in the exam tasks in mathematics during the period 1962–2020. These two were elderly people with walking sticks, from the 1990 exam. On the other hand, we found 104 instances of people with some prominent bodily ability in the tasks: skiers, swimmers, soccer players, and so on (see ). We are aware that people with disabilities also take part in such activities. In the tasks, however, the bodily activity (and thus ability) is what is explicit, not people’s possible disabilities. Of the 109 people with prominent bodily abilities, 51% were categorised as male and 38% as female, 27% as white and 10% as non-white.
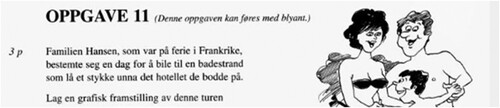
There were 38 tasks connected to families in various ways, six of which signified a heterosexual relationship (see , for an example). There was only one example of an untraditional family, however (see ). For another seven tasks, the text was neutral but an illustration signified that the relationship was heterosexual (). We found no obvious examples of same-sex relationships.
Figure 3. Task 1A from spring 2006, part 3. “When Tone and Per got married, both had children from previous marriages. After some years, there are now five children in the family. Per is the father of three of them, and Tone is the mother of four. How many children have Tone and Per had together?”
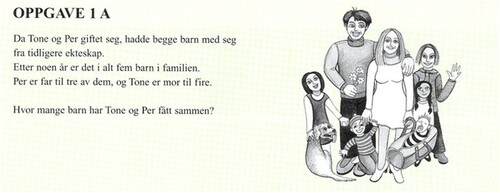
Figure 4. Part of task 11 from 2002, part 1. “The Hansen family, who were on vacation in France, one day decided to drive to a beach a little way away from the hotel they were staying at. Make a graphical representation of this trip.”
We found just four examples of religion included in tasks: three were connected to Christianity and one mentioned the Roman god Jupiter. We found only three examples of use of language other than Norwegian in the tasks. We looked for examples of cultural practices that are typical in other countries but rare in Norway and found none. The only example of a cultural practice that is clearly not connected to the majority Norwegian population, was connected to the Sami culture (which is part of the cultural heritage of Norway as a country).
To summarise our results, we saw a clear increase in representation of several identity markers – more perceived women, more non-stereotypically Scandinavian names, more people who were not white, more non-Norwegian place names and more non-European place names. The changes occurred at different times: more women since the 1980s, more foreign-sounding names since the 2000s and 2010s, more non-white people from the 2010s, and more non-European place names since the 2010s. We saw no change in other identity markers: almost no people with disabilities despite the presence of many able-bodied people; no non-traditional families despite the inclusion of several families; and very few mentions of religion.
Discussion
From our results, we can conclude that, in the 1960s, students would find more people like themselves in maths tasks if they were Scandinavian rather than an immigrant, straight rather than gay, able-bodied rather than disabled, and men rather than women. These findings match those of previous research. In the more recent exams, able-bodied men are still overrepresented; however, a change has occurred in relation to many of the identity markers. One might hope that increased awareness of the importance of representation would lead to better representation for all identity markers. The fact that these changes in representation have not been simultaneous, however, shows that such awareness does not automatically travel from one identity marker to another.
The effects on students may be inferred from previous research. Students who never recognise themselves in tasks may feel excluded and not accepted. Moreover, they may feel that maths is less relevant for them (Rubel & McCloskey, Citation2021). Of course, if maths exams were the only arena in which such mechanisms were at play, the effect could be minimal, even though exam tasks are also used in teaching (Andresen et al., Citation2017). However, it is likely that such exclusion does not occur only once, in one arena. To the degree that textbooks and teaching follow the same pattern as the exam tasks, the invisibility and exclusion experienced by underrepresented students persist. Thus, lack of representation in exam tasks can be just another microaggression (Ogunyemi et al., Citation2020), adding to others and becoming increasingly significant in terms of affecting a person’s identity in relation to mathematics. Moreover, students may be underrepresented in many ways simultaneously, for instance being both disabled and an immigrant (Bullock, Citation2018). In addition to some students not being mirrored, tasks will not offer a curricular windows through which to develop students’ awareness of minorities (Luecke, Citation2011).
Intersectional analysis (Christensen & Jensen, Citation2012) is impossible when there is an almost total lack of inclusion of disabled, gay, or religious people, for instance. Even attempting to discover whether disabled people are always portrayed with stereotypical Scandinavian looks, for instance, is meaningless in such a case. It also means that we can conclude that, for many students, representation in exam tasks is limited when all diversity markers are considered. It cannot be taken for granted that a gay, disabled girl will feel included just because exams have an improved gender balance.
It is also tempting to propose reasons for the changes. The maths exams mirror – to a certain extent – changes in society at large. Increased consciousness of gender and immigration is likely to be the cause of changes in representation in exam tasks. For instance, the UN designation of 1975 as International Women’s Year and steady growth in immigration throughout the period show that changes in society predate changes in representation in exams. However, there is also greater awareness of religion, functionality, and sexuality at a societal level and yet exams still avoid these issues. Thus, increased awareness does not lead automatically to greater representation in exam tasks. Jensen et al. (Citation2021) show that non-representation can be the result of making unconscious decisions, viewing it as irrelevant or not part of the curriculum, or seeing it as a difficult or sensitive subject. We propose that aspects of identity markers may also affect resulting representation. People’s gender and ethnicity are often connected to their names and appearance; thus, it takes effort and conscious decision-making to design tasks wherein gender and ethnicity cannot be assumed. Other markers are of a different kind – creating tasks with no reference to religion, sexuality, or functionality does not involve making a conscious decision in the same way. Also, religion, sexuality, and functionality may be considered more difficult and sensitive issues than gender and ethnicity. There may even be a self-reinforcing effect at play: if these identify markers have been excluded from tasks for decades, including them now may make them more eye-catching. Of course, a response to that view could be: eye-catching to whom? To some students, never being included may be eye-catching, too. We propose that barriers to representation exist based on tradition and social attitudes to what are perceived to be difficult and sensitive issues, and that these barriers may help explain lack of representation.
Non-stereotypically Scandinavian names and different types of physical appearance are now evident in maths tasks. One might expect that non-stereotypically Norwegian cultural expressions might also be included, but that was not found to be the case. There were no examples of cultural practice typical in other countries but rare in Norway. Thus, it can be argued that these names and types of physical appearances are examples of tokenism; that “inclusion” is sought by inserting these identify markers but maintaining the traditional style in all other elements of the maths tasks (Deckman et al., Citation2018). Tokenism leads to limited inclusion, and mathematics is not shown to be connected to cultural practices that are important in other cultures. However, if all students were to complete mathematics tasks based on stereotypical practices relevant to their own culture (Rubel & McCloskey, Citation2021), it would both exclude those who adhere to non-stereotypical cultural practices and uphold other students’ stereotypical views of other cultural groups. A mix of people and different cultural practices may be needed, and this is still lacking in Norwegian exams.
Each set of exam tasks is of a limited size, and therefore the absence of certain identity markers may not be eye-catching when seen one set at a time. However, an overview of almost 60 years of exams provides a different picture. The lack of disabled people, while perhaps understandable when looking at one set of tasks at a time, is unreasonable in the long run. Moreover, this history of exclusion may make those who write exam texts view disabled students as irrelevant to the subject (Jensen et al., Citation2021). However, if inclusion of disabled people involves merely inserting a disabled person into an exam text rather than an able-bodied person, that may be seen as tokenism (Deckman et al., Citation2018). A better approach might be to identify mathematical challenges related to using a wheelchair, for instance, and to build a task around that.
Conclusion
The official purpose of mathematics exams in Norway is to assess the mathematical competence of students taking the exam. However, the people included in tasks matter (Rubel & McCloskey, Citation2021). In this article, we described the increased presence of some underrepresented groups in exam tasks in recent decades. This has not happened simultaneously for all such groups but, rather, one identity marker at a time. We suppose that this is the case because different groups are the focus of public debate at different times. Seeking many identity markers simultaneously meant that our analyses revealed that, over time, some groups experienced greater inclusion than others, and that Norwegian exams in mathematics continue to systematically exclude certain identity markers. From an intersectionality perspective, this situation can exclude many students even though representation has improved concerning some of their diversity markers.
A reasonable response to this lack of representation would be to stop focusing on one group at a time. While ensuring the presence of a satisfactory number of certain types of people is not difficult, ensuring a non-stereotypical representation of many groups at once demands another level of dedication. Exam tasks are viewed as signals of that which needs to be emphasised (Burkhardt & Schoenfeld, Citation2018) and is used in teaching (Andresen et al., Citation2017). As Nusbaum et al. (Citation2020) stress, teachers need to be aware of the lack of representation in maths tasks and able to modify tasks to provide culturally responsive teaching.
As discussed in the methods section, counting cannot tell us everything. The overview of almost 60 years offers some important insights but, just as importantly, provides ideas and starting points for more detailed studies. For instance, after identifying perceived genders in the exam tasks, we could go on to conduct qualitative studies of how the perceived boys and perceived girls in those tasks relate to mathematics (e.g., see Neto and da Silva, Citation2021). Such an analysis could also include ethnicity. For identity markers with few or no occurrences in the exam tasks, other questions arise, such as which barriers exist to their inclusion (an issue studied in the case of functionality in textbooks by Jensen et al., Citation2021) and how to address them. An analysis of class is also necessary. Research on students’ perception of the people portrayed in mathematics exams would also be welcome.
Disclosure statement
No potential conflict of interest was reported by the authors.
Notes
1 Initially, this was a test conducted in some municipalities. It became a nationwide exam in 1969.
References
- Aaberge, R., Atkinson, A. B., & Modalsli, J. (2020). Estimating long-run income inequality from mixed tabular data: Empirical evidence from Norway, 1875–2017. Journal of Public Economics, 187, 104196. https://doi.org/10.1016/j.jpubeco.2020.104196
- Andresen, S., Fossum, A., Rogstad, J., & Smestad, B. (2017). På prøve. Evaluering av matematikkeksamen på 10. trinn våren 2017 [To the test. Evaluation of the tenth grade mathematics examination in the spring of 2017]. FAFO.
- Becker, J. R., & Hall, J. (2023). Research on gender and mathematics: Exploring new and future directions. ZDM – Mathematics Education. https://doi.org/10.1007/s11858-023-01510-6
- Bowleg, L. (2008). When black + lesbian + woman ≠ black lesbian woman: The methodological challenges of qualitative and quantitative intersectionality research. Sex Roles, 59(5), 312–325. https://doi.org/10.1007/s11199-008-9400-z
- Bullock, E. C. (2018). Intersectional analysis in critical mathematics education research: A response to figure hiding. Review of Research in Education, 42(1), 122–145. https://doi.org/10.3102/0091732X18759039
- Burkhardt, H., & Schoenfeld, A. (2018). Assessment in the service of learning: Challenges and opportunities or plus ça change, plus c’est la même chose. ZDM, 50(4), 571–585. https://doi.org/10.1007/s11858-018-0937-1
- Chisholm, L. (2018). Representations of class, race, and gender in textbooks. In E. Fuchs & A. Bock (Eds.), The Palgrave handbook of textbook studies (pp. 225–237). Palgrave Macmillan.
- Christensen, A.-D., & Jensen, S. Q. (2012). Doing intersectional analysis: Methodological implications for qualitative research. NORA-Nordic Journal of Feminist and Gender Research, 20(2), 109–125. https://doi.org/10.1080/08038740.2012.673505
- Deckman, S. L., Fulmer, E. F., Kirby, K., Hoover, K., & Mackall, A. S. (2018). Numbers are just not enough: A critical analysis of race, gender, and sexuality in elementary and middle school health textbooks. Educational Studies, 54(3), 285–302. https://doi.org/10.1080/00131946.2017.1411261
- Dowling, P. (1991). Gender, class, and subjectivity in mathematics: A critique of Humpty Dumpty. For the Learning of Mathematics, 11(1), 2–8.
- Fan, L., Xiong, B., Zhao, D., & Niu, W. (2018). How is cultural influence manifested in the formation of mathematics textbooks? A comparative case study of resource book series between Shanghai and England. ZDM, 50(5), 787–799. https://doi.org/10.1007/s11858-018-0976-7
- Flottorp, V., & Poorgholam, E. (2003). Flerkulturelle perspektiver i matematikkbøker? [Multicultural perspectives in mathematics textbooks] (Vol. 17). Høgskolen i Vestfold.
- Forskrift til opplæringslova. (2020). Forskrift til opplæringslova [Regulations to the Education Act] (FOR-2023-05-26-752). Kunnskapsdepartementet. https://lovdata.no/forskrift/2006-06-23-724
- Foyn, T. (2021). No heroes, no villains: Uncovering the mundanity of gender in the mathematics classroom [Dissertation for the degree of philosophiae doctor (PhD), OsloMet - Oslo Metropolitan University]. ODA. https://oda.oslomet.no/oda-xmlui/handle/11250/2998304.
- Fyhn, A. B., Nutti, Y. J., Nystad, K., Eira, E. J. S., & Hætta, O. E. (2016). “We had not dared to do that earlier, but now we see that it works”: Creating a culturally responsive mathematics exam. AlterNative: An International Journal of Indigenous Peoples, 12(4), 411–424. https://doi.org/10.20507/AlterNative.2016.12.4.6
- Fyhn, A. B., & Nystad, K. I. M. (2013). Sámi culture and values: A study of the national mathematics exam for the compulsory school in Norway. Interchange, 44(3-4), 349–367. https://doi.org/10.1007/s10780-013-9201-3
- Gjøvik, Ø, Kaspersen, E., & Farsani, D. (2023). Stereotypical images of male and female mathematics teachers. Research in Mathematics Education, 25(2), 178–193. https://doi.org/10.1080/14794802.2022.2041471
- Guðjónsdóttir, G. (2014). We blend in with the crowd but they don't. Nordic Journal of Migration Research, 4(4), 176. https://doi.org/10.2478/njmr-2014-0026
- Guichot-Reina, V., & De la Torre-Sierra, A. M. (2023). The representation of gender stereotypes in Spanish mathematics textbooks for elementary education. Sexuality & Culture, 27(4), 1481–1503. https://doi.org/10.1007/s12119-023-10075-1
- Gutiérrez, R. (2013). The sociopolitical turn in mathematics education. Journal for Research in Mathematics Education, 44(1), 37–68. https://doi.org/10.5951/jresematheduc.44.1.0037
- Hardin, B., & Hardin, M. (2004). Distorted pictures: Images of disability in physical education textbooks. Adapted Physical Activity Quarterly, 21(4), 399–413. https://doi.org/10.1123/apaq.21.4.399
- Hodkinson, A. (2012). Inclusive education and the cultural representation of disability and disabled people within the English education system: The influence of electronic media in the primary school. Journal of Research in Special Educational Needs, 12(4), 252–262. https://doi.org/10.1111/j.1471-3802.2011.01208.x
- Höhne, M. S., & Heerdegen, D. (2018). On normativity and absence: Representation of LGBTI* in textbook research. In E. Fuchs & A. Bock (Eds.), The Palgrave handbook of textbook studies (pp. 239–249). Springer.
- Horn, I., & Garner, B. (2022). Teacher learning of ambitious and equitable mathematics instruction: A sociocultural approach. Routledge.
- Jensen, M. S., Herrebrøden, M., & Andreassen, U. R. (2021). The invisible minority: Why do textbook authors avoid people with disabilities in their books? International Journal of Inclusive Education, 27(12), 1–17.
- Karama, M. J. (2020). Gender bias in school mathematics textbooks from grade 1 to 12 in Palestine. Journal of International Women's Studies, 21(1), 162–171.
- Koenig, A. M., & Eagly, A. H. (2019). Typical roles and intergroup relations shape stereotypes: How understanding social structure clarifies the origins of stereotype content. Social Psychology Quarterly, 82(2), 205–230. https://doi.org/10.1177/0190272519850766
- Ladson-Billings, G. (2014). Culturally relevant pedagogy 2.0: Aka the remix. Harvard Educational Review, 84(1), 74–84. https://doi.org/10.17763/haer.84.1.p2rj131485484751
- Leyva, L. A. (2019). Beyond the binary and at the intersections: Chronicling contemporary developments of gender equity research in mathematics education. In C. Xenofontos (Ed.), Equity in mathematics education: Addressing a changing world (pp. 65–91). Information Age Publishing.
- Luecke, J. C. (2011). Working with transgender children and their classmates in pre-adolescence: Just be supportive. Journal of LGBT Youth, 8(2), 116–156. https://doi.org/10.1080/19361653.2011.544941
- Macintyre, T., & Hamilton, S. (2010). Mathematics learners and mathematics textbooks: A question of identity? Whose curriculum? Whose mathematics? The Curriculum Journal, 21(1), 3–23. https://doi.org/10.1080/09585170903558224
- Mendick, H. (2005). A beautiful myth? The gendering of being/doing ‘good at maths’. Gender and Education, 17(2), 203–219. https://doi.org/10.1080/0954025042000301465
- Milton, G. A. (1959). Sex differences in problem solving as a function of role appropriateness of the problem content. Psychological Reports, 5(3), 705–708. https://doi.org/10.2466/pr0.1959.5.3.705
- Neto, V. F., & da Silva, M. A. (2021). Gender as a problem in maths textbooks: A practical handbook on how to be a girl/woman. Acta Scientiae, 23(8), 191–221. https://doi.org/10.17648/acta.scientiae.6373
- Niehaus, I. (2018). How diverse are our textbooks? Research findings in international perspective. In E. Fuchs & A. Bock (Eds.), The Palgrave handbook of textbook studies (pp. 329–343). Springer.
- Norén, E., & Boistrup, L. B. (2016, July 24–31). Gender stereotypes in mathematics education. 13th International Congress on Mathematical Education, Hamburg.
- Norén, E., & Caligari, L.. (2020). Practices in multilingual mathematics classrooms: word problems. In Y. Liljekvist, J. Björklund Boistrup, J Häggström, L. Mattsson, O. Olande, & H Palmér (Eds.), Sustainable mathematics education in a digitalized world: Proceedings of MADIF 12, The twelfth research seminar of the Swedish Society for Research in Mathematics Education, Växjö, January 14–15, 2020 (pp. 61–70). Göteborg: Swedish Society for Research in Mathematics Education.
- Nusbaum, A. T., Cuttler, C., & Swindell, S. (2020). Open educational resources as a tool for educational equity: Evidence from an introductory psychology class. Frontiers in Education.
- Ogunyemi, D., Clare, C., Astudillo, Y. M., Marseille, M., Manu, E., & Kim, S. (2020). Microaggressions in the learning environment: A systematic review. Journal of Diversity in Higher Education, 13(2), 97–119. https://doi.org/10.1037/dhe0000107
- Parise, M. M. (2021). Gender, sex, and heteronormativity in high school statistics textbooks. Mathematics Education Research Journal, 33(4), 757–785. https://doi.org/10.1007/s13394-021-00390-x
- Pereira, P. (2019). Examining discources of race, gender and class on mathematics text: A case of the Brazilian national exam of secondary education - ENEM. In J. Subramanian (Ed.), Proceedings of the tenth international mathematics education and society conference (pp. 688–698). MES10.
- Piatek-Jimenez, K., Madison, M., & Przybyla-Kuchek, J. (2014). Equity in mathematics textbooks: A new look at an old issue. Journal of Women and Minorities in Science and Engineering, 20(1), 55–74. https://doi.org/10.1615/JWomenMinorScienEng.2014008175
- Rogel, A., Senouf-Pilpoul, O., Kiperman, R., & Marshall, S. E. (2023). History of exclusion: Queer representation in Israeli high school textbooks. Comparative Education Review, 67(3), 486–508. https://doi.org/10.1086/725497
- Rubel, L. H., & McCloskey, A. V. (2021). Contextualization of mathematics: Which and whose world? Educational Studies in Mathematics, 107(2), 383–404. https://doi.org/10.1007/s10649-021-10041-4
- Schaub, M., Salinas, D., Halibi, S., & Baker, D. (2019). The changing faces of the math student: Images in US early elementary mathematics textbooks, 1904-1999. Journal of Advances in Education Research, 4(3), 91–109. https://doi.org/10.22606/jaer.2019.43001
- Sfard, A., & Prusak, A. (2005). Telling identities: In search of an analytic tool for investigating learning as a culturally shaped activity. Educational Researcher, 34(4), 14–22. https://doi.org/10.3102/0013189X034004014
- Smestad, B. (2021). Researching representation of diversity in mathematics pedagogical texts: Methodological considerations. In D. Kollosche (Ed.), Exploring new ways to connect: Proceedings of the eleventh international mathematics education and society conference (Vol. 3, pp. 927–946). Tredition. https://doi.org/10.5281/zenodo.5416561
- Smestad, B., & Fossum, A. (2019). Exams in calculations/mathematics in Norway 1946–2017 – content and form. In U. Jankvist, M. Van den Heuvel-Panhuizen, & M. Veldhuis (Eds.), Proceedings of the eleventh congress of the European Society for Research in Mathematics Education (CERME11) (pp. 2170–2179). ERME.
- Solomon, Y. (2009). Mathematical literacy: Developing identities of inclusion. Routledge.
- Statistics Norway. (2023a). Employment among immigrants, register-based. https://www.ssb.no/en/arbeid-og-lonn/sysselsetting/statistikk/sysselsetting-blant-innvandrere-registerbasert
- Statistics Norway. (2023b). Employment, register-based. https://www.ssb.no/en/statbank/table/07984/
- Statistics Norway. (2023c). Immigrants and Norwegian-born to immigrant parents. https://www.ssb.no/en/statbank/table/05183/
- Statistics Norway. (2023d). Population, by labour force status, age and sex. https://www.ssb.no/en/statbank/table/05110
- Statistisk sentralbyrå. (1963). Statistisk årbok for Norge 1963 [Statistical yearbook of Norway 1963]. Statistisk sentralbyrå.
- UNESCO. (1994). The Salamanca statement and framework for action on special needs education: Adopted by the world conference on special needs education; Access and quality. Salamanca, Spain, 7-10 June 1994. UNESCO.
- Walls, F. (2005). Challenging task-driven pedagogies of mathematics. In P. Clarkson, A. Downton, D. Gronn, M. Horne, A. McDonough, R. Pierce, & A. Roche (Eds.), Building connections: Research, theory and practice - MERGA28 (pp. 751–758). MERGA Inc.
- Xenofontos, C. (2019). Equity and social justice in mathematics education: A brief introduction. In C. Xenofontos (Ed.), Equity in Mathematics Education: Addressing a Changing World (pp. 1–22). Information Age Publishing.
- Yeh, C., & Otis, B. M. (2019). Mathematics for whom: Reframing and humanizing mathematics. Occasional Paper Series (41). https://doi.org/10.58295/2375-3668.1276
- Yilmaz, Z., & Ozyigit, S. E. (2017). Analysis of real world problems in mathematics textbooks of early twentieth and twenty-first century Turkish education: Political and social reflections. BSHM Bulletin: Journal of the British Society for the History of Mathematics, 32(2), 171–182. https://doi.org/10.1080/17498430.2016.1247323