
 ?Mathematical formulae have been encoded as MathML and are displayed in this HTML version using MathJax in order to improve their display. Uncheck the box to turn MathJax off. This feature requires Javascript. Click on a formula to zoom.
Abstract
School stress is widespread among students’ worldwide, impacting academic success and mental health. Most research focuses on average stress levels but lacks insights into temporal trends and inequalities. Using repeated longitudinal survey data on 33,000 students in Swedish compulsory school from the Evaluation Through Follow-up (ETF) study, we investigate temporal trends in stress across three cohorts of students (born 1992, 1998, and 2004), with a focus on inequalities by school year, sex, socio-economic status, migration background, school grades, and school difficulties. The results show that (1) stress increased more in year 6 than in year 9 in recent cohorts; (2) stress increased more for girls than for boys; and (3) low school grades and school difficulties have become stronger risk factors for stress. We discuss the findings in the context of recent educational reforms and broader societal trends concerning the role of education for young people’s prospects in life.
Introduction
School stress is widespread among students across high-income countries (Löfstedt et al., Citation2020; World Health Organization, Citation2020) and adolescents consistently rank school-related concerns such as academic achievement as among their greatest stressors in life (Anniko et al., Citation2018; Bakken et al., Citation2018; Banks & Smyth, Citation2015; Byrne et al., Citation2007; Denscombe, Citation2000; Perming et al., Citation2022; Stentiford et al., Citation2021). Levels of school stress have increased in most high-income countries (Cosma et al., Citation2021; Löfstedt et al., Citation2020; Sweeting et al., Citation2010), including in Sweden, the focus of this study (Högberg et al., Citation2020).
Most quantitative research to date has investigated average levels of school stress in a given population of students, and, apart from sex and age or school year (Anniko et al., Citation2018; Cosma et al., Citation2021), has rarely explored inequalities in school stress across different groups. However, qualitative research suggests that other dimensions of social inequality – such as socio-economic status, migration background, as well as academic achievement, and school difficulties – differentially structure students’ exposure or vulnerability to stressors in school (Denscombe, Citation2000; Eriksen, Citation2021; Hiltunen, Citation2017; Krogh, Citation2022; Nygren, Citation2021; Stentiford et al., Citation2021). Moreover, we lack knowledge concerning whether the increasing levels of stress over time reported in several studies (Cosma et al., Citation2021; Löfstedt et al., Citation2020) are a universal trend a universal trend or if it has been driven by specific groups of students. Against this background, the aim of this study is to investigate temporal trends in school stress across three cohorts of students in Sweden (born 1992, 1998, and 2004), with a focus on inequalities by school year, sex, socio-economic status, migration background, school difficulties, or school grades. We address this aim using repeated longitudinal survey data, linked to administrative registers, on close to 33,000 students in Sweden.
We make several contributions to the existing literature on school stress. To the best of our knowledge, this is among the first papers to investigate multiple dimensions of inequality in school stress simultaneously, with a focus on temporal trends. Specifically, we study differences in school stress across cohorts and school years, and how these differences are moderated by student’s sex, socio-economic status, migration background, school difficulties, or school grades. We thereby aim to provide solid descriptive groundwork that maps trends in school stress across multiple dimensions of social inequality and on which subsequent explanatory research can build. As noted by Robert Merton (Citation1987), establishing the phenomenon – in the sense of demonstrating the existence of recurring social patterns – must be the first step in social science research. Thus, in subsequent research we intend to investigate the causes of the trends and inequalities in school stress uncovered in this paper. A detailed picture of levels and trends in school stress across groups of students may, furthermore, shed light on the broader question of the nature and causes of rising rates of mental health problems in adolescents (Keyes & Platt, Citation2023). Moreover, in light of the major changes of the Swedish education system in recent decades – involving new grading systems, stricter eligibility criteria, new forms of special support, and enhanced school choice – knowledge concerning how and for whom school stress has changed over the same period should be of particular relevance from a policy perspective.
Research background
School stress: definition and causes
Stress is usually defined as an imbalance between experienced demands and the individual’s perceived ability to deal with them. This includes a cognitive appraisal of the imbalance (see, for instance, Lindblad et al., Citation2008; Östberg et al., Citation2015). In qualitative studies, some students report that stress makes them more motivated or energized, but the term “stress” is predominantly used to describe negative emotional states involving feelings of pressure or anxiety, or thoughts related to worry or fear, with stomach-aches, rapid heartbeats, restlessness, and hyperventilation being common manifestations (Banks & Smyth, Citation2015; Denscombe, Citation2000; Hiltunen, Citation2017; Östberg et al., Citation2015; Perming et al., Citation2022). School stress, hence, refers to such stress when it arises in relation to school. In quantitative studies, school stress is consistently associated with a higher incidence of mental problems or health complaints (Anniko et al., Citation2019; Byrne et al., Citation2007; García-Moya et al., Citation2021; Giota & Gustafsson, Citation2017).
Within this overarching definition, distinct dimensions have been identified in both quantitative and qualitative research. In quantitative research, it is common to distinguish between stress related to school achievement, such as high achievement expectations; stress related to future uncertainty, such as the consequences of educational achievements for students’ prospects in life; stress related to school–leisure conflict, such as other activities being crowded out by schoolwork; and stress related to social relations (Anniko et al., Citation2018; Byrne et al., Citation2007; Landstedt & Gådin, Citation2012). Qualitative research generally supports the existence of these dimensions, but in addition emphasizes the centrality of achievement-related competition and social comparisons between peers (Nygren, Citation2021; Östberg et al., Citation2015; Spencer et al., Citation2018; Stentiford et al., Citation2021) as well as how students identities are tied to their academic achievement, meaning that academic failure becomes a threat to their sense of self-worth (Eriksen, Citation2021; Hiltunen, Citation2017; Krogh, Citation2022).
Levels, inequalities, and trends in school stress
Comparative surveys of students have found that school stress is widespread in most high-income countries, with more than a third of students aged 11–15 reporting that they experience it, but that rates also vary substantially across countries. Compared to students in other high-income countries, students in Sweden report lower than-average-levels of school stress at age 11 but higher than average levels at age 15 (World Health Organization, Citation2020). As for inequalities in school stress, a consistent finding across countries is that girls report higher levels than boys and that older students report higher levels than younger students (Anniko et al., Citation2018; Byrne et al., Citation2007; García-Moya et al., Citation2021; Giota & Gustafsson, Citation2017, Citation2020; Sonmark et al., Citation2016; Tharaldsen et al., Citation2022). Students in academic tracks also tend to report more stress than students in vocational tracks (Banks & Smyth, Citation2015; Landstedt & Gådin, Citation2012; Salmela-Aro et al., Citation2008; Tharaldsen et al., Citation2022). As for trends over time, school stress has increased in a majority of high-income countries among girls but remained relatively stable among boys (Löfstedt et al., Citation2020; see also Cosma et al. (Citation2021) and Högberg et al. (Citation2020)).
We are not aware of any quantitative study that has investigated inequalities in levels or trends in school stress by socio-economic status, migration background, school difficulties, or academic achievement (e.g., school grades). Qualitative studies, however, suggest that such dimensions may be relevant. For instance, Eriksen (Citation2021), Nygren (Citation2021), and Spencer et al. (Citation2018) document strong achievement pressures, high demands, and intense competition among middle- or upper-class students (see also Luthar et al. (Citation2020)), indicating that these students may be at risk of experiencing stress. Likewise, high-achieving students with high educational aspirations also report high levels of school stress (Stentiford et al., Citation2021). On the other hand, students in difficulties, including students at risk of not becoming eligible for higher educational levels, also report feelings of stigma, low self-worth, and fears regarding future marginalization (Hiltunen, Citation2017; Jackson, Citation2010; Sundelin et al., Citation2023). We are not aware of any qualitative study that has considered school stress in relation to race, ethnicity, or migration background.
The Swedish educational context
Education in Sweden is fully tax-funded and compulsory until school year 9, when students are typically 15–16 years old, and the vast majority of students also continue to upper secondary school. School is comprehensive with no achievement-based tracking of students into subjects, courses, or programs with different curricula until after school year 9. Achievement, as measured by school grades in school year 9, carries high stakes for Students in Sweden (Halapuu, Citation2021; Swedish Government Official Reports, Citation2019). Students must attain a passing grade in the core subjects (Swedish, English, and Mathematics) and at least 5 (for vocational programs) or 9 (for academic programs) additional passing grades to become eligible for upper secondary school. Among eligible students, slots in schools or programmes that the students apply for are rationed based on their school grades. During the study period, the vast majority (97–98%) of students continued to, but only 75–80% graduated from, upper secondary school (Swedish Government Official Reports, Citation2019).
The Swedish education system has undergone major changes over the last three decades. A first set of reforms concerned the management and responsibility of the education system and were implemented in the early 1990s. Key reforms include decentralization, with responsibility shifting from the central government to municipalities, and privatization and marketization, with the introduction of a school voucher system and a growing share of tax-funded independent and for-profit schools. Alongside growing residential segregation, the market-based system has contributed to greater social, ethnic, and achievement-based segregation of students across Swedish schools (Swedish Government Official Reports, Citation2019).
A second set of reforms around the years 2010–2013 introduced a stronger focus on the measurement of academic achievement. A new grading system was introduced, with a new grading scale that differentiated students based on evaluated achievement in a more fine-grained way. With the new grading scale came a non-compensatory grading practice where students’ final grades were disproportionately determined by their poorest evaluated achievements during the school year, meaning that a single “failure” in school could have substantial consequences for students. The first school year in which students were graded also changed from year 8 to year 6, resulting in schooling in these school years becoming more focused on testing and grading (Olovsson, Citation2015). Moreover, national testing was extended to earlier school years and to more subjects. Due to their large influence on the final subject grades that, in turn, determine access to upper secondary school, these were “high-stakes” national tests, and were also perceived as such by the students themselves (Olovsson, Citation2015). All in all, the reforms resulted in a large increase in the time spent on measuring and documenting students’ performance in school (Swedish National Agency for Education, Citation2015b).
A third set of reforms concerned access to upper secondary school. Formal eligibility requirements for national programs in upper secondary school were first introduced in the 1990s and were made stricter in 2011–2012, in both cases resulting in more students failing to become eligible (Halapuu, Citation2021; Swedish Government Official Reports, Citation2019). Ineligible students can access national programs and graduate from upper secondary school through alternative routes (i.e., individual programs), but evaluations show that the vast majority fail to do so and that the alternative routes are often dead ends (Halapuu, Citation2021; Swedish Government Official Reports, Citation2019). Related to this, starting in the 1990s, most upper secondary schools have gradually moved from accepting students based on proximity to opening for applicants from the wider municipality or region. Within this broader pool of potential applicants, grades have become the primary, or only, basis on which to accept student, and as a result applications to upper secondary schools have become more competitive (Swedish National Audit Office, Citation2018).
A fourth set of reforms concerned support for students in difficulties. In Sweden, most students in difficulties attend the general compulsory school, and only students with significant intellectual disability attend special schools for students with learning disabilities. A 2014 revision to the Education Act (Citation2010, p. 800) stipulated that students in difficulties should primarily be supported in the regular classroom and not receive special support in separate groups outside of the regular classroom. A new form of support, called additional adjustments and involving, for instance, digital aids or additional instructions in the classroom, was introduced. The result was that the share of students with special support (i.e., the more extensive form of support) was reduced by more than half after 2014 (Swedish National Agency for Education, Citation2015a). Related to this, the Education Act (Citation2010, p. 800) also stipulated that schools must provide access to medical, psychological, psychosocial, and special education competences, thereby strengthening students’ rights to access school health services.
Data and methods
We use linked survey and register data from Evaluation Through Follow-up (ETF). ETF is a repeated longitudinal survey of students in Sweden conducted by Statistics Sweden and the University of Gothenburg (Härnqvist, Citation2000; Svensson, Citation2011). A representative sample of around 10% of students enrolled in school year 3 in Sweden, or approximately 10,000 students, are regularly drawn with intervals of 5–6 years. The students are typically followed through surveys in year 6, year 9, and in upper secondary school. We include data on all cohorts for which we have information on school stress in years 6 and 9: the cohorts born in 1992, 1998, and 2004, with data collected between 2005 and 2020. The total sample size is close to 33,000 students, although this is reduced in some models due to a lack of data on key variables. It should be noted that not all students in these cohorts are born these exact years; however, grade repetition and advancement is uncommon in Sweden, and in our sample less than 5% of the students are born in other years.
For the 1992 cohort, a two-step stratified procedure was used, with municipalities as the primary, and school catchment areas as the secondary, sampling unit, and with strata based on municipal population size. For the 1998 cohort, a stratified sample of schools was drawn, with sampling probability proportional to number of students. A similar procedure was used for the 2004 cohort, but with an oversampling of independent (non-public) schools. All students belonging to a sampled school or school catchment area are invited to participate in the survey. Response rates in school year 6 were 82% (1992 cohort), 87% (1998), and 53% (2004), and in school year 9 58% (1992), 47% (1998), and 26% (2004). To reduce nonresponse bias and account for differential sampling probability, we use calibration weights that take additional information collected from administrative registers into account (cf. Klapp et al., Citation2023). The weighted analytical sample was largely similar to official statistics in terms of municipality size, school ownership (public or independent), socio-demographic characteristics (sex and migration background), and school grades, although with a somewhat higher year 9 grade point average in the 2004 cohort.
Dependent variable: school stress
We measure school stress using a single indicator. The question asked in school year 6 was “How do you feel in school?”, and in school year 9 “How do the following statements describe your situation in school?”, with “I feel stressed” as the focal item. Response alternatives in school year 6 were “Never”, “Almost never”, “Sometimes”, “Almost always”, and “Always”, and in school year 9 “Never/almost never”, “Rarely”, “Sometimes”, “Often”, and “Always/almost always”. The questions and response alternatives are identical across cohorts. In our data, the indicator is correlated with indicators related to worry in school (r = 0.49–0.50, depending on school year), and with indexes of health complaints (r = 0.52–0.57, depending on school year) and emotional distress (r = 0.53) (see Supplementary file C). The indicator is also similar to the indicator used in the Health Behaviour in School-Aged Children Survey (World Health Organization, Citation2020), and previous research using the indicator reports sufficient reliability (Giota & Gustafsson, Citation2017). Moreover, research by Lindblad et al. (Citation2008) shows good reliability and face validity of a similar global item (“I feel stressed”), though not specifically related to school, in adolescent samples in Sweden.
Independent variables
We are interested in temporal trends, as well as inequalities by school year, sex, socio-economic status, migration background, school difficulties, and school grades. We measure temporal trends by the three included cohorts – students born in 1992, 1998, and 2004 – and school year by including measures of the cohorts in both school year 6 (for the 1992, 1998, and 2004 cohorts) and school year 9 (for all cohorts). Students are typically 12–13 years old in school year 6 and 15–16 years old in school year 9. We measure sex by a binary variable (0 = boy; 1 = girl), and socio-economic status by the highest attained education of either parent of the student (1 = at least one parent with a university education; 0 = no parent with a university education). As for migration background, students are coded 1 ( = migrant) if either the student him/herself or at least one of the parents was born outside Sweden, and 0 otherwise. We measure school difficulties using information on special support. Students are coded as 1 (=student in difficulties) if they receive support in the form of special teaching groups, special tuition, reduced course load or remedial education, or if an action program has been established for the student, and 0 otherwise. We measure school grades as students’ grade point average in school year 9. Each subject in school can give at most 20 credits, and student’s 16 highest subject grades are summed at the end of school year 9. The 2004 cohort could include an additional subject grade for modern languages. The final grade thus ranges between 0 and 320, or 340 for the 2004 cohort. We transform this into percentile ranks within each cohort in order account for grade inflation over time (Swedish Government Official Reports, Citation2019) and refer to this as the student’s grade point average percentile. School grades thus reflect students’ teacher-evaluated achievement relative to their peers in the same cohort. Data on all independent variables are drawn from administrative registers and linked to the survey measures.
Summary statistics on the sample and on all included variables are presented in Supplementary file A.
Empirical analysis
Unadjusted regression models to compute average levels of stress across groups are sufficient to address the descriptive aim of the study (Hernán, Citation2018). To reduce model complexity, we opted for a series of three-way interaction terms, with cohort interacted with school year and, respectively, sex, socio-economic status, migration background, and school difficulties. School grades are, with the exception of the 2004 cohort, only available in school year 9 and are therefore analysed in a separate model. We pool the data for all cohorts and school years and estimate ordinary least squares (linear) regression models of the following form:
(model 1)
(model 1)
(model 2)
(model 2) where the subscript
denotes students, y denotes school years, and c denotes cohorts.
represents school stress in student s in school year y and cohort c. In model 1,
represent the main effects of cohort (C), school year (Y), and the respective moderator variable (M; sex, socio-economic status, migration background, or school difficulties, respectively).
represent the two-way interactions terms, and
the three-way interaction term, between cohort, school year, and the respective moderator variables. In model 2,
represents the main effect of cohort (C) and
represents the interaction term between cohort and school grades. We use a third-degree polynomial for school grades, hence grades3, to account for possibly non-linear associations between school grades and stress (Högberg, Citation2023).
is an overall intercept and
or
are individual-specific error terms. Model 1 thus estimates differences in stress by cohort and school year, and, respectively, sex, socio-economic status, migration background, and school difficulties. Model 2 estimates non-linear associations between cohort and school grades in year 9.
Results
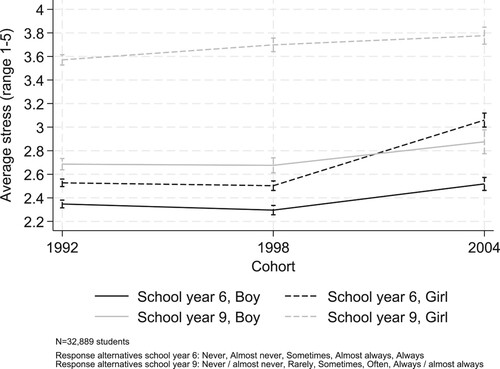
We display the results graphically to facilitate interpretation, with the exact regression coefficients presented in Supplementary file B. The lines show predicted average levels of stress for different groups, estimated from models 1 or 2, with stress on the y-axes and differences across cohorts on the x-axes. The vertical bars show 95% confidence intervals. presents results for sex. Within each school year, girls experience more stress than boys, and within each sex, students experience more stress in school year 9 than in school year 6. In both school years, stress increased significantly more for girls than for boys, although the increase in the inequality was larger in school year 6. The 2004 cohort was the first cohort in our data to be graded in school year 6, and the result in can be interpreted as indicating that earlier grading led to higher stress, especially for girls.
Figure 1. School stress by cohort, school year, and sex.
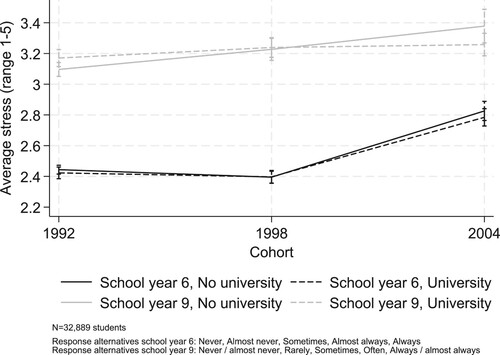
shows that socio-economic inequalities, as measured by differences based on the highest attained education of either parent, in stress are generally small or non-existent. In school year 6, socio-economic inequalities remained constant and virtually non-existent throughout the period, indicating that earlier grading did not differentially affect students depending on their social background. In school year 9, however, stress increased significantly more in students with a lower socio-economic background from the 1992 cohort onwards, resulting in a modest increase in the degree of socio-economic inequality.
Figure 2. School stress by cohort, school year, and parental educational attainment.
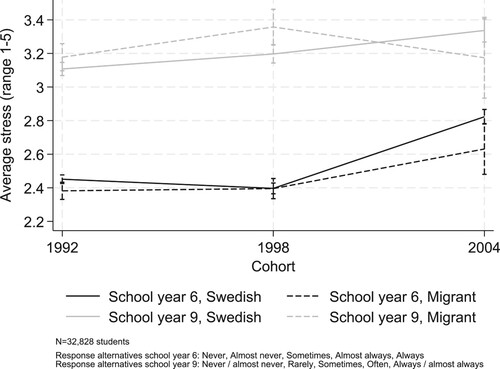
shows that inequalities based on migration background are fairly small and not consistent across cohorts and/or school years. In school year 6, the increase in stress in the 2004 cohort was somewhat, but not significantly, larger for students with Swedish background. In school year 9, the increase between the 1992 and 1998 cohorts was also somewhat, but not significantly, larger in students with migrant background, but between the 1998 and 2004 there was a reversed pattern with a significantly larger increase in students with Swedish background. Overall, it is difficult to speak of general trends in inequalities in stress by migration background.
Figure 3. School stress by cohort, school year, and migration background.
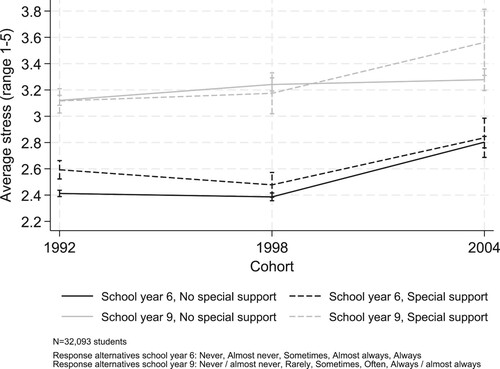
shows inequalities based on school difficulties, measured by special support. In school year 6, stress increased somewhat, though not significantly, less in students in difficulties, but the changes in stress were mostly similar for both groups of students. In school year 9, however, stress increased significantly more in students in difficulties between the 1998 and 2004 cohorts, and in 2004 students in difficulties needs for the first time experienced significantly higher levels of stress compared to their peers in school year 9.
Figure 4. School stress by cohort, school year, and school difficulties.
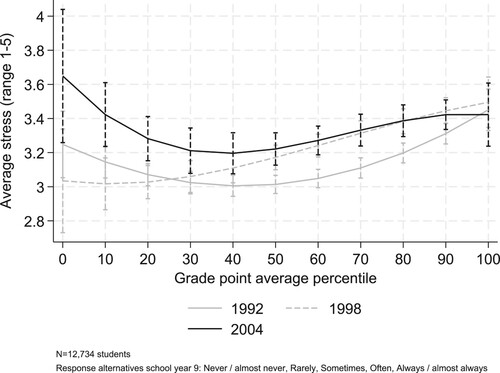
shows inequalities based on school grades, measured by grade point average percentile in school year 9. The 1992 cohort exhibited a U-shaped association between school grades and stress, with higher levels in students with low and (especially) high grades and more modest levels in students in the middle of the distribution. In the 1998 cohort, stress increased in students with medium to high grades but decreased somewhat in students with the lowest grades, resulting in a more linear association with the highest levels of stress observed in the students with high grades. In the 2004 cohort, there was a large increase in stress in students with low grades but stable levels among students with high grades, resulting in a return to a U-shaped association between grades and stress but this time more tilted towards the lower end of the distribution. The 2004 cohort was the first cohort in which students with low grades were, on average, more stressed than peers with high grades.
Figure 5. School stress by cohort, school year, and school grades.
Supplementary analyses
The Supplemental online materials present the results of a range of additional and robustness analyses. Supplementary file D shows that the results are mostly similar if we dichotomize stress with “Always” (school year 6) and “Always/almost always” (school year 9) coded 1, and the other response alternatives coded 0. A partial exception concerns school difficulties and school grades, where the increase in stress in students in difficulties and students with low grades becomes even more pronounced for the 2004 cohort. This indicates that the increase in the most severe form of stress has been concentrated in the most disadvantaged students. Supplementary file E shows that the results are also mostly similar when we replace stress with a set of indicators measuring worry in relation to school as the dependent variable. Supplementary file F shows that the results are similar if we use multilevel models, with random intercepts for the school-level, instead of ordinary least squares regression. Supplementary file G shows that a more fine-grained categorization of migration background – distinguishing between students with a Swedish, Nordic, European, and non-European background – does not reveal any systematic patterns regarding trends in stress. Supplementary files H shows average values of stress by survey year and school year, not moderated by sex, socio-economic status, migration background, school difficulties, or grades, and including the 1987 cohort in school year 9. Although causal conclusions are not possible given the data, the results are consistent with previous research showing rising rates of school stress or declining well-being, especially in school year 6 but also in school year 9, following the 2010–2013 educational reforms (Högberg et al., Citation2019; Klapp et al., Citation2023; Linder et al., Citation2023). Supplementary file I shows that, while missing data on school stress is related to school grades and socio-demographic characteristics of students, the results are mostly similar if we use multiple imputation models to account for missing data on stress or covariates. More extensive descriptions of the supplementary analyses are provided in the Supplemental online material.
Discussion
Against a background of generally increasing levels of school stress but a lack of knowledge regarding differences across groups of students, the aim of this study was to investigate temporal trends in school stress across three cohorts of students in Sweden (born 1992, 1998, and 2004), with a focus on inequalities by school year, sex, socio-economic status, migration background, school difficulties, and school grades. We highlight three major findings.
First, concerning school year, we observed a greater increase in stress in the 2004 cohort for students in school year 6 (12–13 years old) than for students in school year 9 (15–16 years old). Since the 2004 cohort was also the first to receive formal end-of-year grades in school year 6, this indicates that formal grading – and the overall more intensive focus on the measurement of achievement that follows from this, which in the Swedish case included the introduction of large-scale national testing in grade 6 – may increase stress (see also Supplementary file H). This finding is in line with previous Swedish studies using other measures related to well-being or mental health (Högberg et al., Citation2019; Klapp et al., Citation2023; Linder et al., Citation2023). On a more general level, the finding also supports the conclusion of several qualitative papers that the measurement of achievement – such as grading, testing, or other forms of assessments – is among the most stressful aspects of the school environment, especially when these measurements carry high stakes for students (Banks & Smyth, Citation2015; Denscombe, Citation2000; Eriksen, Citation2021). Although grades are not particularly consequential for students in year 6, it seems likely that the later importance of grades “spills over” to the perceptions of younger students (Olovsson, Citation2015).
Second, in line with previous studies (Högberg et al., Citation2020; Löfstedt et al., Citation2020), school stress increased more for girls than for boys, resulting in growing inequalities in stress over time. The finding that inequalities grew more in school year 6 than in school year 9 indicates that the effect of earlier grading on school stress was stronger for girls, corroborating previous qualitative findings that girls are more sensitive to stressors related to academic achievement (Krogh, Citation2022; Stentiford et al., Citation2021). Overall, sex-based inequalities in stress were clearly larger, and the increase in sex-based inequality more consistent, than corresponding inequalities by socio-economic status or migration background.
A third set of important findings concerned the growing importance of school difficulties and low school grades for stress in the 2004 cohort and for students in school year 9. From the 1998 to 2004 cohorts, school stress increased markedly in students in difficulties and, especially, students with low grades, such that the 2004 cohort was the only cohort in which these groups had higher levels of stress than their peers in less difficulties or with higher grades in school year 9. This was particularly apparent for more severe levels of stress (see Supplementary file D). Greater levels of stress over time in these groups are in line with previous Swedish studies showing poorer well-being over time in students with low cognitive ability (Klapp et al., Citation2023). Related to this, the U-shaped relationship between school grades and stress – where students with both low and high grades experienced relatively high levels of stress, while students in the middle of the distribution experienced the lowest levels of stress – observed in two of the cohorts corroborates previous quantitative research on achievement and mental health (Högberg, Citation2023) and suggests a “goldilocks relationship” whereby schooling can generate stress at both ends of the achievement distribution (Giota & Gustafsson, Citation2017). A U-shaped relationship may result from the fact that both under- and overstimulation can generate stress (Frankenhaeuser, Citation1986). In a comprehensive school setting without ability grouping, and thus with a heterogeneous student body in terms of ability, demands may be too high for low-ability students, resulting in overstimulation, and too low for high-ability students, resulting in understimulation. Alternatively, understimulated students may cope with school demands through cynicism and detachment, resulting in low grades, while overstimulated students may cope by working hard, resulting in high grades (cf. Salmela-Aro et al., Citation2009). Qualitative studies suggest a complementary set of mechanisms behind the goldilocks relationship: low-achieving students often describe stigma and fear regarding future marginalization while high-achieving students speak of high educational ambitions and a performance-based self-esteem (Eriksen, Citation2021; Hiltunen, Citation2017; Stentiford et al., Citation2021).
The aim of the study was descriptive, and we plan to investigate the causes of the inequalities and trends in school stress uncovered in this paper in subsequent research. Nonetheless, some tentative hypotheses may be discussed already at this stage. The general increase in school stress on average across cohorts may be understood against the growing importance of educational credentials for labour market opportunities in modern knowledge economies and for overall social status in the “schooled society” (Baker, Citation2011; van Noord et al., Citation2021). The more important education becomes for success in other societal arenas, the higher the stakes involved in schooling, and, it seems plausible to hypothesize, the more stressful the spectre of academic failure becomes. Although at the individual level, higher educational aspirations and expectations are associated with better mental health in Sweden (Almroth et al., Citation2018), American research indicates that contextual-level aspirations or expectations may have an opposite effect, with the disconnect between rising expectations and lagging attainment generating distress in students (Luthar et al., Citation2020). There are, however, to our knowledge no studies documenting trends in educational expectations or aspirations in Sweden.
It is also possible that specific educational reforms have contributed to greater stress. Students in school year 9 were exposed to a more competitive grades-based system of application to upper secondary school (gradually over the period), a new grading system (in 2012–2013) and stricter eligibility criteria (in 2011–2012). Taken together, these reforms generated a stronger focus on, and also raised the stakes attached to, achievement and grades (Swedish National Agency for Education, Citation2015b). It seems less plausible, however, that the disproportionate increase in stress observed among students in difficulties or with low grades in the 2004 cohort is attributable to this set of reforms, at least not immediately and directly. The 1998 cohort was in school year 9 surveyed in the spring semester of 2014, and had by then already been exposed to the new grading system and stricter eligibility criteria. To the extent that these reforms did have an effect on stress (see Collins & Lundstedt, Citation2021), it appears to have been the students with high grades that suffered. However, the changes of, or cutbacks in, special support for students in difficulties only took effect after 2014 and may thus have contributed to the disproportionate increase in stress in students in difficulties or with low grades in this cohort. A tentative hypothesis is that the combination of greater demands, in terms of a stronger focus on achievement and grading, and less support, in terms of cutbacks in the more comprehensive special support, produced a mix of stressors that was particularly difficult for students who already struggled in school.
Naturally, other aspects besides achievement-related concerns – both within (e.g., more challenging curricula) and outside (e.g., hormones or friendships) of school – can generate stress in adolescents, and the present study cannot on empirical grounds adjudicate between alternative explanations of the results. Not least, the 2004 cohort was in school year 9 surveyed in the early phase of the Covid 19 pandemic. Although Swedish compulsory school did not close or move to remote learning during this phase, it seems plausible that the pandemic acted as a stressor for students, and possible that students in difficulties or students with low grades were disproportionally affected. Moreover, although the stress item used in the study is positively related with health complaints and emotional distress (see Supplementary file C), it should be underscored that not all stress is harmful, and in qualitative studies some students report that grades make them more motivated (Olovsson, Citation2015).
Limitations
The results of the study should be viewed in light of its limitations. First, we could only measure school stress with a single indicator. However, single items can improve response rates, and research by Lindblad et al. (Citation2008) shows good reliability and face validity of a similar item in adolescent samples in Sweden. Moreover, the results were broadly similar when using a set of indicators measuring worry in relation to school as the dependent variable. Relatedly, while our self-reported measure of school stress is advantageous in that stress is at least partly a subjective experience, it can also be affected by differences in reference frames across groups. It would have been desirable to include on a broader set of related constructs, such as common mental or somatic manifestations of stress (see Östberg et al., Citation2015). Second, we could only measure socio-economic status with highest education of either parent. It is possible that parental income, or mothers’ and fathers’ levels of education taken separately, have different implications. Third, the response rates in both school years declined over the period. Although calibration weights as well as multiple imputation models were used to account for this, we cannot rule out that differential selection into the sample is associated with stress, which in turn can lead to biased estimates of the prevalence of stress across or within cohorts. Fourth, the aim of the paper was descriptive, and we did not include any covariates to adjust for confounding, nor use any quasi-experimental methods for causal inferences. All discussion regarding the causes of the trends and inequalities observed in this paper should thus be viewed as tentative hypotheses to be tested in subsequent research.
Conclusion and implications
This study presented three primary findings concerning temporal trends and inequalities in school stress in three cohorts of students in Sweden between 2005 and 2020. First, school stress increased more in school year 6 than in school year 9 after the introduction of formal grading in lower school years, supporting previous findings showing that formal grading can negatively affect well-being in students. Second, school stress increased more for girls than for boys, especially in school year 6, indicating that girls may be more sensitive to stressors related to academic achievement. Overall, inequalities by sex were clearly larger, and the increase in inequality by sex more consistent, than corresponding inequalities by socio-economic status or migration background. Third, in the most recent cohort, school stress increased substantially in students in difficulties and, especially, students with low grades, resulting in these groups for the first time reporting higher levels of stress than their peers in less difficulties or with higher grades.
These findings have implications for educational research and policy. Considering the negative associations between school stress and mental health and well-being more broadly (Anniko et al., Citation2019; García-Moya et al., Citation2021; Salmela-Aro et al., Citation2009; Tharaldsen et al., Citation2022), rising levels of stress, especially in vulnerable students that already face hardship in school, ought to be a concern for policymakers interested in social equality and non-academic outcomes in schools. Research and policy should thus monitor how (inequalities in) school stress and school-related mental health or well-being evolve in the future, as well as seek to understand why these vary over time and across groups. There is to date virtually no research on the underlying determinants of the temporal increase in school stress observed in many countries, and, with the exception of sex and age (Giota & Gustafsson, Citation2017), very little research on the causes of different forms of inequalities in school stress. Not least, understanding the growing importance of low school grades and school difficulties for stress, but also the comparatively high levels of stress observed in students with high grades, is urgent. The “goldilocks relationship” indicates that both low- and high-achieving students should be targeted for preventive work in schools. However, if the mechanisms that generate stress in these groups differ, different types of interventions may be needed at opposite ends of the achievement distributions.
Code availability
The Stata code for the replication of the results from this paper will be made available on the OSF platform after publication.
Supplemental Material
Download MS Word (455.9 KB)Acknowledgements
This work was supported by the Swedish Research Council for Health, Working Life and Welfare under grant number 2022-01062.
Disclosure statement
No potential conflict of interest was reported by the author(s).
Additional information
Funding
References
- Almroth, M. C., László, K. D., Kosidou, K., & Galanti, M. R. (2018). Association between adolescents’ academic aspirations and expectations and mental health: A one-year follow-up study. European Journal of Public Health, 28(3), 504–509. https://doi.org/10.1093/eurpub/cky025
- Anniko, M. K., Boersma, K., & Tillfors, M. (2019). Sources of stress and worry in the development of stress-related mental health problems: A longitudinal investigation from early- to mid-adolescence. Anxiety, Stress, & Coping, 32(2), 155–167. https://doi.org/10.1080/10615806.2018.1549657
- Anniko, M. K., Boersma, K., van Wijk, N. P. L., Byrne, D., & Tillfors, M. (2018). Development of a Shortened Version of the Adolescent Stress Questionnaire (ASQ-S): Construct validity and sex invariance in a large sample of Swedish adolescents. Scandinavian Journal of Child and Adolescent Psychiatry and Psychology, 6(1), 4–15. https://doi.org/10.21307/sjcapp-2018-001
- Baker, D. P. (2011). Forward and backward, horizontal and vertical: Transformation of occupational credentialing in the schooled society. Research in Social Stratification and Mobility, 29(1), 5–29. https://doi.org/10.1016/j.rssm.2011.01.001
- Bakken, A., Sletten, M. A., & Eriksen, I. M. (2018). Generasjon prestasjon? Ungdoms opplevelse av press og stress. Tidsskrift for Ungdomsforskning, 18(2), 45–75.
- Banks, J., & Smyth, E. (2015). ‘Your whole life depends on it’: academic stress and high-stakes testing in Ireland. Journal of Youth Studies, 18(5), 598–616. https://doi.org/10.1080/13676261.2014.992317
- Byrne, D. G., Davenport, S. C., & Mazanov, J. (2007). Profiles of adolescent stress: The development of the adolescent stress questionnaire (ASQ). Journal of Adolescence, 30(3), 393–416. https://doi.org/10.1016/j.adolescence.2006.04.004
- Collins, M., & Lundstedt, J. (2021). The long-term consequences of more informative grading (Lund papers in economic demography 2021:1). Lund University.
- Cosma, A., Stevens, G. W. J. M., Vollebergh, W. A. M., & De Looze, M. (2022). Time trends in schoolwork pressure among Dutch adolescents, 2001–2017: Gender and educational differences. Scandinavian Journal of Public Health, 50(5), 538–541. https://doi.org/10.1177/14034948211018388
- Denscombe, M. (2000). Social Conditions for Stress: Young people's experience of doing GCSEs. British Educational Research Journal, 26(3), 359–374. https://doi.org/10.1080/713651566
- Education Act (SFS 2010:800). (2010). Utbildningsdepartementet.
- Eriksen, I. M. (2021). Class, parenting and academic stress in Norway: Middle-class youth on parental pressure and mental health. Discourse: Studies in the Cultural Politics of Education, 42(4), 602–614. https://doi.org/10.1080/01596306.2020.1716690
- Frankenhaeuser, M. (1986). A psychobiological framework for research on human stress and coping. In M. H. Appley & R. Trumbull (Eds.), Dynamics of stress. Physiological, psychological and social perspectives (pp. 101–113). Plenum Press.
- García-Moya, I., Corell, M., Paniagua, C., Vaez, M., & Löfstedt, P. (2021). School stress and health complaints: Testing the adolescent stress questionnaire in Spain and Sweden. European Journal of Public Health, 31(Supplement_3).
- Giota, J., & Gustafsson, J.-E. (2017). Perceived demands of schooling, stress and mental health: Changes from grade 6 to grade 9 as a function of gender and cognitive ability. Stress and Health, 33(3), 253–266. https://doi.org/10.1002/smi.2693
- Giota, J., & Gustafsson, J.-E. (2021). Perceived academic demands, peer and teacher relationships, stress, anxiety and mental health: Changes from grade 6 to 9 as a function of gender and cognitive ability. Scandinavian Journal of Educational Research, 65(6), 956–971. https://doi.org/10.1080/00313831.2020.1788144
- Halapuu, V. (2021). Access to education and disability insurance claims (IFAU working paper 2021:17). Institutet för arbetsmarknads- och utbildningspolitisk utvärdering.
- Härnqvist, K. (2000). Evaluation through follow-up. A longitudinal program for studying education and career development. In C.-G. Janson (Ed.), Seven Swedish longitudinal studies in behavioural science (pp. 76–114). Forskningsrådsnämnden.
- Hernán, M. A. (2018). The C-word: Scientific euphemisms Do Not improve causal inference from observational data. American Journal of Public Health, 108(5), 616–619. https://doi.org/10.2105/AJPH.2018.304337
- Hiltunen, L. (2017). Lagom perfekt: erfarenheter av ohälsa bland unga tjejer och killar. Arkiv förlag.
- Högberg, B. (2023). Academic performance, performance culture, and mental health: An exploration of non-linear relationships using Swedish PISA data. Scandinavian Journal of Educational Research, 1–16. https://doi.org/10.1080/00313831.2023.2192752
- Högberg, B., Lindgren, J., Johansson, K., Strandh, M., & Petersen, S. (2021). Consequences of school grading systems on adolescent health: Evidence from a Swedish school reform. Journal of Education Policy, 36(1), 84–106. https://doi.org/10.1080/02680939.2019.1686540
- Högberg, B., Strandh, M., & Hagquist, C. (2020). Gender and secular trends in adolescent mental health over 24 years – The role of school-related stress. Social Science & Medicine, 250, 112890. https://doi.org/10.1016/j.socscimed.2020.112890
- Jackson, C. (2010). Fear in education. Educational Review, 62(1), 39–52. https://doi.org/10.1080/00131910903469544
- Keyes, K. M., & Platt, J. M. (2023). Annual Research Review: Sex, gender, and internalizing conditions among adolescents in the 21st century – Trends, causes, consequences. Journal of Child Psychology and Psychiatry, 65, 384–407. https://doi.org/10.1111/jcpp.13864
- Klapp, T., Klapp, A., & Gustafsson, J.-E. (2024). Relations between students’ well-being and academic achievement: evidence from Swedish compulsory school. European Journal of Psychology of Education, 39(1), 275–296. https://doi.org/10.1007/s10212-023-00690-9
- Krogh, S. C. (2023). “It’s just performance all the time”: early adolescents’ accounts of school-related performance demands and well-being. Scandinavian Journal of Educational Research, 67(3), 463–476. https://doi.org/10.1080/00313831.2021.2021446
- Landstedt, E., & Gådin, K. G. (2012). Seventeen and stressed – Do gender and class matter? Health Sociology Review, 21(1), 82–98. https://doi.org/10.5172/hesr.2012.21.1.82
- Lindblad, F., Backman, L., & Åkerstedt, T. (2008). Immigrant girls perceive less stress. Acta Paediatrica, 97(7), 889–893. https://doi.org/10.1111/j.1651-2227.2008.00857.x
- Linder, A., Gerdtham, U.-G., & Heckley, G. (2023). Child mental health: Impact of introducing earlier compulsory school grades [Department of Economics, Working Paper No. 2023:2]. Lund University.
- Löfstedt, P., García-Moya, I., Corell, M., Paniagua, C., Samdal, O., Välimaa, R., Lyyra, N., Currie, D., & Rasmussen, M. (2020). School satisfaction and school pressure in the WHO European region and North America: An analysis of time trends (2002–2018) and patterns of Co-occurrence in 32 countries. Journal of Adolescent Health, 66(6), S59–S69. https://doi.org/10.1016/j.jadohealth.2020.03.007
- Luthar, S. S., Kumar, N. L., & Zillmer, N. (2020). High-achieving schools connote risks for adolescents: Problems documented, processes implicated, and directions for interventions. American Psychologist, 75(7), 983–995. https://doi.org/10.1037/amp0000556
- Merton, R. K. (1987). Three fragments from a sociologist's notebooks: Establishing the phenomenon, specified ignorance, and strategic research materials. Annual Review of Sociology, 13(1), 1–29. https://doi.org/10.1146/annurev.so.13.080187.000245
- Nygren, G. (2021). Jag vill ha bra betyg En etnologisk studie om höga skolresultat och högstadieelevers praktiker [Dissertation]. Uppsala University.
- Olovsson, T. (2015). Det kontrollera(n)de klassrummet. Bedömningsprocessen i svensk grundskolepraktik i relation till införandet av nationella skolreformer [Dissertation]. Umeå University.
- Östberg, V., Almquist, Y. B., Folkesson, L., Låftman, S. B., Modin, B., & Lindfors, P. (2015). The complexity of stress in Mid-adolescent girls and boys. Child Indicators Research, 8(2), 403–423. https://doi.org/10.1007/s12187-014-9245-7
- Perming, C., Thurn, Å., Garmy, P., & Einberg, E.-L. (2022). Adolescents’ experience of stress: A focus group interview study with 16–19-year-Old students during the COVID-19 pandemic. International Journal of Environmental Research and Public Health, 19(15), 9114. https://doi.org/10.3390/ijerph19159114
- Salmela-Aro, K., Kiuru, N., Leskinen, E., & Nurmi, J.-E. (2009). School burnout inventory (SBI). European Journal of Psychological Assessment, 25(1), 48–57. https://doi.org/10.1027/1015-5759.25.1.48
- Salmela-Aro, K., Kiuru, N., & Nurmi, J. (2008). The role of educational track in adolescents' school burnout: A longitudinal study. British Journal of Educational Psychology, 78(4), 663–689. https://doi.org/10.1348/000709908X281628
- Sonmark, K., Godeau, E., Augustine, L., Bygren, M., & Modin, B. (2016). Individual and contextual expressions of school demands and their relation to psychosomatic health a comparative study of students in France and Sweden. Child Indicators Research, 9(1), 93–109. https://doi.org/10.1007/s12187-015-9299-1
- Spencer, R., Walsh, J., Liang, B., Mousseau, A. M. D., & Lund, T. J. (2018). Having it all? A qualitative examination of affluent adolescent girls’ perceptions of stress and their quests for success. Journal of Adolescent Research, 33(1), 3–33. https://doi.org/10.1177/0743558416670990
- Stentiford, L., Koutsouris, G., & Allan, A. (2023). Girls, mental health and academic achievement: a qualitative systematic review. Educational Review, 75(6), 1224–1254. https://doi.org/10.1080/00131911.2021.2007052
- Sundelin, Å., Lindgren, J., & Lundahl, L. (2023). Young people’s stories of school failure and remedial trajectories – Clues to prevention of school absenteeism and early school leaving. European Education, 55(3–4), 202–215. https://doi.org/10.1080/10564934.2023.2251023
- Svensson, A. (2011). Utvärdering Genom Uppföljning. Longitudinell individforskning under ett halvsekel (Gothenburg studies in educational sciences 305). University of Gothenburg.
- Swedish Government Official Reports. (2019). Jämlikhet i möjligheter och utfall i den svenska skolan (SOU 2019:40).
- Swedish National Agency for Education. (2015a). Särskilt stöd i grundskolan (Dnr. 2015:01339). Skolverket.
- Swedish National Agency for Education. (2015b). Skolreformer i praktiken. Skolverket.
- Swedish National Audit Office. (2018). Långsiktiga effekter av utökade valmöjligheter till gymnasieskolan – från närhetsprincip till betygsprincip (2018:28). Riksrevisionen.
- Sweeting, H., West, P., Young, R., & Der, G. (2010). Can we explain increases in young people’s psychological distress over time? Social Science & Medicine, 71(10), 1819–1830. https://doi.org/10.1016/j.socscimed.2010.08.012
- Tharaldsen, K. B., Tvedt, M. S., Caravita, S. C. S., & Bru, E. (2023). Academic stress: Links with emotional problems and motivational climate among upper secondary school students. Scandinavian Journal of Educational Research, 67(7), 1137–1150. https://doi.org/10.1080/00313831.2022.2116480
- van Noord, J., Spruyt, B., Kuppens, T., & Spears, R. (2023). In the shadow of the schooled society: Feelings of misrecognition and the education ladder. Social Problems, 70(3), 831–848. https://doi.org/10.1093/socpro/spab034
- World Health Organization.(2020). Spotlight on adolescent health and well-being. Findings from the 2017/2018 Health Behaviour in School-aged Children (HBSC) survey in Europe and Canada. In International Report. Volume 2. Key data, 1–139.