
 ?Mathematical formulae have been encoded as MathML and are displayed in this HTML version using MathJax in order to improve their display. Uncheck the box to turn MathJax off. This feature requires Javascript. Click on a formula to zoom.
Abstract
In many countries, school attendance starts on a fixed date. In contrast, New Zealand uses rolling admissions and children can start school throughout the year, right after their fifth birthday. However, children turning five during a school holiday need to wait until the start of the following teaching term. This system generates an exogenous variation in the amount of time spent in primary school and enables us to estimate the causal effects of early schooling, independent from the effects of age. Using rich microdata on all high school leavers in New Zealand from 2009 to 2016, we find that an additional month of early schooling increases the probability of achieving a top high school certificate by 6% and qualifying for university entrance by 5%. These are large long-term effects.
1. Introduction
The main objective of this paper is to make use of an unusual school start policy at the age of five to study the effects of early schooling opportunities on later educational outcomes at the end of high school. Specifically, we use data from New Zealand and exploit an exogenous variation in the amount of time spent in primary school to estimate the causal effects of early schooling independent from the effects of age.
Unlike in many other developed countries such as the USA, UK, Canada, most of the European Union, and Australia, where primary school attendance starts for all children on a specific date (e.g. in early September), children in New Zealand start school throughout the year, typically right after their fifth birthday. If a child’s fifth birthday is between January and May, she will typically join a Year 1 class, spend the rest of the year there, and move on to Year 2 the following February.Footnote1 If her birthday is between June and December, she will usually spend the rest of the year in Year 0 and then the entire next year in Year 1. This means that the date of birth affects the amount of time spent in primary school and may further result in different educational outcomes. Because of school holidays – and the discrete change in class allocation of children born in May vs. June – the amount of time spent by a child in school is not a linear function of her age and so its unique impacts can be isolated in our empirical specification.
Our study hence makes an important contribution to international literature on the (causal) returns to education. We also complement previous studies by analysing the long-term impacts of early formal schooling. Finally, to our knowledge, this is the first study of its kind in New Zealand and so could inform a local policy debate about the consequences of this unique school start policy.
Our empirical analysis suggests that the effects of early schooling opportunities are relatively large and long-lasting. Specifically, using rich microdata on all high school leavers in New Zealand from 2009–2016, we find that an additional month of primary schooling increases the probability of achieving a top high school certificate by 6% and qualifying for university entrance by 5%. Thus, for an average child, the early school environment significantly facilitates human capital accumulation and lays foundations for later academic achievement. By extension and keeping in mind that every child is different, our study can be used to measure the average costs of delaying a child’s school start – or of missing the opportunity to be in school for another reason.
The rest of the paper is organised as follows: Section 2 reviews previous literature on the consequences of early schooling enrolment policies and Section 3 provides background on the New Zealand education system. Section 4 describes our data and Section 5 explains our identification strategy in detail. Sections 6 and 7 present our main results and several robustness and subsample-analyses. Section 8 concludes.
2. Literature review
There are three different aspects of school start that have been examined previously in regards to the effects of an individual’s birth date on educational achievement. The first is the effect of absolute age where children start school at a different stage of their cognitive and social development. The second focuses on the relative age of children starting school compared to their peers/classmates. Finally, and most importantly for our purposes, there is the causal effect of schooling on educational outcomes.
A number of studies find considerably better academic achievement among children starting school at an older age. These benefits are present soon after primary school/kindergarten entry (Datar, Citation2006; Elder & Lubotsky, Citation2009; Lubotsky & Kaestner, Citation2016) as well as towards the end of secondary school and at college/university entrance (Bedard & Dhuye, Citation2006; Crawford, Dearden, & Greaves, Citation2013; Strøm, Citation2004). Some studies even find benefits extending into labour market success (Frederiksson & Öckert, Citation2014; Kawaguchi, Citation2011). However, the positive effects of older age at school start are not observed universally (Zhang, Zhong, & Zhang, Citation2017), and this is especially the case when years of educational attainment are the outcome of interest (Angrist & Krueger, Citation1992; Black, Devereux, & Salvanes, Citation2011; Dobkin & Ferreira, Citation2010; McCrary & Royer, Citation2011).
Focusing specifically on relative age effects while holding own (absolute) age constant, Cascio and Schanzenbach (Citation2016) find that having older kindergarten classmates improves educational outcomes in subsequent years and even increases the probability of taking a college-entry exam.
It is clear from the above literature that age may play a significant role in academic achievement and it is hence important to control for students’ age in our analyses. However, given the fixed school start date in most countries, the above articles cannot (i) examine whether gradual admission into early primary education – at a given age – eliminates the effect of a student’s date of birth on later educational achievement or (ii) study the causal effect of the time spent in school in early years on later outcomes. These issues are our main focus.
There are a few studies that try to estimate the causal effect of time spent in school on educational outcomes, using different identification techniques. Some use data on students of the same age but in different grades, i.e. comparable cognitive skills but a different level of education, while others (like us) use a unique school system that allows students to enter school at a certain age instead of a certain date.
Cahan and Cohen (Citation1989) estimate the effects of time spent in school for students in grades 4–6 in Israel by measuring the difference in the mean predicted scores between the oldest student in a grade and the youngest student in the higher adjacent grade. They conclude that the effect of an additional year of schooling is on average about twice as large as the effect of being a year older.
Cliffordson and Gustafsson (Citation2008) estimate the effects of both age and schooling on various aspects of intellectual performance in Sweden. They base their analysis on test scores from military enlistment at age 18. The tests occur on different dates throughout the year which gives differences in both age and length of schooling among individuals at the time of the test. The authors find that both schooling and age generally increase performance, with the effect of schooling being considerably larger than the effect of age.
Most relevant to our study, Leuven, Lindahl, Oosterbeek, and Webbink (Citation2010) evaluate the effect of opportunities for early enrolment in school on later achievement using a novel quasi-experimental strategy. They exploit two distinct features of the Dutch schooling system. One is their rolling admissions policy; i.e. children do not have to wait to start primary school on a particular date, they can start right after their fourth birthday. Second, children with birthdays during or right after school holidays start at the same time (at the beginning of the next term) and are put in the same class. The authors use the resulting exogenous variation in children’s enrolment opportunities to identify their effects on test scores two years later, at the age of six. They conclude that an additional month of schooling for disadvantagedFootnote2 children increases their arithmetic test scores by five percent of a standard deviation and their language test scores by six percent of a standard deviation. The study finds no effects for non-disadvantaged children.
Ali and Menclova (Citation2018) replicate Leuven et al. (Citation2010) and find positive effects of the time spent in school for both disadvantaged and non-disadvantaged children.
In this paper, we adopt the identification strategy from Leuven et al. (Citation2010) but focus on longer-term effects of early schooling, measured towards the end of high school and at university entry.
3. Background
Even though schooling in New Zealand is only compulsory from the age of six (to 16), the norm is for children to start school right after their fifth birthday. As will be explained in detail below, the timing of birth then directly affects how much time an individual spends in early primary education.
This study focuses on the effects of early primary education on secondary school achievement and entry into tertiary education. Our sample consists of high school leavers from years 2009–2016; that is, individuals who turned five in around 1996–2005. Before entering primary school, most of these children had attended an early childhood education centre and so it is best to think of this as the ‘counterfactual’ to primary school entry.
Specifically, in 2001, a total of 171,333 children were enrolled in licensed services such as kindergartens (89%) or licence-exempt early childhood education groups such as playgroups (11%).Footnote3 This represents 61% of the under-five population in that year.Footnote4 Among three- and four-year-olds, who are considered pre-schoolers, enrolment in early childhood education has been significantly higher. For example, in 2004, 85% of three-year-olds and 97% of four-year-olds used a licensed early childhood education service.Footnote5 However, many children attended part-time. In 2004, the average enrolment was for around 14 h per week among three-year-olds and 17 h per week among four-year-olds. Concerns about financial barriers to more intensive utilisation lead to a 2004 announcement that the government will pay for 20 hours per week free early childhood education, led by a qualified and registered early childhood teacher, for all three- and four-year-olds (Bouchard, Cheung, & Pacheco, Citation2021). This got implemented in July 2007, after our study window, but signals that families of lower socio-economic status in particular had previously faced financial barriers in accessing a greater ‘quantity’ of early childhood education. This may contribute to differential effects of early time spent in primary school among children from different socio-economic backgrounds, an issue we revisit later.
While a large majority of pre-schoolers in New Zealand use licensed early childhood education services (e.g. 97% of four-year-olds in 2004) and this is, among other things, meant to prepare them for their subsequent school start, early childhood education is not a perfect substitute for Year 0/1 of primary school. The early childhood curriculum, Te Whāriki, emphasises play-based experiences with some flexibility in routines (including opportunities for rest and sleep) and recognises that the school environment will have somewhat different expectations, structures and routines. It explicitly recognises the start of school as a ‘crucial transition’ (p. 51).Footnote6 Primary school continues to develop children’s general life skills and curiosity but also focusses specifically on the foundational skills of reading, writing and mathematics. It is hence reasonable to hypothesise that the time spent in school may have an effect on children which is distinct from their time spent in an early childhood education setting.
Our study contributes to the literature by examining longer-term effects of early primary education. Specifically, we evaluate student achievement near the end of high school. New Zealand secondary schools operate a national qualification system known as the National Certificates of Educational Achievement (NCEA). We use NCEA results as a standardised measure of high school achievement. In addition, we use a qualification known as University Entrance (UE) to observe whether a student has been granted entry into tertiary study.
NCEA is the primary national assessment tool for secondary school students in New Zealand and is recognized as such by businesses as well as colleges and universities. NCEA tests the performance of students in various subjects, known as standards. For example, in mathematics standards, application of numeric thinking is measured. When students demonstrate a required level of knowledge/skills in a standard, they are awarded NCEA credits. Students need to obtain a specific number of credits in order to achieve an NCEA certification. NCEA certification has three consecutive levels, based on the level of the evaluated knowledge/skills. Typically, students work through NCEA levels 1–3 in their secondary school Years 11–13, respectively. The minimum entrance requirement into a New Zealand university is University Entrance which is based on specific NCEA credits.Footnote7
4. Data
The data used in this study are from the Integrated Data Infrastructure (IDI) provided by Stats NZ. The IDI is a large research database which contains information about people and communities in the areas of education and training, income and work, benefits and social services, demographics, tax, health, justice, housing, and migration. Data are compiled with the help of different government agencies, ministries and non-government organisations and also include surveys conducted by Stats NZ. Getting access to IDI includes strict confidentiality provisions and researchers need to undergo a comprehensive application and training process. Once successful, they can access the required subset of IDI data via secure Stats NZ data labs.Footnote8
We have been granted access to Ministry of Education data which contain information on each student who graduated from, or otherwise left, a New Zealand secondary school between 2009 and 2016 including NCEA and UE achievement (our outcome measures), the month and year of birth, gender, self-reported prioritised ethnicity, New Zealand residency status, and an identifier of the high school attended. There are around 541,455 records on high school leavers over our study period. We restrict the sample to those who left school because they had finished (rather than to continue studies elsewhere in New Zealand or abroad) and who were domestic studentsFootnote9 – as we only want students who started and finished school in New Zealand. After removing a small number of duplicate or miscoded observations, we are left with 411,765 student records.Footnote10
The dataset used in our main analysis is somewhat different from the publicly available data provided by the Ministry of Education on the Education Counts websiteFootnote11 for two reasons:(i) we restrict our sample to domestic students; and (ii) we include non-NCEA classification systems such as International Baccalaureate in our model by converting them to NCEA equivalent levels (Table ).
Recall that for each student in high school (where we measure NCEA and UE achievement), we need to refer back to his/her fifth birthday and hence access to primary school education. As information about actual primary school enrolment is very sparse for our older cohort, this study uses potential enrolment instead. Potential enrolment assumes that children start school as soon as they are eligible; i.e. right after their fifth birthday. The use of potential enrolment also sidesteps endogeneity concerns about actual enrolment in a system where parents have some choice in timing the start of school for their children (between five and six years of age). Even if we did have information on actual enrolment, we would need to use potential enrolment as an instrumental variable. We use an intent-to-treat approach in its absence.
Reassuringly, suggestive evidence indicates that potential and actual school start correspond quite closely in New Zealand. For example, while 97% of four-year-olds used licensed early childhood education services in 2004, enrolment was only around 1% among school-eligible five-year-olds.Footnote12 As a more recent example, in 2017, 90 percent of children started school within two weeks of turning five.Footnote13
The exact date of birth would be ideal for identifying potential enrolment but is unfortunately unavailable in the IDI.Footnote14 In its absence, we randomly create the date of birth for each student based on information about the month (and year) of birth and we assign their potential school start accordingly. We use this to calculate the amount of time each child can potentially spend in Years 0 and 1 – the maximum length of schooling. Later, we check the robustness of our results by re-estimating all models for alternative dates of birth: the 1st, 15th, and last of each month. Our main findings withstand these changes.
Some previous studies (e.g. Leuven et al., Citation2010) suggest that the benefits of early schooling opportunities depend on the child’s socio-economic background. To explore this possibility in an extension of our main analysis, we proxy for the students’ socio-economic environment with the decile ranking of the high school attended. Each school in New Zealand has been assigned a decile ranking according to the socio-economic characteristics of the Census area sending children to each school. Decile 1 schools are the lowest ranked, implying that a high percentage of students in those schools are from low socio-economic neighbourhoods with household crowding, a high percentage of residents with income in the lowest twenty percent nationally, and a high percentage of parents in low-skill occupational groups, without an educational qualification, and/or receiving income support benefits from the government.
Table reports the characteristics of students in our sample. Around 89% achieve NCEA level 1, 84% level 2, and 63% level 3. Less than half of students (43%) achieve UE. At all levels, achievement is higher among female students and there are large differences by ethnicity. For example, 74% of Asian students but only 25% of Pacific students and 19% of Māori students achieve university entrance. Similar ethnic differences in achievement have been observed in the previous literature (Anae, Anderson, Benseman, & Coxon, Citation2002; Nakhid, Citation2003; Tofi, Flett, & Timutimu-Thorpe, Citation1996). Notably, Pacific and Māori students are disproportionately represented in low-decile high schools.
Table 1. Descriptive statistics
5. Empirical strategy
As noted above, if a child is born between January and May, she will typically start school in Year 1 and move to Year 2 the subsequent year. If she is born between June and December, she will likely start school in Year 0 and transition to Year 1 in the following February. This means that at the start of Year 2, children’s potential time spent in primary school varies from seven to 19 months (see Figure A1 for illustration). There are four school holidays in the New Zealand academic year. All children born during these holidays start school together on the first day of the following term. The amount of time each child can potentially spend in school – the maximum length of schooling – varies because of these characteristics and is not a linear function of age. This is key for our identification strategy.
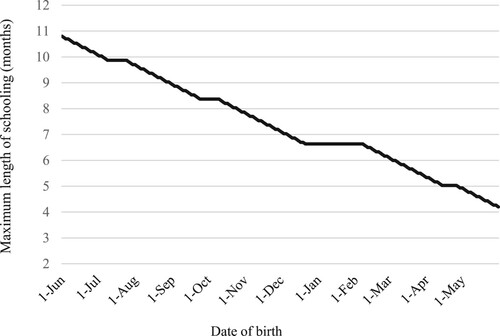
Figure shows the relationship between a child’s date of birth and her maximum length of schooling prior to Year 2, excluding school holidays (and weekends). The horizontal segments reflect being born during school holidays and the segments with a negative slope are for children born outside of school holidays. There are a total of four horizontal segments reflecting the four periods of school holidays in a calendar year.Footnote15 Once off-school days are excluded, the maximum length of schooling varies from approximately four to 11 months.Footnote16 Children who turn five on the same downward-sloping segment have a one to one relationship between the time potentially spent in school and their age, i.e. an additional day of age leads to an additional day potentially spent in school. Any differences in the test scores of these children can be attributed to differences in the maximum length of schooling and/or age (or randomly distributed differences in child/parental/regional characteristics). In contrast, children who turn five on the same horizontal segment start school together after the school holidays so while they differ in age, they do not differ in the maximum time spent in school. Importantly, this allows us to empirically isolate the returns to time spent in school from age effects.
Figure 1. The relationship between the date of birth and the maximum length of schooling (excluding school holidays and weekends)
Please note that our study design also separates the returns to schooling from absolute age effects. Since children start school right after their fifth birthday, the only reason for delaying potential school start – and hence being older at school start – is waiting for the next school term if born during holidays (six weeks maximum). In contrast, variation in the maximum time spent in school comes not only from the timing of birth with respect to school holidays but also from the end-of-May cut-off for Year 1 enrolments. At the extreme, children born in early June typically have the same absolute age of five years (60 months) when they start school as those who start in late MayFootnote17 but the latter go directly to Year 1 and the former to Year 0, adding around eleven months to their school enrolment prior to Year 2. As in Leuven et al. (Citation2010), we need this discontinuity in Year 0 vs. Year 1 enrolment to isolate the effect of time spent in school from the effect of absolute age at school entry.
Crucial to our analysis is the assumption that children’s birth dates are not timed with the school calendar in mind and that parental characteristics do not systematically differ among children born at different points during the school year. In other words, we assume that the timing of the fifth birthday, and hence the maximum length of schooling, are exogenous. To scrutinise this assumption, we first look for evidence of endogeneity of age (at the start of Year 2) and then examine any ‘residual’ endogeneity of potential length of schooling conditional on age. Like in Leuven et al. (Citation2010), the latter test is meant to justify a causal interpretation of the effect of potential length of schooling on academic achievement in our main models, which simultaneously control for age. Specifically, we estimate the following models as exogeneity checks:
(1a)
(1a)
(1b)
(1b) where i indexes a student. Age is measured at the start of Year 2 and the maximum length of schooling measures the amount of time spent in Years 0 and 1 of primary school; X is a vector of student characteristics including gender and ethnicity; s are high school fixed effects, t are year of birth dummies, and r*t are high school region*year of birth interactions. This specification resembles the most closely our main models of academic achievement but as a further check, we also estimate simplified versions of models 1a and 1b by replacing the large set of fixed effects with the student’s school decile. In all models, standard errors are corrected for clustering at the school level and are robust to heteroscedasticity.
To suggest that the date of birth – and hence potential early schooling – is exogenous, we expect to find no significant effects of the right-hand-side variables (apart from age in model 1b, where it is closely, and mechanically, linked with the maximum length of schooling).
Finally, recall that the potential length of schooling depends fully and mechanically on the date of birth and exogenously-determined dates in the New Zealand school year. Of these components, only the date of birth varies across children and results in differences in not only potential enrolment but also the potential relative age at school start. Where actual enrolment deviates from potential enrolment, the child’s actual age will also deviate from her potential age. However, our direct inclusion of potential age in the regression models should ensure that our main variable of interest, the potential length of schooling, only affects later academic achievement through the actual length of schooling.
In summary, we believe that our empirical strategy satisfies the key identifying assumptions of relevance (in that the potential and actual length of schooling are closely correlated), exclusion (in that the potential length of schooling only affects outcomes through actual length of schooling), and exogeneity (in that the potential length of schooling is randomly allocated).
Once we establish the validity of our identifying assumptions, we move to the key analysis of the influence of the time spent in school on later educational outcomes measured by NCEA and UE achievement. We estimate four separate regressions with the following specification:
(2)
(2) NCEA1/2/3 and UE are binary indicators for achieving a given qualification and all other variables are defined as above. We estimate the achievement models primarily with OLS but check that probit marginal effectsFootnote18 are very similar. Standard errors are again corrected for clustering at the school level and are robust to heteroscedasticity.
An important thing to note is that the sample size for all three NCEA regressions is the same. For instance, even if some students drop out of school after achieving NCEA level 1, they are still part of our analysis for NCEA levels 2–3 and are considered as students who have not achieved these levels.Footnote19
6. Results
Consistent with our expectations, student characteristics have no robust relationship with the timing of their fifth birthday and hence potential school start (Table ). Despite the large sample size, most of the estimated coefficients are statistically insignificant and all are small. For example, taking the largest statistically significant coefficient on the effects of student ethnicity suggests that Asian children are, on average, 0.064 of a month – or fewer than two days – younger than New Zealand European children at the start of Year 2. In model 1b, which resembles the most closely our main analysis of student achievement, any ‘residual’ relationship between student characteristics and their maximum length of schooling becomes truly negligible. For example, the largest statistically significant coefficient on student ethnicity now suggests that Māori children potentially spend 0.003 of a month – or 0.09 of a day – less in Years 0 and 1 of primary school than New Zealand Europeans.
Table 2. Test of the exogeneity of the date of birth
Based on this analysis, it is reasonable to assume that parents are not trying to time birth based on school start dates five years later nor that there is a systematic seasonal pattern to the composition of births for any other reason.
Moving next to our main analysis of academic achievement, we find that an additional month of early schooling results in an increase in achieving NCEA level 1 by around 2% (Table , column 1). We see that there is an increasing impact of the maximum length of schooling as we move up the NCEA levels. For NCEA level 2 (Table , column 2), an additional month of early schooling results in a 4% increase in achievement. Given the importance of NCEA level 3 credits in being awarded UE, it is not surprising that the effects of early schooling are similar for the two qualifications (Table , columns 3 and 4). Specifically, an additional month of early schooling results in an increase of about 6% in NCEA level 3 and 5% in UE achievement.
Table 3. Effects of the maximum length of schooling on high school achievement
Holding the amount of time spent in early schooling constant, we do not find evidence of positive relative age effects. Please note that both the length of schooling and age at the start of Year 2 are measured in months (as in Table ) so the coefficient on schooling and the marginal effect of age can be directly compared. As can be seen in Table , the effects of age are not negligible but are always smaller than the effects of schooling and are negative. While Table only shows the marginal effect of age measured at its mean, the above general conclusion is true for the full range of age values observed in our sample. Hence, to the extent that older children do better in academic assessment, their advantage seems to come from having spent more time in the initial years of primary school rather than simply being older.
In the literature, negative relative age effects are not universally observed but are also not unique. For example, Cascio and Schanzenbach (Citation2016) show the benefits of being relatively younger in kindergarten and having older classmates. It is worth noting that their cohort from the U.S. is of similar age (5.4 years at kindergarten entry) to Year 0/1 children in New Zealand and that they, like us, observe educational benefits up to the time of college entry.
As already foreshadowed by the descriptive statistics, female students on average significantly outperform male students across all NCEA levels and at university entrance. Asian students have the highest NCEA and UE achievement rates and Pacific and Māori students have the lowest. Any differences across groups are the largest at the most advanced achievement levels. Importantly for our identification strategy, the effects of student’s gender and ethnicity on NCEA and UE results remain virtually the same in the absence of controls for the student’s age or potential length of schooling (Table ). This further confirms that the timing of birth, and hence also the potential length of schooling, are exogenous.
Because a child’s date of birth jointly determines her time potentially spent in Years 0 and 1Footnote20 and because many schools treat Years 0 and 1 similarly (e.g. they are often managed by the same teaching team and subject to the same curriculum level), our preferred models focus on the overall time spent in Years 0 and 1 combined. However, to explore possible differences in the returns to schooling in Year 0 vs. 1, we also re-estimate our core set of models with the time spent in each Year disaggregated (Table ). Our results indicate that most of the benefits from early schooling emanate from time spent in Year 1. Specifically, for all the later academic achievement measures that we study, a month spent in Year 1 has, on average, over three times the beneficial impact of a month spent in Year 0. Nevertheless, we confirm that both time spent in Year 0 (to a lesser degree) and time spent in Year 1 (to a greater degree) increase future achievement.
Table 4. Effects of the maximum length of schooling on high school achievement; Year 0 vs. Year 1
7. Robustness checks and subgroup analyses
In this section, we subject our main results to a series of robustness and falsification checks. We also investigate whether the effects are homogeneous across socio-demographic groups or whether they are concentrated in certain sub-populations.
First, our analysis relies on information about the students’ date of birth which is used to determine the potential time spent in school prior to Year 2. The biggest difference in early formal education then theoretically occurs between children born in May and those born in June. Comparing the two extremes, a child born in May could spend 6.6 months less in school than a child born in June. However, in these extreme cases, the correspondence between potential schooling and actual schooling is likely to be the weakest. For example, schools or parents often suggest placing a child born in May into Year 0, not directly Year 1. Removing students born in May or June from the analysis (Table ) does not qualitatively change our main findings.
Table 5. Robustness and falsification checks: effects of the maximum length of schooling
As mentioned above, the exact date of birth is unfortunately unavailable in the IDI (only the month and year of birth are) and we have assigned dates of birth randomly within each month. To test the sensitivity of our results to this inaccuracy, we have re-estimated all of our models using alternative assumptions about the exact date of birth, assigning to each individual the 1st, 15th, or last day of each month (Table ). As the imputed potential length of schooling decreases (e.g. the 15th vs. the 1st), holding later outcomes constant, we would expect to estimate higher returns per month. This is indeed what our results show. However, qualitatively, the main results withstand this robustness check.
Our main analysis restricts the sample to domestic and New Zealand-born students. This is done in an effort to exclude students who started primary school abroad (under a different school start policy) but later participated in NCEA/UE assessment in New Zealand and hence appear in our high school dataset. We would not expect such students to benefit from being born later in the year and making use of early formal schooling in Year 0. However, while unsuitable for our main analysis, students born (and educated) overseas can help verify the credibility of our baseline model in a placebo test. In particular, our results gain credibility if they hold for domestic students but do not hold for migrants or international students.
The IDI dataset reports the migration status of each individual, distinguishing between: migrants, refugees, and New Zealand-born students. In our first placebo test, we focus on migrants and refugees. As expected, the ethnic composition of this group is diverse with 15% Indian, 15% Chinese, 13% Samoan, 8% Japanese, and many other smaller groups. As a whole, the migrant and refugee community is represented about equally across high school deciles and achieves results comparable to New Zealand-born students (e.g. 46% vs. 43% achieving UE, respectively).
The first placebo test (Table ) strongly suggests that our main results are not spurious. Specifically, as expected, the migrant/refugee community does not benefit from the New Zealand primary school start policy in the way that domestic students do. All of the estimated coefficients are close to zero and many have a negative sign.
The population for our second placebo test consists of international fee paying students. These students are not New Zealand-born and they are also not classified as either migrants or refugees. A large majority of them come from Asia: 47% are Chinese, 15% Korean, and 8% Japanese. These students tend to attend high decile schools, with around 75% in deciles 7–10. Their achievement is slightly lower than of New Zealand-born students (e.g. 38% vs. 43% achieving UE, respectively).
Surprisingly, the second placebo test (Table ) produces results which are much less statistically significant but in magnitude similar to the baseline model for domestic, New Zealand-born students. However, the size – and even direction – of the estimated effects is fragile. For example, nearly 30% of international fee paying students are concentrated in two international colleges (with one explicitly operating as a bridging, high-school-to-university programme). When these two schools are excluded from the sample, the results change dramatically and lose any systematic pattern. Similarly, the full-sample results are very sensitive to the inclusion of school fixed effects. This contrasts with the stability of our main findings for domestic students. Therefore, taken together, our placebo tests fail to replicate the effects observed in our main analysis, lending it additional credibility.
Next, we explore whether the beneficial effects of early schooling occur broadly or whether they are more concentrated in certain socio-demographic groups. Specifically, we investigate the potential heterogeneity of effects by: gender, ethnicity, and school decile (Table ).
Table 6. Subgroup analysis: effects of the maximum length of schooling
With respect to gender, we observe large and positive effects in both groups, but especially among male students who experience larger benefits in absolute terms as well as relative to their (lower) mean performance. Comparing by ethnicity, early school attendance seems to have the largest benefits for Māori students, followed by New Zealand Europeans.
Finally, our results by school decile group point to a non-monotonic relationship between socio-economic disadvantage and the benefits of early formal schooling. In particular, returns to early education seem moderate among decile 1–4 as well as decile 8–10 students. On the other hand, students in decile 5–7 schools experience large benefits, especially at the highest level of achievement as measured by NCEA level 3 and UE. One interpretation of these findings is that low decile schools are constrained by own resources and/or the lack of parental effort to complement school activities at home (Ali & Menclova, Citation2018). At the other end of the spectrum, children from high decile schools may be using the school environment and in-home learning as substitutes (Leuven et al., Citation2010). Also, as noted earlier, children from more affluent areas likely already had better access to high-quality early childhood education prior to starting primary school, making school start somewhat less consequential.
8. Conclusion
Due to the distinctive school system in New Zealand, in which children can begin school right after their fifth birthday, we were able to evaluate the effect of the potential length of schooling on high school achievement, autonomous from the effect of age.
Controlling for demographic and socio-economic characteristics, we find that increasing the maximum length of schooling substantially increases the probability of achieving NCEA and University Entrance. Specifically, we find that an additional month spent in Years 0/1 increases the probability of achieving NCEA level 1 by 2%, NCEA level 2 by 4%, NCEA level 3 by 6%, and UE by 5%. Thus, differences in the timing of birth – and hence in school start – seem to have large effects on achievement even years later, in high school.
As advice to policymakers, parents and educators, our results suggest that, in the current New Zealand system, delaying school start past the fifth birthday does not academically benefit an average child (especially where that does not change her age at the start of Year 2) and so should be considered carefully on a case-by-case basis. For example, children who are eligible to start in October of a given year but only start in February the next year, in the same New Entrant class, on average miss out. In other words, we find that, even in the early years, the school environment facilitates human capital accumulation. By extension, our results can help assess the costs of removing early schooling opportunities (e.g. temporarily during Covid-19 lockdowns). Sizeable effects of the length of schooling, at various levels, are not unprecedented in the literature. Closest to our study, Leuven et al. (Citation2010) conclude that an additional year of schooling at the very beginning of primary school increases test scores of disadvantaged pupils in the Netherlands by around 0.6 of a standard deviation. Similarly, Cahan and Cohen (Citation1989) estimate that an additional year of schooling between grades 5 and 6 in Israel increases intelligence test scores by up to 0.5 of a standard deviation. Following an even older cohort, Cliffordson and Gustafsson (Citation2008) find that an additional year of schooling around the age of 18 in Sweden has short-term effects equivalent to increasing students’ intelligence by 2.7 IQ points. All of the above studies attempt to carefully control for the confounding effects of student age. Hence, exposure to formal schooling seems to significantly enhance achievement, above and beyond any effects of simply getting older.
Focusing specifically on the start of primary school, an interesting area for future work would be an examination of the specific benefits that early education provides and thus the mechanisms underlying the large returns to early schooling observed in our study. These effects may go beyond fostering intelligence. Anecdotally, teachers in New Zealand ask the more senior children in a class to mentor and support newly arriving students. This builds confidence and leadership skills. In addition, while children’s early academic progress is officially evaluated relative to a cohort of children starting school at the same time (and within broad performance bands), a casual observation around the classroom may reveal to senior children that they often work on more advanced material in absolute terms. Without an appropriate age/seniority adjustment, they may hence feel more confident about their ability and academic potential.
Acknowledgements
We are grateful to Jeremy Clark, Daniel Schunk, Jan Feld, two anonymous reviewers, and participants at the New Zealand Association of Economists conferences for very helpful comments. We are also thankful to Stats NZ for access to the IDI database and proud to have received the Stats NZ 2019 prize for this research project.
Disclosure statement
No potential conflict of interest was reported by the author(s).
Statistics New Zealand disclaimer
The results in this paper are not official statistics. They have been created for research purposes from the Integrated Data Infrastructure (IDI), managed by Stats NZ.
The opinions, findings, recommendations, and conclusions expressed in this paper are those of the authors, not Stats NZ, IDI or Ministry of Education.
Access to the anonymised data used in this study was provided by Stats NZ under the security and confidentiality provisions of the Statistics Act 1975. Only people authorised by the Statistics Act 1975 are allowed to see data about a particular person, household, business, or organisation, and the results in this paper have been confidentialised to protect these groups from identification and to keep their data safe.
Careful consideration has been given to the privacy, security, and confidentiality issues associated with using administrative and survey data in the IDI. Further detail can be found in the Privacy impact assessment for the Integrated Data Infrastructure available from www.stats.govt.nz.
Notes
1 In New Zealand, the academic and calendar years coincide. School term 1 begins in February and term 4 ends in December.
2 Children are classified as disadvantaged if both parents have at most a degree from a low-level vocational school.
3 New Zealand Ministry of Education. ‘July 2005 Early Childhood Education (ECE) annual statistical return of all licensed services and licence-exempt ECE groups’ (Annual ECE Census Summary Report 2005 | Education Counts; Accessed 15 September 2022).
4 StatsNZ Infoshare (Browse – Infoshare – Statistics New Zealand (stats.govt.nz); Accessed 15 September 2022).
5 New Zealand Ministry of Education. ‘Annual Early Childhood Education (ECE) census summary report 2014’ (Annual-ECE-Census-Summary-Report-2014.docx (live.com); Accessed 15 September 2022).
6 New Zealand Ministry of Education. ‘Te Whāriki: Early childhood curriculum’ (Te Whāriki: He whāriki mātauranga mō ngā mokopuna o Aotearoa - Early childhood curriculum (education.govt.nz); Accessed 15 September 2022).
7 To qualify for UE, a student needs: an NCEA level 3 qualification, 14 credits in each of three approved subjects at NCEA level 3, 10 literacy credits at NCEA level 2 or above made up of 5 credits in reading and 5 credits in writing, and 10 numeracy credits at NCEA level 1 or above.
8 While IDI data cannot be shared publicly, to facilitate replication, we have made our Stata code and a supplementary dataset available at: https://dataverse.harvard.edu/dataverse/5yo_schooling. Release of these documents has been approved by Stats NZ.
9 We focus on domestic (rather than exchange and international fee paying) and New Zealand-born (rather than refugee or migrant) students in our main analysis.
10 All the numbers of observations reported here are very close to the exact values but not exactly the same. We do not report the exact numbers of observations because of a Stats NZ privacy clause.
11 https://www.educationcounts.govt.nz/statistics/schooling/senior-student-attainment/school-leavers (Accessed on 12 March 2019).
12 New Zealand Ministry of Education. “Annual Early Childhood Education (ECE) census summary report 2014” (Annual-ECE-Census-Summary-Report-2014.docx (live.com); Accessed 15 September 2022).
13 Radio New Zealand/Education: ‘Starting school at five “quite early enough” – NZEI’; Accessed 15 September 2022).
14 Stats NZ do not provide the exact date of birth of students to prevent revealing the identity of any individual. There are no exceptions to this rule.
15 These holidays fall on slightly different dates each year but the total number of holidays (or their length) did not change over our study period. In all of our analyses, we use dates from year 2005 for simplicity. In 2005, the holiday dates were: April 14–25th, July 9–24th, September 24th-October 9th, and December 20th-February 6th.
16 The maximum is 10.8 and the minimum 4.2, leading to a difference of 6.6 months.
17 Please note that there are no school holidays in New Zealand in May or June.
18 Available on request.
19 The sample size is different for UE analyses because that information comes from a separate variable, directly indicating whether a student achieved university entrance or not.
20 For example, all those who qualify for some of Year 0 automatically qualify for the full Year 1 while those who miss out on some of Year 1 have also necessarily missed out on all of Year 0.
References
- Ali, A.I., & Menclova, A. (2018). Returns to early formal education: A replication of Leuven et al. (2010). Working Papers in Economics 18/19, University of Canterbury, Department of Economics and Finance.
- Anae, M., Anderson, H., Benseman, J., & Coxon, E. (2002). Pacific peoples and tertiary education: Issues of participation. Auckland: Auckland Uniservices Limited for the New Zealand Ministry of Education.
- Angrist, J.D., & Krueger, A.B. (1992). The effect of age at school entry on educational attainment: An application of instrumental variables with moments from two samples. Journal of the American Statistical Association, 87(418), 328–336.
- Bedard, K., & Dhuye, E. (2006). The persistence of early childhood maturity: International evidence of long-run age effects. The Quarterly Journal of Economics, 121(4), 1437–1472.
- Black, S.E., Devereux, P.J., & Salvanes, K.G. (2011). Too young to leave the nest? The effects of school starting age. Review of Economics and Statistics, 93(2), 455–467.
- Bouchard, I., Cheung, L., & Pacheco, G. (2021). Evaluating the impact of 20 hours free early childhood education on mothers’ labour force participation and earnings. New Zealand Economic Papers, 55(2), 188–202. doi:10.1080/00779954.2020.1791941
- Cahan, S., & Cohen, N. (1989). Age versus schooling effects on intelligence development. Child Development, 60, 1239–1149.
- Cascio, E. U., & Schanzenbach, D. W. (2016). First in the class? Age and the education production function. Education Finance and Policy, 11(3), 225–250.
- Cliffordson, C., & Gustafsson, J.E. (2008). Effects of age and schooling on intellectual performance: Estimates obtained from analysis of continuous variation in age and length of schooling. Intelligence, 36(2), 143–152.
- Crawford, C., Dearden, L., & Greaves, E. (2013). When you are born matters: The impact of date of birth on educational outcomes in England. London: Institute for Fiscal Studies (IFS) Report R80.
- Datar, A. (2006). Does delaying kindergarten entrance give children a head start? Economics of Education Review, 25(1), 43–62.
- Dobkin, C., & Ferreira, F. (2010). Do school entry laws affect educational attainment and labor market outcomes? Economics of Education Review, 29(1), 40–54.
- Elder, T.E., & Lubotsky, D.H. (2009). Kindergarten entrance age and children’s achievement: Impacts of state policies, family background, and peers. Journal of Human Resources, 44(3), 641–683.
- Frederiksson, P., & Öckert, B. (2014). Life-cycle effects of age at school start. The Economic Journal, 124(579), 977–1004.
- Kawaguchi, D. (2011). Actual age at school entry, educational outcomes, and earnings. Journal of the Japanese and International Economies, 25(2), 64–80.
- Leuven, E., Lindahl, M., Oosterbeek, H., & Webbink, D. (2010). Expanding schooling opportunities for 4-year-olds. Economics of Education Review, 29(3), 319–328.
- Lubotsky, D., & Kaestner, R. (2016). Do ‘skills beget skills’? Evidence on the effect of kindergarten entrance age on the evolution of cognitive and non-cognitive skill gaps in childhood. Economics of Education Review, 53, 194–206.
- McCrary, J., & Royer, H. (2011). The effect of female education on fertility and infant health: Evidence from school entry policies using exact date of birth. American Economic Review, 101, 158–195.
- Nakhid, C. (2003). Intercultural’ perceptions, academic achievement, and the identifying process of pacific islands students in New Zealand schools. Journal of Negro Education, 72(3), 297–317.
- Strøm, B. (2004). Student achievement and birthday effects. Schooling and human capital in the global economy: Revisiting the equity-efficiency quandary. Munich: CESifo-Harvard University/PEPG Conference.
- Tofi, T., Flett, R., & Timutimu-Thorpe, H. (1996). Problems faced by Pacific Island students at University in New Zealand: Some effects on academic performance and psychological wellbeing. New Zealand Journal of Educational Studies, 31(1), 51–59.
- Zhang, S., Zhong, R., & Zhang, J. (2017). School starting age and academic achievement: Evidence from China's junior high schools. China Economic Review, 44, 343–354.
Appendix
Figure A1. Comparison of two hypothetical students starting school at different times
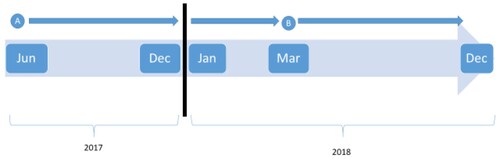
The above figure shows the example of two children, A and B. Child A turns five in June 2017, spends the rest of the year (June – December 2017) in Year 0 and the entire year 2018 in Year 1 before finally moving on to Year 2 at the beginning of 2019. In contrast, child B starts school in March 2018 and goes directly to Year 1 where she spends the rest of the year (March – December 2018). At the beginning of 2019, children A and B meet in a Year 2 class; child A after around 19 months in the primary school system and child B after only about 10 months.
Table A1. Highest attainment variable – classification table
Table A2. Effects of gender and ethnicity on high school achievement; further test of the exogeneity of the date of birth