
ABSTRACT
There is growing recognition of the importance of a well-connected cycling infrastructure. Common connectivity measures apply aggregate area-based metrics, such as the number of streets per transportation analysis zone or census area. However, such measures capture cyclist movement insufficiently, as cyclist movement easily extends beyond areas, and variations in the sizes and shapes of areas lead to inconsistent outcomes. In contrast to area-based connectivity, network connectivity considers the connectivity of the entire cycling network, capturing the continuity or discontinuity of routes. Certain measures can account for other important aspects, such as topology and the relative importance of individual links in large networks. Although previous reviews have covered several aspects of cycling infrastructure, no review has been dedicated to the measures, methods and models applied to assess network connectivity or the impact of increased network connectivity on cycling behaviour. We conduct a scoping review of measures, methods, models, and data sources to assess cycling network connectivity and review associations between network connectivity and travel behaviour. The findings suggest an increase in the number of publications on network connectivity up to 2019, followed by a plateau in the number of studies but with more complex methods. However, that complexity may constitute a barrier to practical implementation. We conclude that empirical verifications regarding the effects of network connectivity on travel behaviour remain a research gap, even in high-cycling countries, with evidence further limited by limited link-level travel data. Future research should also focus on developing more consistent and validated metrics.
1. Introduction
Cycling is a transport mode promoted for reducing greenhouse gas emissions, congestion and noise, and increasing physical activity. The individual and public health benefits are well-documented (e.g. Goodman et al., Citation2012; Mueller et al., Citation2018; Pucher & Buehler, Citation2017). Cycling in urban areas is cheaper and sometimes faster than using cars or public transport (Heinen et al., Citation2010). Bicycles require less space than cars, reduce congestion and demand less parking space.
Literature suggests a positive impact of the presence, length and density of cycling infrastructure on cycling (Buehler & Dill, Citation2016). Consequently, many cities are improving or expanding their cycling infrastructure (Bianchi, Citation2021; Lamu et al., Citation2020; Mueller et al., Citation2018). For instance, Oslo (Norway) is expanding its cycling network by 100 km between 2018 and 2025 (Oslo Municipality, 2018), and Bogota (Colombia) increased the length of its cycling network from 232 km in 2001 to 540 km in 2019 (Rosas-Satizábal et al., Citation2020).
The interest in causalities between cycling infrastructure and cycling has resulted in several literature reviews on the topic (Buehler & Dill, Citation2016; Castañon & Ribeiro, Citation2021; Heinen et al., Citation2010; Kazemzadeh et al., Citation2020; Mölenberg et al., Citation2019; Panter et al., Citation2019; Vale et al., Citation2016; Yang et al., Citation2019), providing insights into associations between cycling and quantity, length, and types of cycling infrastructure. However, there is growing recognition that long or dense cycling infrastructure alone may not be sufficiently attractive if interrupted by links with a lot of traffic or poor roads (Furth et al., Citation2018; Gehrke et al., Citation2020).
Cycling infrastructure can be divided into link-level infrastructure – e.g. dedicated bicycle paths or roads shared with motorised vehicles – and node-level infrastructure – e.g. cycling-friendly intersection designs (Buehler & Dill, Citation2016). The connectivity of such cycling infrastructure is defined and operationalised differently throughout the literature (Buehler & Dill, Citation2016) but can be placed in two categories – namely, (i) area-based measures, and (ii) network-based measures.
Area-based measures are based on the number of network links or nodes per area, or ratios between links and nodes (Ellis et al., Citation2016). Such aggregate measures are frequently applied (Yang et al., Citation2019) as they are easy to calculate and communicate (Knight & Marshall, Citation2015). For instance, the number of bike lanes per area unit (e.g. census area or km2) has been shown to support cycling, whilst the number of 4-way street intersections is generally considered detrimental to cycling (Yang et al., Citation2019). However, authors have noted inconsistencies based on the area studied and network configurations, and argued that area-based measures such as street or intersection density cannot adequately account for network configurations and connections between individual street segments (Knight & Marshall, Citation2015; Marshall & Garrick, Citation2012).
In contrast, network-based measures apply network analysis (Cooper, Citation2015), which considers the entire network available to cyclists, evaluating its ability to connect specific origins and destinations or to connect links/nodes to all other links/nodes in a network. There are several advantages of network-based measures over area-based measures. First, analyses are not limited by pre-determined boundaries but rather by the scope of the analysis. Second, distance/proximity (an important determinant of cycling (Heinen et al., Citation2010)) can be accounted for. Several measures further account for route directness, which has been shown to be important for commuters and experienced cyclists (Broach & Dill, Citation2016). Third, network analysis can grasp the effects of missing links or links with poor cycling infrastructure, which is particularly important for inexperienced and young cyclists, as they tend to value the presence of continuous cycling infrastructure more than experienced cyclists (Bernhoft & Carstensen, Citation2008; Heinen et al., Citation2010). There is also evidence that women value cycling infrastructure more than men (Aldred et al., Citation2017). Whilst limited and poorly connected infrastructure may suffice for “hardy” individuals who cycle regardless of conditions (typically young males), it may fail to meet the needs of a significant proportion of the population who require improved infrastructure for cycling (Fishman, Citation2016). Thus, measures of network connectivity are valuable tools when assessing conditions for cycling equity (Cunha & Silva, Citation2023; Doran et al., Citation2021; Kent & Karner, Citation2019).
Network analysis has expanded the ways in which the connectivity of cycling networks can be quantified, with applications that are highly relevant for planners and researchers. Examples are the prioritisation of network links for infrastructure improvements (e.g. Lowry et al., Citation2016), estimations of cycling travel demand (e.g. Cooper, Citation2018) and the optimisation of several connectivity criteria deemed important for cyclists (e.g. Reggiani et al., Citation2022). However, assessing the connectivity of an entire network can be complex and computationally demanding, and requires detailed and topologically correct network models (Boeing, Citation2017; Cooper & Chiaradia, Citation2020). Although the development of new network-based methods and models has been facilitated by rapid advantages in GIS, network models, network data and computational capacity, the greater complexity and effort compared to area-based measures may constitute a barrier to application (Knight & Marshall, Citation2015). In addition, multiple methods and measures are rooted in different disciplines (Marshall et al., Citation2018), and choosing the appropriate approach to evaluating network connectivity is challenging. Moreover, whilst several network measures are straightforward to calculate, more complex measures are potentially subject to misinterpretation if applied incorrectly (e.g. Cooper et al., Citation2021).
Nevertheless, despite the opportunities and challenges of network-based connectivity assessments, no recent review has been dedicated to measures, methods, models or empirical evidence on the associations between network connectivity and cycling. However, two previous reviews provide some conclusions in this regard. Reviewing cycling networks and their effect on cycling levels, Buehler and Dill (Citation2016) pointed to the emerging field of network analysis, but they identified just four studies, of which none was empirical. Vale et al.'s (2016) review of operational measures of walking and cycling accessibility concluded that cycling accessibility had received little attention and was a major field for future research. Therefore, this review aims to:
Identify measures, methods, and models applied in the scientific literature to assess cycling network connectivity;
Review applied network models and spatial data resolutions;
Review empirical findings on the associations between cycling network connectivity and cycling levels (i.e. mode choice, modal shares, frequencies and volumes);
Identify empirical, methodological and data gaps.
2. Methodology
2.1. Search strategy
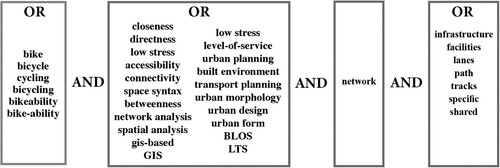
The search was conducted on 30 March 2023 using the databases Scopus and Web of Science (WOS). The keywords chosen aimed to cover multiple scientific fields (). In Scopus, we searched within the fields “Article”, “Abstract” and “Keywords”. In WOS, the corresponding field was “Topic”. The keywords “cycle” or “cycling” are also used in several unrelated scientific disciplines; thus, we specified additional keywords that aimed to exclude articles from, e.g. chemistry and biology (see Supplement S1 for entire syntax). The search was updated on 16 August.
Figure 1. Search terms applied. Terms within boxes are separated by “OR”.
2.2. Study eligibility
A study was considered for inclusion if it:
Applies connectivity measures rooted in network analysis – i.e. connectivity is assessed past pre-defined area units and through the network. Network gaps or barriers must have a measurable effect on the outcome.
Applies area units for origins or destinations – i.e. zones, centroids or statistical units – instead of address-level origin-destination data. This relaxation of the first criteria is needed as origin, destination and personal data are often only available at an aggregated level.
Has been published in English.
Has been published in a peer-reviewed journal or conference article.
A study was excluded if it:
Applies small sub-networks or networks limited to neighbourhood level that cover less-than-average cycling distances (< 4 km).
Does not describe the spatial extent of the network.
Applies mean connectivity values for entire networks or sub-networks that do not allow locating connectivity deficiencies in networks.
Does not distinguish between walking and cycling modes.
Uses all road classes or makes no reference to which types of roads are considered, as pedestrian short-cuts or motorways where cycling is prohibited can substantially impact network analysis outcomes, particularly concerning directness and shortest routes.
Analyses networks for recreational purposes (e.g. trail systems in national parks). Studies that consider trails part of urban systems were included.
2.3. Screening
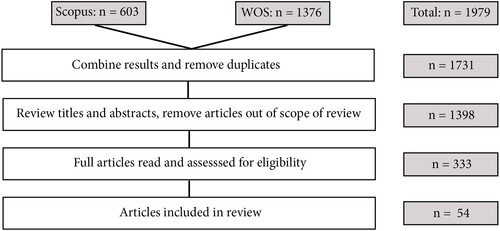
After the removal of 248 duplicates, 1731 records remained for screening. Reviews were excluded but referenced in the Introduction (Chapter 1). The screening process is visualised in . First, we read all titles and abstracts. This process led to the removal of 1398 studies. The remaining 333 articles were read and also examined for further publications within the scope of the review. Key criteria were a reference to a related method, measure or model in the article or the title in the reference list. For final inclusion/exclusion, the same criteria as above were applied. Another 287 articles were excluded during reading, and eight more were retrieved from the reference lists. This included one article from conference proceedings listed as a book, one with no keywords provided, and six articles without infrastructure-related keywords (Supplement S2). Fifty-four articles were included in the final review.
Figure 2. Diagram of literature review.
2.4. Classification
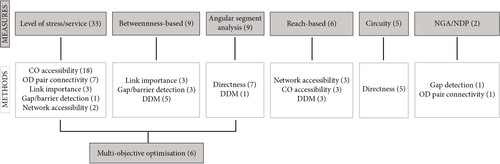
We sorted the articles into seven categories based on the methodology used ():
Level of stress/service (LOS): studies that weigh links by factors quantify link attractiveness for cyclists.
Methods based on betweenness, a centrality measure of transportation networks rooted in graph theory.
Angular segment analysis (ASA), applying configurational measures from space syntax.
Methods based on reach, a measure of network accessibility without explicit consideration of land use.
Circuity, a measure comparing shortest routes to straight-line or car distances.
One category combines network growth algorithms and network design problems (NGA/NDP), optimising cycling network coverage under cost constraints.
Multi-objective optimisation, aimed at finding a set of solutions and optimising trade-offs between multiple objectives.
This classification aimed to provide a logical subdivision of methods into measures and models rather than a sharp division between measures and methods. For instance, betweenness is a measure, but given its diverse applications, betweenness warrants a methods category. The measures and models comprise cumulative opportunities (CO) accessibility, origin-destination (OD) pair connectivity, identification of important network links (link importance), gap/barrier detection, network accessibility, directness and direct demand models (DDM) ().
Figure 3. Main classification into methods with sub-classification into measures/models. Parentheses indicate the number of publications. CO = cumulative opportunities; OD = origin-destination; DDM = direct demand model; NGA/NDP = network growth algorithm/network design problem.
3. Results
3.1. Article overview
All papers were published between 2008 and 2023. The number of studies rose sharply after the last related review on the topic (Buehler & Dill, Citation2016), from one or no study between 2008 and 2012–13 studies in 2019. The number of published articles dropped after 2019 and then plateaued, but the variety of methods, measures and models remains relatively high, with some studies using several methods and measures (). Regarding the geographical distribution, 32 (59%) of the studies researched networks in North America, 18 (33%) in Europe, and five (9%) in South America ().
Figure 4. Number of (a) methods, (b) measures/models per year. The black line indicates the total number of publications.
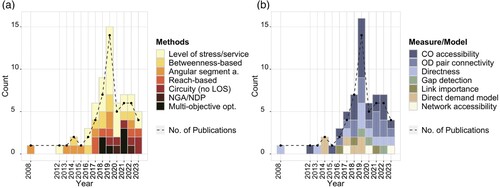
Table 1. Overview of methods, measures, models and data.
3.1. Methods, measures and models
This section summarises the identified methods for assessing cycling network connectivity and accessibility ((a)), further categorised by measures and models ((b)). presents a summary of the key findings.
3.1.1. Level of stress/service (LOS)
Thirty-three studies weighted network links or nodes by cycling stress levels or comfort (LOS). Twenty-five studies employ the “level of traffic stress” (LTS; Mekuria et al., Citation2012), which categorises cycling infrastructure into four levels based on speed limits, cycle lane width, separation from traffic, lane blockage and intersection design. LTS 1 and 2 are low-stress, suited for children and most adults, whilst LTS 3 and 4 require higher stress tolerances. Five studies use a variation of the more data-demanding bicycle level of service (BLOS) as defined by Landis et al. (Citation1997). Three studies developed alternative infrastructure quality indicators (Beecham et al., Citation2023; Boisjoly et al., Citation2020; Wysling & Purves, Citation2022).
LOS has most frequently (n= 18) been applied to measure cumulative opportunities (contour-based) accessibility – i.e. the number of residents, jobs or points of interest, or network length reachable using primarily or exclusively low-stress links within a specific distance or time limit. Cumulative accessibility is relatively easy to calculate and communicate (Boisjoly & El-Geneidy, Citation2017) and is thus popular for demonstrating the impact of proposed or implemented LTS infrastructure improvements on accessibility. However, cumulative accessibility does not always clarify whether low accessibility is due to poor connectivity or a lack of nearby destinations (Putta & Furth, Citation2019). Moreover, cumulative accessibility assumes that nearby and far-away destinations have equal weight (Geurs & van Wee, Citation2004), irrespective of travel time (Boisjoly & El-Geneidy, Citation2017).
Cumulative accessibility has also been criticised for arbitrary time or distance limits (Geurs & van Wee, Citation2004). However, low-stress accessibility is often limited by network gaps or barrier gaps rather than cut-off times or distances (Imani et al., Citation2019). Two studies applied no distance thresholds, measuring connectivity as the proportion of the connected length of LTS low-stress links reached from census areas to all other streets (Perez et al., Citation2017) or all bikeable streets (Wang et al., Citation2020). Both studies make no assumptions of link importance, treating built environment variables as additional predictors of cycling shares.
Seven studies allow travel on higher-stress links if the low-stress routing is considerably longer (e.g. by 25%, Furth et al., Citation2016). This requires establishing origin-destination pairs, such as centroids and points of interest (Cabral et al., Citation2019; Cabral & Kim, Citation2022; Lowry & Loh, Citation2017), or points weighted by population and jobs (Furth et al., Citation2016, Citation2018; Putta & Furth, Citation2021). As one of few studies, Furth et al. (Citation2018) accounted for distance decay (for an example of distance decay, see their ), retaining long-distance OD pairs in the analysis, albeit with a lower weight. They further calculated the number of cycle-accessible jobs and potential bicycling trips. Although more sophisticated than other LTS-based methods (by avoiding arbitrary distance cut-offs and applying multiple detour ratios), only one study has partially adapted their method (Putta & Furth, Citation2021).
Three studies derived OD pairs from self-reported OD data and measured the connectivity of entire shortest routes. Cervero et al. (Citation2019) considered the proportion of low-stress links on cycling corridors between homes and workplaces as predictors for cycling modal shares. Based on two travel surveys, Boisjoly et al. (Citation2020) used the proportion of length cycled on cycling facilities compared to the total trip length along the shortest path as a network quality indicator. Only trips on routes with a minimum proportion of length covered by bicycle facilities and without undue detour were considered connected. More recently, Beecham et al. (Citation2023) correlated bike-share trips with a more complex composite measure of bikeability that captures directness, distance decay, junctions and turns, and the extent of infrastructure along generated routes between bike-sharing zones.
Other studies used the LOS for the systematic identification of barriers in LTS networks (Putta & Furth, Citation2019) as part of betweenness-based methods (n = 3; Section 3.1.2) or multi-objective optimisation (n = 6; Section 3.1.7).
3.1.2. Betweenness-based methods
Betweenness (n = 9) identifies how often a link is used in the shortest routes from origins to destinations through the network (Freeman, Citation1977). Given its ability to proxy cyclist flows and highlight links that contribute most to network connectivity, betweenness has found application across various contexts. For instance, Lowry et al. (Citation2016) applied betweenness for LTS improvement prioritisation, with shortest paths considering link length, intersection turning angles and slope following Broach and Dill (Citation2016). Moran et al. (Citation2018) focused on the potential increase in connectivity if links were converted from high to low-stress links. Putta and Furth (Citation2021) demonstrated a significant increase in low-stress connectivity by converting one-way streets with high betweenness to streets, allowing contra-flows while considering travel in two directions.
Vybornova et al. (Citation2022) pointed out that the progressive construction of bicycle networks often leaves gaps. With Copenhagen as a case study, they prioritised such gaps based on high betweenness weighted by gap length. The authors used an open-source OpenStreepMap (OSM) network with no link weighting to maximise reproducibility and generalisability.
Four studies applied betweenness as a direct demand cycling model (DDM) with assignment (DDAM), extrapolating cycling volumes across all network links based on known volumes in some locations (Bhowmick et al., Citation2023). Whilst McDaniel et al. (Citation2014) modelled trips between specific OD pairs weighted by trip potential, Cooper (Citation2017) inferred demand directly from the network based on correlations between link density and land-use intensity. Following Broach and Dill (Citation2016), Cooper penalised link lengths for slope and traffic while minimising both angular and metric distances. Subsequent studies increased model parameterisations with higher link weight in dense city centres, multiple betweenness distance bands to account for distance decay (Cooper, Citation2018) and by considering road classes (Chan & Cooper, Citation2019). These advancements increased model fits (Section 3.3) and provided an effective method for estimating the effects of infrastructure changes on network flows. Another demand model explored the influence of betweenness and other explanatory variables on Strava bicycle kilometres travelled (Hochmair et al., Citation2019).
3.1.3. Angular segment analysis
Angular segment analysis (ASA, n = 9) is a variation of betweenness but considers only the configuration and topology of the network, using segmented, simplified network graphs. Due to its roots in space syntax (Hillier et al., Citation2012) rather than transportation (Chiaradia et al., Citation2014), ASA is a separate methods class. ASA highlights network segments frequently used by the most direct routes – i.e. minimising turns, based on the notion that cyclists prefer minimising turns over distance (Law et al., Citation2014). ASA does not consider metric distance and generally does not explicitly account for demand or land use (Marshall et al., Citation2018; Pafka et al., Citation2020), but these factors may be accounted for by segment weights (Manum et al., Citation2017).
Six studies correlated ASA with cycling volumes, measured flows or cycling modal shares – see Section 3.3. ASA’s application in multi-objective optimisation (Section 3.1.7) was explored by Ryu et al. (Citation2021b), whilst Manum et al. (Citation2017) related ASA to cycling speeds. ASA has also been applied for network planning and project evaluations (Manum & Nordstrom, Citation2013; Nordström & Manum, Citation2015).
3.1.4. Reach-based methods
Network reach (n = 6) measures the number or length of network links reached through an uninterrupted cycling network within a specific distance threshold (Feng & Zhang, Citation2019). In three studies, the number of links reached proxy urban density and trip generation in direct demand assignment models (Chan & Cooper, Citation2019; Cooper, Citation2017, Citation2018). Reach has also been weighted by opportunities (Cunha & Silva, Citation2023; Manum et al., Citation2017). This is a similar approach that several LOS studies took, but without applying weights for link qualities. Distance decay was considered in three studies. Chan and Cooper (Citation2019) and Cooper (Citation2018) accounted for distance decay through multiple distance bands. Ospina et al. (Citation2022a) applied a decay function and calculated variable maximum distances based on the characteristics of cyclists and the built environment, further demonstrating the advantages over cumulative accessibility.
3.1.5. Circuity
Circuity (n = 5) measures the ratio of cycling network distances to straight-line distances between origin-destination pairs (Stangl, Citation2012). Higher route directness implies higher connectivity. Circuity is related to LTS-based detour factors but does not consider link quality. The advantage is simplicity, as circuity can be calculated in most GIS applications, utilising open-source data and routing engines (Beecham et al., Citation2023; Costa et al., Citation2021; Ospina et al., 2022). Chou et al. (Citation2023) used GPS tracks to identify zones with high detour ratios and employed regressions to determine contributing factors. Rupi et al. (Citation2019) used derivations from the shortest possible route to identify weak links in a cycling network, finding the highest deviations on high-traffic roads without protected bike lanes and roads with reserved bus lanes. Alternatively, circuity has been measured as the OD distance using the cycling network compared to the average car distance (Orozco et al., Citation2020).
3.1.6. Network growth algorithms and network design problems
A series of recent studies address complex cycling network design and network growth algorithms. We only included studies (n = 2) based on existing networks and excluded studies building networks from scratch (e.g. Szell et al., Citation2022). Orozco et al. (Citation2020) applied two greedy algorithms to find and add critical missing network links. They implemented their method in several cities, quantifying “connectedness” by the fraction of cycling infrastructure nodes/links inside the largest connected component compared to the total node count/link length. For instance, with a modest 5 km infrastructure investment, connectedness in Budapest would increase from 15 to 56%. Ospina et al. (2022) maximised network coverage under cost constraints using a mixed-integer linear programming (MILP) formulation. Their algorithm first ensured coverage of the derived network to provide uninterrupted cycling facility access to destinations, and then chose the solution that minimised costs.
3.1.7. Multi-objective optimisation
Multi-objective optimisation (MOO; n = 6) optimises (a) several important factors for cyclists or (b) cycling connectivity while considering optimal vehicle traffic flow. For example, Pareto-optimal solutions identify optimal solutions for combinations of routing objectives, where the set of solutions optimises at least one criterion and one that optimises trade-offs, such as route length, intersections count or LTS/BLOS (Gholamialam & Matisziw, Citation2019; Reggiani et al., Citation2022; Ryu et al., Citation2018). Some studies also consider different user classes, travel demand (Ryu et al., Citation2018, Citation2021a) and spatial route cognition (Ryu et al., Citation2021b). Zuo and Wei’s (Citation2019) method maximised LTS network accessibility to transit hubs while minimising car traffic delays and costs. MOOs allow for comprehensive network studies, but are complex and computationally demanding.
3.2. Network models and spatial units
This section summarises the identified types of network data and spatial units. Both are an important part of the methodology, as they determine the level of resolution and accuracy. Early studies relied on administrative road centreline maps (RCL), which vary in quality and completeness and may be absent in some regions (Ferster et al., Citation2020). In response, approximately 50% of studies published after 2019 applied open and crowd-sourced OSM data (; Boeing, Citation2017). OSM bicycle infrastructure data rivals or exceeds the quality of administrative data (Ferster et al., Citation2020), and its global coverage allows analyses in multiple cities (Orozco et al., Citation2020). Several authors also transferred the LTS classification to OSM networks. Segment maps for angular segment analyses were derived either from hand-drawn axial maps or by segmentation of road centreline or OSM maps.
Spatial units at origins and destinations are shown in . “Area” denotes either aggregate demographic data or area centroids, and “Point” denotes point-level destinations. “Node” denotes network junction points, and “Link” and “Segment” are on network level. Most studies use area resolution, as demographic or origin-destination data are usually only available at the area level. When areas serve as origins, centroid-to-network connectors are common; one study associated zonal demand with the street network and accounted for access to the network (Putta & Furth, Citation2021). Others placed several demand-weighted OD points inside traffic analysis zones (Furth et al., Citation2016) or at intersections within census block buffers (Furth et al., Citation2018). More straightforward approaches applied centroids of evenly-sized hexagons as origin-destination points (Abad & van der Meer, Citation2018; Wasserman et al., Citation2019) or network nodes with the highest centrality in raster cells (Wysling & Purves, Citation2022).
Other studies modelled flows on link level but applied aggregate weights for population or jobs (e.g. McDaniel et al., Citation2014). A few studies maintained network-level resolution, either for generalisability (Vybornova et al., Citation2022), to focus on the role of the network itself (e.g. Nordström & Manum, Citation2015), to consciously avoid aggregation by modelling urban density, demand and assignment on the network (e.g. Cooper, Citation2018), or to relate network properties to cyclist volumes (Section 3.3).
3.3. Empirical findings
We identified 19 publications examining the impact of network connectivity and accessibility on cycling levels (). Four studies suggested a positive association between increased LTS connectivity or accessibility and the propensity to cycle, with the highest effects noted for the continuity of LTS 2 links. For instance, Imani et al. (Citation2019) found that an additional 100 jobs accessible within 30 minutes (equal to 7.5 km) via LTS 2 links were associated with an increase in the likelihood of cycling by about 41%. Cervero et al. (Citation2019) noted that a higher proportion of low-stress, direct routes from home to work was associated with higher commuting cycling shares, especially for long distances over 6 km. However, the effects of individual network variables were marginal, and the authors attributed tangible effects on cycling to a combination of several built-environment variables. Positive effects on cycling due to higher LTS network accessibility were also noted by Wang et al. (Citation2020) and Perez et al. (Citation2017). The latter linked increasing cycling mode shares observed over several years to more connected low-stress kilometres.
Table 2. Articles investigating associations between network connectivity/accessibility and cycling levels.
Two LTS studies investigated trip numbers and frequencies. Lowry and Loh (Citation2017) found a positive and significant correlation between bicycle trips in census areas and an LTS composite connectivity score, adjusted by population and destination density. Beecham et al.’s (2023) bikeability model showed a high model fit with bike-sharing trip frequencies. However, the effect sizes of the bikeability measure were small compared to variables capturing demand and the presence of bike-sharing stations.
In contrast to LTS-based studies, Cooper (Citation2017) used cycling network reach to predict commuting mode shares, and found moderate correlations. Subsequent studies showed higher correlations when applying multiple network radii to account for distance decay and traffic aversion (Chan & Cooper, Citation2019; Cooper, Citation2018).
Seven studies investigated correlations with measured cyclist counts or volumes on link level. Here, the models with advanced parameterisation of betweenness with multiple route choice metrics and distance bands (Chan & Cooper, Citation2019; Cooper, Citation2018) show significantly higher correlations than models based on one betweenness metric or angular segment analysis. However, these advanced models were explicitly designed as DDMs to fit current data and accurately predict future network flows.
Results from two studies linking angular segment analysis to Strava cycling volumes suggest that the impact of route directness on cycling varies between weekdays and weekends, with one study indicating that route directness matters more for commuting than non-commuting trips (Orellana & Guerrero, Citation2019a). Hochmair et al. (Citation2019) found that census block groups with higher betweenness have, on average, more bike kilometres travelled (BKT) on weekdays than on weekends. However, betweenness was not significant for absolute BKT.
4. Discussion
In this article, we aim to identify empirical, methodological and data gaps by reviewing (i) the measures, methods and models applied in the scientific literature to assess cycling network connectivity, (ii) the network models and spatial units applied, and (iii) the empirical findings on the associations between cycling network connectivity and cycling levels.
The review revealed a few patterns. First, we note an increasing complexity of methods applied in recent years and a shift from focusing on accessibility to prioritising network links, identifying gaps or optimising several network aspects important to cyclists. Second, whilst most initial research was conducted in North America and Europe, comprehensive network studies have recently emerged from South America. Third, there is a trend towards the application of open-source data.
4.1. Methodology
First, there are various measures and definitions of connectivity. This diversity provides researchers and practitioners with multiple tools, but also makes comparing findings or choosing methods difficult. For example, all authors have employed a different formulation of betweenness. Only LTS accessibility has been applied consistently, albeit primarily in North America.
Second, there is no clear definition of what constitutes a cycling network. The definitions range from networks limited to low-stress links to multi-layered transportation networks. A single, strict definition is impossible due to cultural and legal contexts (Pucher & Buehler, Citation2017). However, the definition of a network has implications for the methodology and interpretation of results. For instance, Imani et al. (Citation2019) found that, on a low-stress network, access to jobs is often limited by space rather than a 30-minute cut-off time. Limiting a network to certain LTS levels may be appropriate, but the impacts on modelled shortest routes and accessibility may be too pronounced in other instances.
Third, there are methodological gaps in calculating shortest routes. Most studies minimise metric distance or angular turns, but research indicates that cyclists minimise both distance and angular turns (e.g. Broach & Dill, Citation2016; Cooper, Citation2017). Nevertheless, only four studies combined these metrics. Future studies should consider such advanced hybrid metrics.
Fourth, cumulative (contour-based) accessibility has frequently been applied. Although its simplicity facilitates communication with decision-makers, hard travel distance cut-offs and equal destination importance, irrespective of distance, are problematic. Only nine studies considered distance decay with different approaches. Given the importance of distance and travel time for cycling, more cycling-specific research on the effect and formulation of distance decay is needed.
Fifth, several criteria are important to increase connectivity for cyclists, such as route directness, the level of cycling infrastructure, risk of injury or reaching many points of interest. Cycling networks are also part of a multimodal urban network that includes pedestrians and cars. Increased cycle lane width and better separation from traffic are bound to reduce space for car traffic and thus bound to be subjected to debate and resistance (Henderson & Gulsrud, Citation2019; Wilson & Mitra, Citation2020). The multi-objective methods show that optimising several criteria leads to several solutions. In theory, this allows urban planners to prioritise trade-offs, but the few current multi-objective optimisation methods are complex and unlikely to be implemented in praxis. However, publishing algorithms and codes, as done by Cooper (Citation2018), Orozco et al. (Citation2020), Vybornova et al. (Citation2022) and Wysling and Purves (Citation2022) for other methods, would facilitate further development of such complex methodologies.
Sixth, recent network prioritisation, gap detection and gap closure methods are valuable tools for cost-efficient improvements of existing cycling networks. Betweenness-based methods and greedy algorithms are relatively low in complexity, and reproducibility is facilitated by published codes (e.g. Orozco et al., Citation2020; Vybornova et al., Citation2022). Given their potential for practical applications, further development of these methods is recommended – for instance, by optimising for directness and considering demand.
Seventh, direct demand models with assignment (DDAM) are a high-resolution, disaggregated alternative to aggregated four-step transport models (Chan & Cooper, Citation2019; Cooper, Citation2017, Citation2018). Whilst not accounting for personal factors or travel behaviour, recent DDAMs consider distance decay and land-use agglomeration, and can, in theory, predict the impacts of major infrastructure changes on flows and trip generation across networks. Their ability to predict pedestrian flows after major redevelopments has been demonstrated elsewhere (Cooper et al., Citation2021), but for cycling, evidence is limited to a few cross-sectional studies in the same location. Future research should validate advanced DDAMs in more locations.
4.2. Empirical findings
Eight studies linked network connectivity to mode choice or modal shares. Although all eight studies found positive associations of connectivity or accessibility measures with cycling, eight is not many, and the predictor variables and statistical approaches vary. As Buehler and Dill (Citation2016) noted, more empirical research applying innovative methods is needed.
Many studies were based on shortest routes, which are easily linked to route choice, but route choice does not readily translate to mode choice (Broach & Dill, Citation2016). Broach and Dill (Citation2016) found that excess distance, upslope, motor vehicle traffic and bicycle infrastructure have significant and similar effects on both route and mode choice decisions. Whilst the impact of these factors along entire routes on cycling modal shares has been considered in some studies, the impact of route properties between origin and destinations on the decision to cycle requires more empirical research.
In addition, all empirical studies were cross-sectional. We echo Buehler and Dill’s (Citation2016) call for longitudinal studies allowing conclusions on causality. Research would also benefit from intervention studies. Adding missing network links increases connectivity and accessibility locally, which is easily grasped by existing methods. However, such interventions affect cycling distances and flows across the wider network, potentially increasing travel demand beyond the studied locations, with further implications on land-use intensity and residential self-selection (Cooper, Citation2017; Saxe & Kasraian, Citation2020).
Finally, the empirical research is geographically concentrated, with a noticeable lack of mode choice or modal share studies in countries with high cycling rates, such as Denmark or the Netherlands. The empirical findings and the effectiveness of measures may differ from low-cycling contexts and should be investigated.
4.3. Data
Accurate and detailed network models are crucial for connectivity research, as errors can result in routing errors with potentially significant impacts on connectivity and accessibility analysis (Vierø et al., Citation2023). Official network data, if available, may lack important links and can be slow to update (Vierø et al., Citation2023). Detailed OSM data has expanded the possibilities for network analysis, but not without issues. Inconsistent labelling of road and cycling network classes has been pointed out (Ferster et al., Citation2020), along with varying data quality, update rates and contributor engagement across regions and within countries (Bres et al., Citation2023; Quattrone et al., Citation2014). Moreover, OSM data may contain topological errors (Vierø et al., Citation2023). Although these issues are known, only a few cycling- and OSM-specific tools for topological corrections (OSMnx, Boeing, Citation2017; sDNA, Cooper & Chiaradia, Citation2020) and reproducible quality assessments (BikeDNA, Vierø et al., Citation2023) exist. Additionally, tag selection for extracting networks from OSM may vary based on regions and research objectives, and only a few studies were fully transparent about their OSM network extraction procedures (e.g. Reggiani et al., Citation2022; Wysling & Purves, Citation2022).
An additional data limitation is disaggregated origin-destination and travel data. While aggregation is required for privacy protection, address-level origin-destination data, combined with data on routes taken by cyclists, could deepen our understanding of the links between route properties, route choice and the propensity to cycle. One emerging link-level data source is Strava Metro. However, participation inequality, bias towards younger male cyclists and the lack of demographic data have been identified as problematic (e.g. Lee & Sener, Citation2021).
5. Conclusions
We identified 54 peer-reviewed studies that assess the connectivity of cycling networks and various methods, measures and models with different levels of complexity. Although LTS accessibility has dominated for a considerable period, there is a trend towards more comprehensive and complex measures focusing on link prioritisation, cost-efficient gap closures, travel demand or several connectivity aspects simultaneously. Such measures allow more comprehensive studies of networks, but we emphasise the importance of open-source data, codes and software to make these recent and future measures and methodologies accessible to practitioners and researchers. Although the methods have expanded our ability to measure and evaluate cycling networks, methodological and data gaps remain, as well as more pressing, empirical gaps. Whilst the few empirical studies show a positive association between higher connectivity and cycling levels, conducting longitudinal studies would further increase our understanding of the effects of high network connectivity, however these are defined and measured. Moreover, more consistent, validated metrics would further benefit network-wide connectivity studies.
Supplemental Material
Download MS Word (60.1 KB)Acknowledgements
The authors gratefully acknowledge the support from the Research Centre on Zero Emission Neighbourhoods in Smart Cities (FME ZEN) and the Research Council of Norway.
Disclosure statement
No potential conflict of interest was reported by the author(s).
References
- Abad, L., & van der Meer, L. (2018). Quantifying bicycle network connectivity in Lisbon using open data. Information (Switzerland), 9(11). https://doi.org/10.3390/info9110287
- Aldred, R., Elliott, B., Woodcock, J., & Goodman, A. (2017). Cycling provision separated from motor traffic: A systematic review exploring whether stated preferences vary by gender and age. Transport Reviews, 37(1), 29–55. https://doi.org/10.1080/01441647.2016.1200156
- Bearn, C., Mingus, C., & Watkins, K. (2018). An adaption of the level of traffic stress based on evidence from the literature and widely available data. Research in Transportation Business & Management, 29, 50–62. https://doi.org/10.1016/j.rtbm.2018.12.002
- Beecham, R., Yang, Y., Tait, C., & Lovelace, R. (2023). Connected bikeability in London: Which localities are better connected by bike and does this matter? Environment and Planning B: Urban Analytics and City Science, 50(8), 2103–2117. https://doi.org/10.1177/23998083231165122
- Bernhoft, I. M., & Carstensen, G. (2008). Preferences and behaviour of pedestrians and cyclists by age and gender. Transportation Research Part F: Traffic Psychology and Behaviour, 11(2), 83–95. https://doi.org/10.1016/j.trf.2007.08.004
- Bhowmick, D., Saberi, M., Stevenson, M., Thompson, J., Winters, M., Nelson, T., Leao, S. Z., Seneviratne, S., Pettit, C., Vu, H. L., Nice, K., & Beck, B. (2023). A systematic scoping review of methods for estimating link-level bicycling volumes. Transport Reviews, 43(4), 622–651. https://doi.org/10.1080/01441647.2022.2147240
- Bianchi, F. (2021). Learning from experience: A set of European policies. In P. Pileri, & R. Moscarelli (Eds.), Research for development: Cycling & walking for regional development (pp. 177–204). Springer. https://doi.org/10.1007/978-3-030-44003-9_13
- Boeing, G. (2017). OSMnx: New methods for acquiring, constructing, analyzing, and visualizing complex street networks. Computers, Environment and Urban Systems, 65, 126–139. https://doi.org/10.1016/j.compenvurbsys.2017.05.004
- Boisjoly, G., & El-Geneidy, A. M. (2017). The insider: A planners’ perspective on accessibility. Journal of Transport Geography, 64, 33–43. https://doi.org/10.1016/j.jtrangeo.2017.08.006
- Boisjoly, G., Lachapelle, U., & El-Geneidy, A. (2020). Bicycle network performance: Assessing the directness of bicycle facilities through connectivity measures, a Montreal, Canada case study. International Journal of Sustainable Transportation, 14(8), 620–634. https://doi.org/10.1080/15568318.2019.1595791
- Bres, R., Peralta, V., Le-Guilcher, A., Devogele, T., Olteanu Raimond, A.-M., & de Runz, C. (2023). Analysis of cycling network evolution in OpenStreetMap through a data quality prism. 26th agile conference on geographic information science 2023, Delft, the Netherlands, AGILE: Giscience Series, 4, 3. https://doi.org/10.5194/agile-giss-4-3-2023
- Broach, J., & Dill, J. (2016). Using predicted bicyclist and pedestrian route choice to enhance mode choice models. Transportation Research Record: Journal of the Transportation Research Board, 2564(1), 52–59. https://doi.org/10.3141/2564-06
- Buehler, R., & Dill, J. (2016). Bikeway networks: A review of effects on cycling. Transport Reviews, 36(1), 9–27. https://doi.org/10.1080/01441647.2015.1069908
- Cabral, L., & Kim, A. M. (2022). An empirical reappraisal of the level of traffic stress framework for segments. Travel Behaviour and Society, 26, 143–158. https://doi.org/10.1016/j.tbs.2021.09.007
- Cabral, L., Kim, A. M., & Shirgaokar, M. (2019). Low-stress bicycling connectivity: Assessment of the network build-out in Edmonton, Canada. Case Studies on Transport Policy, 7(2), 230–238. https://doi.org/10.1016/j.cstp.2019.04.002
- Castañon, U. N., & Ribeiro, P. J. G. (2021). Bikeability and emerging phenomena in cycling: Exploratory analysis and review. Sustainability (Switzerland), 13(4), 1–21. https://doi.org/10.3390/su13042394
- Cervero, R., Denman, S., & Jin, Y. (2019). Network design, built and natural environments, and bicycle commuting: Evidence from British cities and towns. Transport Policy, 74, 153–164. https://doi.org/10.1016/j.tranpol.2018.09.007
- Chan, E. Y. C., & Cooper, C. H. V. (2019). Using road class as a replacement for predicted motorized traffic flow in spatial network models of cycling. Scientific Reports, 9(1). https://doi.org/10.1038/s41598-019-55669-8
- Chiaradia, A., Cooper, C. H., & Wedderburn, M. (2014). Network geography and accessibility. In 12th transport practitioners’ meeting. PTRC.
- Chou, K.-Y., Paulsen, M., Nielsen, O. A., & Jensen, A. F. (2023). Analysis of cycling accessibility using detour ratios – A large-scale study based on crowdsourced GPS data. Sustainable Cities and Society, 93, 104500. https://doi.org/10.1016/j.scs.2023.104500
- Cooper, C. H. V. (2015). Spatial localization of closeness and betweenness measures: A self-contradictory but useful form of network analysis. International Journal of Geographical Information Science, 29(8), 1293–1309. https://doi.org/10.1080/13658816.2015.1018834
- Cooper, C. H. V. (2017). Using spatial network analysis to model pedal cycle flows, risk and mode choice. Journal of Transport Geography, 58, 157–165. https://doi.org/10.1016/j.jtrangeo.2016.12.003
- Cooper, C. H. V. (2018). Predictive spatial network analysis for high-resolution transport modeling, applied to cyclist flows, mode choice, and targeting investment. International Journal of Sustainable Transportation, 12(10), 714–724. https://doi.org/10.1080/15568318.2018.1432730
- Cooper, C. H. V., & Chiaradia, A. J. F. (2020). sDNA: 3-d spatial network analysis for GIS, CAD, Command Line & Python. SoftwareX, 12, 100525. https://doi.org/10.1016/j.softx.2020.100525
- Cooper, C. H. V., Harvey, I., Orford, S., & Chiaradia, A. J. F. (2021). Using multiple hybrid spatial design network analysis to predict longitudinal effect of a major city centre redevelopment on pedestrian flows. Transportation, 48(2), 643–672. https://doi.org/10.1007/s11116-019-10072-0
- Costa, M., Marques, M., & Moura, F. (2021). A circuity temporal analysis of urban street networks using open data: A Lisbon case study. ISPRS International Journal of Geo-Information, 10(7), 453. https://doi.org/10.3390/ijgi10070453
- Cunha, I., & Silva, C. (2023). Assessing the equity impact of cycling infrastructure allocation: Implications for planning practice. Transport Policy, 133, 15–26. https://doi.org/10.1016/j.tranpol.2022.12.021
- Doran, A., El-Geneidy, A., & Manaugh, K. (2021). The pursuit of cycling equity: A review of Canadian transport plans. Journal of Transport Geography, 90, 102927. https://doi.org/10.1016/j.jtrangeo.2020.102927
- Ellis, G., Hunter, R., Tully, M. A., Donnelly, M., Kelleher, L., & Kee, F. (2016). Connectivity and physical activity: Using footpath networks to measure the walkability of built environments. Environment and Planning B: Planning and Design, 43(1), 130–151. https://doi.org/10.1177/0265813515610672
- Feng, C., & Zhang, W. (2019). Algorithms for the parametric analysis of metric, directional, and intersection reach. Environment and Planning B: Urban Analytics and City Science, 46(8), 1422–1438. https://doi.org/10.1177/2399808319827299
- Ferster, C., Fischer, J., Manaugh, K., Nelson, T., & Winters, M. (2020). Using OpenStreetMap to inventory bicycle infrastructure: A comparison with open data from cities. International Journal of Sustainable Transportation, 14(1), 64–73. https://doi.org/10.1080/15568318.2018.1519746
- Fishman, E. (2016). Cycling as transport. Transport Reviews, 36(1), 1–8. https://doi.org/10.1080/01441647.2015.1114271
- Freeman, L. C. (1977). A set of measures of centrality based on betweenness. Sociometry, 35–41. https://doi.org/10.2307/3033543
- Furth, P. G., Mekuria, M. C., & Nixon, H. (2016). Network connectivity for low-stress bicycling. Transportation Research Record: Journal of the Transportation Research Board, 2587(1), 41–49. https://doi.org/10.3141/2587-06
- Furth, P. G., Putta, T. V. V. K., & Moser, P. (2018). Measuring low-stress connectivity in terms of bike-accessible jobs and potential bike-to-work trips: A case study evaluating alternative bike route alignments in Northern Delaware. Journal of Transport and Land Use, 11(1), 815–831. https://doi.org/10.5198/jtlu.2018.1159
- Gehrke, S. R., Akhavan, A., Furth, P. G., Wang, Q., & Reardon, T. G. (2020). A cycling-focused accessibility tool to support regional bike network connectivity. Transportation Research Part D: Transport and Environment, 85, 102388. https://doi.org/10.1016/j.trd.2020.102388
- Geurs, K. T., & van Wee, B. (2004). Accessibility evaluation of land-use and transport strategies. Review and Research Directions. Journal of Transport Geography, 12(2), 127–140. https://doi.org/10.1016/j.jtrangeo.2003.10.005
- Gholamialam, A., & Matisziw, T. C. (2019). Modeling bikeability of urban systems. Geographical Analysis, 51(1), 73–89. https://doi.org/10.1111/gean.12159
- Goodman, A., Brand, C., & Ogilvie, D. (2012). Associations of health, physical activity and weight status with motorised travel and transport carbon dioxide emissions: A cross-sectional, observational study. Environmental Health: A Global Access Science Source, 11(52), PMC3536622. https://doi.org/10.1186/1476-069X-11-52
- Heinen, E., van Wee, B., & Maat, K. (2010). Commuting by bicycle: An overview of the literature. Transport Reviews, 30(1), 59–96. https://doi.org/10.1080/01441640903187001
- Henderson, J., & Gulsrud, N. M. (2019). Street fights in Copenhagen: Bicycle and car politics in a green mobility city. Routledge.
- Hillier, W. R. G., Yang, T., & Turner, A. (2012). Normalising least angle choice in Depthmap – And how it opens up new perspectives on the global and local analysis of city space. Journal of Space Syntax, 3(2), 155–193.
- Hochmair, H. H., Bardin, E., & Ahmouda, A. (2019). Estimating bicycle trip volume for Miami-Dade County from Strava tracking data. Journal of Transport Geography, 75, 58–69. https://doi.org/10.1016/j.jtrangeo.2019.01.013
- Imani, A. F., Miller, E. J., & Saxe, S. (2019). Cycle accessibility and level of traffic stress: A case study of Toronto. Journal of Transport Geography, 80, 102496. https://doi.org/10.1016/j.jtrangeo.2019.102496
- Kazemzadeh, K., Laureshyn, A., Hiselius, L. W., & Ronchi, E. (2020). Expanding the scope of the bicycle level-of-service concept: A review of the literature. Sustainability, 12(7), 2944. https://doi.org/10.3390/su12072944
- Kent, M., & Karner, A. (2019). Prioritizing low-stress and equitable bicycle networks using neighborhood-based accessibility measures. International Journal of Sustainable Transportation, 13(2), 100–110. https://doi.org/10.1080/15568318.2018.1443177
- Knight, P. L., & Marshall, W. E. (2015). The metrics of street network connectivity: Their inconsistencies. Journal of Urbanism, 8(3), 241–259. https://doi.org/10.1080/17549175.2014.909515
- Lamu, A. N., Jbaily, A., Verguet, S., Robberstad, B., & Norheim, O. F. (2020). Is cycle network expansion cost-effective? A health economic evaluation of cycling in Oslo. BMC Public Health, 20(1869). https://doi.org/10.1186/s12889-020-09764-5
- Landis, B. W., Vattikuti, V. R., & Brannick, M. T. (1997). Real-time human perceptions: Toward a bicycle level of service. Transportation Research Record: Journal of the Transportation Research Board, 1578(1), 119–126. https://doi.org/10.3141/1578-15
- Law, S., Sakr, F. L., & Martinez, M. (2014). Measuring the changes in aggregate cycling patterns between 2003 and 2012 from a space syntax perspective. Behavioral Sciences, 4(3), 278–300. https://doi.org/10.3390/bs4030278
- Lee, K., & Sener, I. N. (2021). Strava Metro data for bicycle monitoring: A literature review. Transport Reviews, 41(1), 27–47. https://doi.org/10.1080/01441647.2020.1798558
- Lowry, M., Callister, D., Gresham, M., & Moore, B. (2012). Assessment of communitywide bikeability with bicycle level of service. Transportation Research Record: Journal of the Transportation Research Board, 2314(1), 41–48. https://doi.org/10.3141/2314-06
- Lowry, M., & Loh, T. H. (2017). Quantifying bicycle network connectivity. Preventive Medicine, 95, S134–S140. https://doi.org/10.1016/j.ypmed.2016.12.007
- Lowry, M. B., Furth, P., & Hadden-Loh, T. (2016). Prioritizing new bicycle facilities to improve low-stress network connectivity. Transportation Research Part A: Policy and Practice, 86, 124–140. https://doi.org/10.1016/j.tra.2016.02.003
- Manum, B., & Nordstrom, T. (2013). Integrating bicycle network analysis in urban design: Improving bikeability in Trondheim by combining space syntax and GIS-methods using the place syntax tool. 9th International Space Syntax Symposium, 28, Seoul, Korea, 1–14.
- Manum, B., Nordström, T., Gil, J., Nilsson, L., & Marcus, L. (2017). Modelling bikeability: Space syntax based measures applied in examining speeds and flows of bicycling in Gothenburg. 11th international space syntax symposium, Lisbon, Portugal, 89.1–89.16.
- Marshall, S., Gil, J., Kropf, K., Tomko, M., & Figueiredo, L. (2018). Street network studies: From networks to models and their representations. Networks and Spatial Economics, 18(3), 735–749. https://doi.org/10.1007/s11067-018-9427-9
- Marshall, W. E., & Garrick, N. W. (2012). Community design and how much we drive. Journal of Transport and Land Use, 5(2), 5–21. https://doi.org/10.5198/jtlu.v5i2.301
- Martinez, A., Phair, C., Russo, B., & Gehrke, S. (2024). Exploring neighborhood differences in bicycling accessibility to physical and virtual workplaces. Transportation Research Record: Journal of the Transportation Research Board, 2678(3), 108–121. https://doi.org/10.1177/03611981231178811
- McCahill, C., & Garrick, N. (2008). The applicability of space syntax to bicycle facility planning. Transportation Research Record: Journal of the Transportation Research Board, 2074(1), 46–51. https://doi.org/10.3141/2074-06
- McDaniel, S., Lowry, M. B., & Dixon, M. (2014). Using origin-destination centrality to estimate directional bicycle volumes. Transportation Research Record: Journal of the Transportation Research Board, 2430(1), 12–19. https://doi.org/10.3141/2430-02
- Mekuria, M. C., Furth, P. G., & Nixon, H. (2012). Low-stress bicycling and network connectivity.
- Mölenberg, F. J. M., Panter, J., Burdorf, A., & Van Lenthe, F. J. (2019). A systematic review of the effect of infrastructural interventions to promote cycling: Strengthening causal inference from observational data. International Journal of Behavioral Nutrition and Physical Activity, 16(1), 93. https://doi.org/10.1186/s12966-019-0850-1
- Moran, S. K., Tsay, W., Lawrence, S., & Krykewycz, G. R. (2018). Lowering bicycle stress one link at a time: Where should we invest in infrastructure? Transportation Research Record: Journal of the Transportation Research Board, 2672(36), 33–41. https://doi.org/10.1177/0361198118783109
- Mueller, N., Rojas-Rueda, D., Salmon, M., Martinez, D., Ambros, A., Brand, C., de Nazelle, A., Dons, E., Gaupp-Berghausen, M., Gerike, R., Götschi, T., Iacorossi, F., Int Panis, L., Kahlmeier, S., Raser, E., Nieuwenhuijsen, M., & PASTA consortium. (2018). Health impact assessment of cycling network expansions in European cities. Preventive Medicine, 109, 62–70. https://doi.org/10.1016/j.ypmed.2017.12.011
- Murphy, B., & Owen, A. (2019). Implementing low-stress bicycle routing in national accessibility evaluation. Transportation Research Record: Journal of the Transportation Research Board, 2673(5), 240–249. https://doi.org/10.1177/0361198119837179
- Nordström, T., & Manum, B. (2015). Measuring bikeability: Space syntax based methods applied in planning for improved conditions for bicycling in Oslo. 10th international space syntax symposium. London, UK, 13–17.
- Orellana, D., & Guerrero, M. L. (2019a). Exploring the influence of road network structure on the spatial behaviour of cyclists using crowdsourced data. Environment and Planning B: Urban Analytics and City Science, 46(7), 1314–1330. https://doi.org/10.1177/2399808319863810
- Orellana, D., & Guerrero, M. L. (2019b). The influence of space syntax on cycling movement in Manta, Ecuador. 12th international space syntax symposium, Beijing, People’s Republic of China, 227.
- Orozco, L. G. N., Battiston, F., Iniguez, G., & Szell, M. (2020). Data-driven strategies for optimal bicycle network growth. Royal Society Open Science, 7(12), 201130. https://doi.org/10.1098/rsos.201130
- Ospina, J. P., Duque, J. C., Botero-Fernández, V., & Brussel, M. (2022a). Understanding the effect of sociodemographic, natural and built environment factors on cycling accessibility. Journal of Transport Geography, 102, 103386. https://doi.org/10.1016/j.jtrangeo.2022.103386
- Ospina, J. P., Duque, J. C., Botero-Fernández, V., & Montoya, A. (2022b). The maximal covering bicycle network design problem. Transportation Research Part A: Policy and Practice, 159, 222–236. https://doi.org/10.1016/j.tra.2022.02.004
- Pafka, E., Dovey, K., & Aschwanden, G. D. (2020). Limits of space syntax for urban design: Axiality, scale and sinuosity. Environment and Planning B: Urban Analytics and City Science, 47(3), 508–522. https://doi.org/10.1177/2399808318786512
- Panter, J., Guell, C., Humphreys, D., & Ogilvie, D. (2019). Title: Can changing the physical environment promote walking and cycling? A systematic review of what works and how. Health & Place, 58, 102161. https://doi.org/10.1016/j.healthplace.2019.102161
- Perez, B. O., Buck, D., Ma, Y. W., Robey, T., & Lucas, K. (2017). Mind the gap: Assessing the impacts of bicycle accessibility and mobility on mode share in Washington, D.C. Transportation Research Record: Journal of the Transportation Research Board, 2662(1), 83–92. https://doi.org/10.3141/2662-10
- Pucher, J., & Buehler, R. (2017). Cycling towards a more sustainable transport future. Transport Reviews, 37(6), 689–694. https://doi.org/10.1080/01441647.2017.1340234
- Putta, T., & Furth, P. G. (2019). Method to identify and visualize barriers in a low-stress bike network. Transportation Research Record: Journal of the Transportation Research Board, 2673(9), 452–460. https://doi.org/10.1177/0361198119847617
- Putta, T., & Furth, P. G. (2021). Impact of one-way streets and contraflow on low-stress bicycle network connectivity. Transportation Research Record: Journal of the Transportation Research Board, 2675(10), 1174–1183. https://doi.org/10.1177/03611981211014893
- Quattrone, G., Mashhadi, A., & Capra, L. (2014). Mind the map: The impact of culture and economic affluence on crowd-mapping behaviours. 17th acm Conference on Computer Supported Cooperative Work & Social Computing (CSCW 2014). Association for Computing Machinery, NY, USA, 934–944.
- Reggiani, G., van Oijen, T., Hamedmoghadam, H., Daamen, W., Vu, H. L., & Hoogendoorn, S. (2022). Understanding bikeability: A methodology to assess urban networks. Transportation, 49(3), 897–925. https://doi.org/10.1007/s11116-021-10198-0
- Rosas-Satizábal, D., Guzman, L. A., & Oviedo, D. (2020). Cycling diversity, accessibility, and equality: An analysis of cycling commuting in Bogotá. Transportation Research Part D: Transport and Environment, 88, 102562. https://doi.org/10.1016/j.trd.2020.102562
- Rupi, F., Poliziani, C., & Schweizer, J. (2019). Data-driven bicycle network analysis based on traditional counting methods and GPS traces from smartphone. ISPRS International Journal of Geo-Information, 8(8), 322. https://doi.org/10.3390/ijgi8080322
- Ryu, S., Chen, A., Su, J., & Choi, K. (2018). Two-stage bicycle traffic assignment model. Journal of Transportation Engineering Part A: Systems, 144(2).
- Ryu, S., Chen, A., Su, J., & Choi, K. (2021a). A multi-class, multi-criteria bicycle traffic assignment model. International Journal of Sustainable Transportation, 15(7), 524–540. https://doi.org/10.1080/15568318.2020.1770906
- Ryu, S., Chen, A., Su, J., Liu, X., & Yu, J. (2021b). Considering space syntax in bicycle traffic assignment with one or more user classes. Sustainability (Switzerland), 13(19). https://doi.org/10.3390/su131911078
- Saxe, S., & Kasraian, D. (2020). Rethinking environmental LCA life stages for transport infrastructure to facilitate holistic assessment. Journal of Industrial Ecology, 24(5), 1031–1046. https://doi.org/10.1111/jiec.13010
- Semler, C., Sanders, M., Buck, D., Dock, S., Cesme, B., & Wang, S. (2018). The keys to connectivity: The district of Columbia’s innovative approach to unlocking low-stress bicycle networks. Transportation Research Record: Journal of the Transportation Research Board, 2672(36), 63–72. https://doi.org/10.1177/0361198118798445
- Soltani, A., Allan, A., Javadpoor, M., & Lella, J. (2022). Space syntax in analysing bicycle commuting routes in inner metropolitan Adelaide. Sustainability (Switzerland), 14(6). https://doi.org/10.3390/su14063485
- Stangl, P. (2012). The pedestrian route directness test: A new level-of-service model. Urban Design International, 17(3), 228–238. https://doi.org/10.1057/udi.2012.14
- Szell, M., Mimar, S., Perlman, T., Ghoshal, G., & Sinatra, R. (2022). Growing urban bicycle networks. Scientific Reports, 12(1), 6765. https://doi.org/10.1038/s41598-022-10783-y
- Vale, D. S., Saraiva, M., & Pereira, M. (2016). Active accessibility: A review of operational measures of walking and cycling accessibility. Journal of Transport and Land Use, 9(1), 209–235. http://doi.org/10.5198/jtlu.2015.593
- Vierø, A. R., Vybornova, A., & Szell, M. (2023). BikeDNA: A tool for bicycle infrastructure data and network assessment. Environment and Planning B: Urban Analytics and City Science, 51(2), 512–528. https://doi.org/10.1177/23998083231184471
- Vybornova, A., Cunha, T., Guhnemann, A., & Szell, M. (2022). Automated detection of missing links in bicycle networks. Geographical Analysis, 55(2), 239–267. https://doi.org/10.1111/gean.12324
- Wang, K. L., Akar, G., Lee, K., & Sanders, M. (2020). Commuting patterns and bicycle level of traffic stress (LTS): Insights from spatially aggregated data in Franklin County, Ohio. Journal of Transport Geography, 86, 102751. https://doi.org/10.1016/j.jtrangeo.2020.102751
- Wasserman, D., Rixey, A., Zhou, X. Y., Levitt, D., & Benjamin, M. (2019). Evaluating OpenStreetMap’s performance potential for level of traffic stress analysis. Transportation Research Record: Journal of the Transportation Research Board, 2673(4), 284–294. https://doi.org/10.1177/0361198119836772
- Wilson, A., & Mitra, R. (2020). Implementing cycling infrastructure in a politicized space: Lessons from Toronto, Canada. Journal of Transport Geography, 86, 102760. https://doi.org/10.1016/j.jtrangeo.2020.102760
- Wysling, L., & Purves, R. S. (2022). Where to improve cycling infrastructure? Assessing bicycle suitability and bikeability with open data in the city of Paris. Transportation Research Interdisciplinary Perspectives, 15, 100648. https://doi.org/10.1016/j.trip.2022.100648
- Yang, Y., Wu, X., Zhou, P., Gou, Z., & Lu, Y. (2019). Towards a cycling-friendly city: An updated review of the associations between built environment and cycling behaviors (2007–2017). Journal of Transport & Health, 14, 100613. https://doi.org/10.1016/j.jth.2019.100613
- Zuo, T., & Wei, H. (2019). Bikeway prioritization to increase bicycle network connectivity and bicycle-transit connection: A multi-criteria decision analysis approach. Transportation Research Part A: Policy and Practice, 129, 52–71. https://doi.org/10.1016/j.tra.2019.08.003
- Zuo, T., Wei, H., & Chen, N. (2021). Incorporating low-stress bicycling connectivity into expanded transit service coverage. Transportation Research Record: Journal of the Transportation Research Board, 2675(4), 79–89. https://doi.org/10.1177/0361198121998956
- Zuo, T., Wei, H., Chen, N., & Zhang, C. (2020). First-and-last mile solution via bicycling to improving transit accessibility and advancing transportation equity. Cities, 99, 102614. doi:10.1016/j.cities.2020.102614