
 ?Mathematical formulae have been encoded as MathML and are displayed in this HTML version using MathJax in order to improve their display. Uncheck the box to turn MathJax off. This feature requires Javascript. Click on a formula to zoom.
ABSTRACT
Uncertainties remain regarding the carbon (C) loss due to scarification in afforested lichen woodlands (LW), which originate from regeneration failures of closed-crown black spruce- feathermoss stands due to compounded disturbances. Therefore, the objective of this study was to characterize the C stock changes in the forest floor of scarified, unharvested LWs. Ten afforestation trials were established from 1999 to 2014 in LWs in the managed boreal forest of Québec. Ground surface layers were sampled in 2017 for different microsites. From 3 to 18 years after treatment, scarified floors exhibited ≈ 2 Mg ha−1 C loss, due to opposite trends in the furrow and ridge microsites. Both gradually approached the undisturbed C density level of forest floor between furrow pairs and between skidder trails microsites without reaching it after 18 years. This suggests that microsite C density continued to evolve afterward, and that losses due to scarification might be recovered, due to a higher potential gain in the furrow microsites combined with a lower expected loss in the ridge microsites. Carbon managers should use a permanent 2 Mg ha−1 C loss in the forest floor due to scarification in LWs, acknowledging that this is offset by the growth of planted trees.
Introduction
The boreal forest is a vast circumpolar biome that stocks nearly 23% of terrestrial carbon (C), of which soils account for about 84% of storage (Thurner et al. Citation2014). This biome exhibits considerable variability in tree density, and consequently, marked variation in forest C stocks (Tremblay et al. Citation2002). Lichen woodlands (LWs) are open woodlands in the boreal forest that have originated from a regeneration failure occurring in formerly closed-canopy black spruce (Picea mariana [Mill.] B.S.P.) stands due to compound natural disturbances (Jasinski and Payette Citation2005; Côté et al. Citation2013). In Quebec (Canada), this stand type covers about 1.3 × 10⁶ hectares of the province’s land surface (Ministère des Ressources naturelles et des Forêts du Québec, 4th decennial inventory), and it continues to expand mostly through increasing wildfire frequency (Girard et al. Citation2008). Considering their frequent occurrence, afforestation of open woodlands could be viewed as a valuable strategy for mitigating anthropogenic climate warming, and has received considerable attention over the past several decades (e.g. Gaboury et al. Citation2009; Boucher et al. Citation2012; Tremblay et al. Citation2013; Hébert et al. Citation2014; Ouimet et al. Citation2018).
Combining scarification and planting, without previous tree harvesting, would appear to be the most efficient way of sequestering C in afforested LWs (Hébert et al. Citation2006; Boucher et al. Citation2012; Tremblay et al. Citation2013; Hébert et al. Citation2014), but a few uncertainties still remain. Among these, is the quantity of C that is lost to the atmosphere through soil scarification. In fact, the effect of this treatment on C fluxes is not presently integrated into the C-budget model of the Canadian forest sector (CBM-CFS3) (Kurz et al. Citation2009). An abundant literature exists regarding soil C stock changes in the context of forest restoration with ploughing in former croplands (Vesterdal et al. Citation2002; Tremblay et al. Citation2006; Ouimet et al. Citation2007; Tremblay and Ouimet Citation2013), but LWs occur mostly on coarse- textured acidic Podzols (Spodosols) that are not suitable for agriculture, which implies different C sequestration and decay dynamics. Short-term investigations of C stocks and fluxes have been conducted in these kinds of soil in clear-cuts, followed by site preparation (Smolander and Heiskanen Citation2007; Strömgren and Mjöfors Citation2012; Piirainen et al. Citation2015), but few long-term studies have been performed (Mjöfors et al. Citation2017; Mäkipää et al. Citation2023). All of these experiments were conducted in Scandinavia and none have touched upon the specific case of North American LWs afforestation. Consequently, C loss to the atmosphere in C accounting models must be “guesstimated” when data are not available, for example, assuming an initial loss of 4 Mg C ha−1 within afforested LWs when using CBM-CFS3 (Boucher et al. Citation2012); due to lack of data, modelling may proceed without any real notion of the soil C recovery trajectory over time.
Scarification in Quebec’s boreal forests typically uses a disc trencher that creates furrows, where organic layers are lifted and partially inverted, thereby forming a ridge-shaped edge or berm (Sutton Citation1993). When including undisturbed microsites, i.e. the soil area between pairs of furrows or between skidder trails (), the forest floor is left with a diversity of microsites where C stock changes may differ greatly. Nevertheless, as scarification increases soil temperature in the mounds (Sutton Citation1993; Hansson et al. Citation2018) and furrows (Boucher et al. Citation2001; Tremblay et al. Citation2013; Hansson et al. Citation2018), faster organic matter decay is likely expected, accompanied by subsequent C-loss from the ecosystem (Coursolle et al. Citation2012). Yet, little is known about temperature changes in the undisturbed microsites (between furrows and skidder trails) in LWs. In a similar ecosystem that is used in Sweden, this temperature-driven response seems weaker than in ridges and furrows (Hansson et al. Citation2018). Decreased gross productivity accompanying vegetation loss (Giasson et al. Citation2006), together with increased respiration resulting from more accumulated dead organic matter and higher temperatures (Mallik and Hu Citation1997; Coursolle et al. Citation2012), should result in a net C-loss following scarification. The time frame associated with this process has yet to be determined.
Figure 1. Schematic representation of microsite types that are encountered in a sampling transect. Abbreviations for microsite types: ridge (RID); furrow (FUR); between furrows pair (BFP); and between skidder trails (BST).
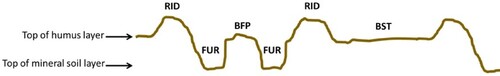
The objective of this study was to characterize temporal changes in forest floor C-pools (humus and litter) of scarified, unharvested LWs in an afforestation context. We hypothesized that disturbance applied in the furrows and ridges would stimulate net lasting loss of dead organic matter, particularly in the scarification ridges, thereby resulting only from a little amount of organic matter typically being left in the furrows following trenching. The underlying mineral layer was not included in this study, given that organic-C in these coarse-textured soils is only slightly labile (Maillard et al. Citation2010; Hansson et al. Citation2018), and is significantly less disturbed or exposed to the weather during scarification, compared to the humus layer.
Material and methods
Study area and treatment
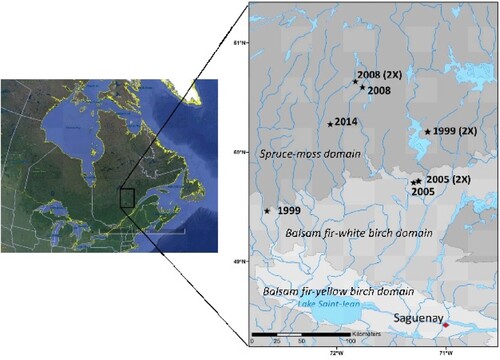
Ten afforestation sites that were established from 1999 to 2014 on LWs within Québec’s managed boreal forest were selected to form a chronosequence. Assessments were performed in summer 2017 (). The six (6) older sites, i.e. all of those that were established in 1999 and 2005, were part of former published studies (Tremblay et al. Citation2013; Hébert et al. Citation2014; Dufour et al. Citation2016), while the four (4) younger sites were more recently established plantations, i.e. 2008 and 2014 (). Original stands in all sites were naturally established LWs and were similar in terms of soil deposits, slope, aspect, and tree composition and density (high black spruce dominance, Cladonia-dominated groundcover, < 25% tree cover). Soils were deep (> 50 cm), podzolized coarse glacial till deposits overlain by 10-20 cm organic layers, which did not limit disc scarification (Ouimet et al. Citation2018; Boucher et al. Citation2019).
Figure 2. Geographical location of the experimental sites in the Quebec’s managed boreal forest, Canada.
Scarification was performed without prior tree harvesting, due to inherently low tree density of approximately 100–600 stem per hectare (Dufour et al. Citation2016; Fradette et al. Citation2021). Either a mechanical or hydraulic TTS disc trencher (Sutton Citation1993) that was hauled by a forest skidder was used, while avoiding tree patches. This led to a rather irregular trenching pattern, compared to the more regularly 2 m spacing of trenches that are normally created by scarification following clear-cutting. This type of disc trencher created two furrows that were separated by a 1.3–2 m-wide band, onto which saplings and shrubs could be bent down by machine passage. Yet, the soil and low ground vegetation remained mainly undisturbed. Furrows about 30 cm-wide were created by displacing the organic layers and a few centimetres (variable) of upper mineral soil onto the outer border of the furrow, forming a mounded ridge running parallel to the furrows (see ) that contained mostly organic material mixed with a variable amount of mineral soil.
Sampling
On each site, sampling was conducted along five transects, starting from a mounded ridge adjacent to a furrow, and following a line perpendicular to the furrows. While the sampler progressed along a transect, the length of every microsite that was encountered was measured and classified according to one of four following microsite types: ridge (RID); furrow (FUR); between furrow pairs (BFP); and between skidder trails (BST), where tree patches formed part of the BST (). On each microsite that was encountered, a core was randomly taken from the ground surface layers (dead organic matter and biomass, excluding thick wooden roots) using a volumetric hammer core sampler (5 cm diameter), with the objective of including the entire organic layer depth, until mineral soil was reached. Any trace of mineral layers was removed from the cores, as a result there was virtually no mineral soil material in all sampled organic matter cores. Samples from each microsite type per transect were pooled in a sealed plastic bag for transport. Transects were variable in length between sites, with the goal of obtaining five sampling cores per microsite type in each site (minimum transect length was 20 m), for a total of 20 sample cores per site (5 cores × 4 microsite types). The five transects per site were spaced 10 m apart, except for 5 m spacing employed in one of the 1999 trial field because it had an elongated shape with a generally narrow width, so the part that allowed for the minimum of 5 occurrences for each microsite type in a transect was too short with a 10 m spacing. However, the 5 m spacing is still consistent with the minimum distance that was recommended by Kristensen et al. (Citation2015).
To form a control plot, five cores were taken every 10 m along five transects that were separated by 10 m, thereby forming a 40 m × 40 m square. The control material was sampled on a nearby (< 100 m from the treated plots), undisturbed area of each LW.
Sample and data processing
In the laboratory, cored material from every bag was separated into living biomass (BIOM) and dead organic matter (DOM) C pools. Both were oven-dried to constant mass (60 oC for 48 h). Weighing was performed with 0.01 g accuracy. C fraction was considered to constitute 50% of dry mass in BIOM (IPCC Citation2003). In DOM, lichen woodland C fraction is known to be very variable (Boucher et al. Citation2019). To account for this uncertainty, a site-specific carbon fraction was randomly generated for each site around the mean value and the standard deviation measured in the forecited paper (36.8% ± 5.9%), for all sites in our study, except two that were in common with Boucher et al. (Citation2019), so their respective measured values were used instead. For each transect, the C values were divided by the number of cored microsites of the same type to obtain a single mean sample value for microsite type (RID, FUR, BFP, BST) and pool (BIOM, DOM).
The core sampler surface area was used to convert the sample C mass (in grams) to C density values (kilograms per square meter). These latter values were then converted to Mg of C per hectare, and weighted by the ratio representing the proportion that was occupied by the respective microsite type in the transect (), to give the C-stock for the microsite. The sum of all the microsite stocks provided a stand-level C-stock estimate for a given site.
Table 1. Mean forest floor cover percentages and their respective standard deviations for each microsite type in the sampled sites
Given that the chronosequence design confounds sites and years-since-scarification, the effect of time is mixed with natural variation in site productivity and the variable skidder circulation pattern. To refine the time signal, a standardized value of the C-stocks was computed by dividing each individual C-stock value by its site-specific control plot stock, and multiplying by the overall mean control stock and the overall mean surface proportion occupied by the microsite being considered.
Data analysis
Different analyses of variance (ANOVAs) were performed with JMP version 12 (SAS Institute Inc., Cary, NC, USA). When time-since-scarification was included in the model, it was considered a between-plot factor. Site ID was included as a random factor within which time was nested, given that every site is matched with a single time. Variance components were estimated by restricted maximum likelihood (REML). All other fixed factors (C pool, microsite, and scarification) were then considered as within-plot treatments. Multiple comparisons were made with Student t-tests. Logarithmic or “log + 1” transformations were made when necessary to homogenize the variance. Differences were considered significant at P < 0.05.
Different standardized variables were tested for their departure from their respective expected control value with a one-tailed Student t-test, as this approach provided a more powerful comparison than ANOVA. A first variable was the standardization ratio (C density value/control C density value) that was tested for its departure from the expected value of no difference between treated and control plots, which is 1. As explained above, a second variable was the standardized C stock that was compared with the mean C stock in the control plots of the study, which is 50.62 Mg ha−1. This value was multiplied by the mean forest floor cover percentage of each microsite type () for having a microsite- specific control value against which it could be checked. A last variable was the C-stock delta values (raw C stock – specific control C stock), which tested its departure from 0.
Results
Significant effects of time and microsites, and their interaction, were exerted on C density (, ). Overall C densities in BFP and BST microsites were similar to the control plots at any time step (). Compared to control, C density was systematically lower in the FUR, and higher in the RID. Generally, FUR and RID together represented about one-third of the surface area in the scarified plots, while the remaining surface was occupied by microsites that were disturbed at a lesser degree (BST and BFP; ).
Figure 3. Total C density by microsite type and time-since-scarification of the LW floor. Letters indicate a time-wise main effect multiple comparison between microsites. Refer to for microsite type abbreviations.
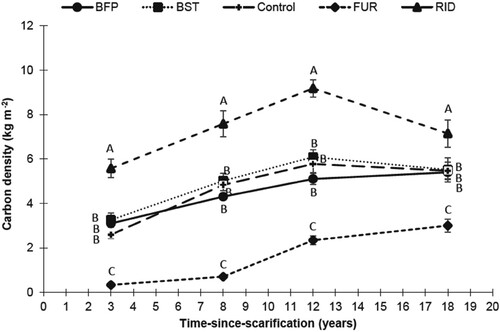
Table 2. Fixed effects of the ANOVAs of time from scarification and type of microsite on total carbon density (CDTOT), and time from scarification and scarification treatment on total carbon stock (CTOT).
Raw (un-standardized) C stocks exhibited no significant influence of scarification on total C content (). Time showed a significant effect on raw C stocks, but these results present confounded time and site effects, while results from standardized C stocks (relative to control stocks and typical microsite coverages) showed no significant change over time in overall C stocks following scarification (). Yet, all interactions including time and microsites were highly significant; there were significant time trends for some microsites, namely, FUR and RID (, (c)). Furrows exhibited increasing C stocks with time after 8 years of recovery, mainly through increasing stocks in DOM ((b)). At the same time, RID C stocks lost around 4 Mg of C from year 3–18 following scarification ((c)), mainly in DOM ((b)), while there is no consistent change in BIOM ((a)). Another notable result that appeared after standardization was the non-significant time trend in BFP and BST C (, (c)). However, the C density of the second tended to be always higher than the first but this pattern was not significant at any time stage using unstandardized data (), while a significant difference appeared at 12 years after scarification once the data was standardized ().
Figure 4. Standardized C stocks by treatment and time-since-scarification of (a) living biomass (BIOM), (b) dead organic matter (DOM) and (c) total floor. Letters indicate a microsite-wise main effect multiple comparison between time steps. Refer to for microsite type abbreviations.
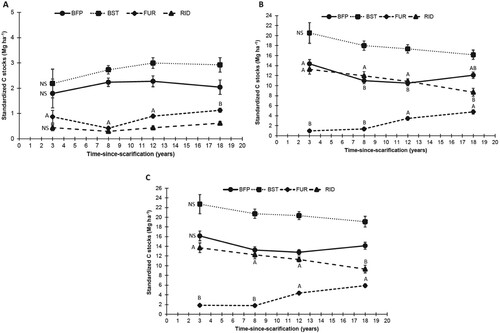
Figure 5. Total standardized C density by microsite types and time-since-scarification of the LW floor. Letters indicate a time-wise main effect multiple comparison between microsites. Refer to for microsite type abbreviations.
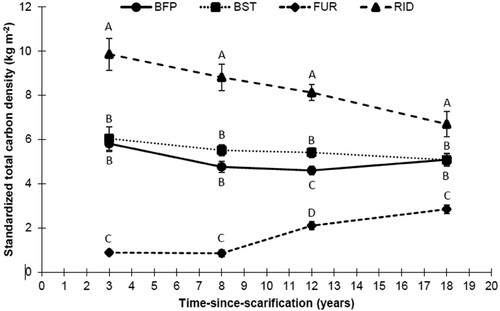
Table 3. Fixed effects of the ANOVAs of time from scarification and microsite on standard carbon stocks in the biomass pool (BIOM) and the humus pool (DOM). The tests on combined pools stocks and density (TOT) are also shown.
Student t-tests on fixed values in revealed that C stocks were under the reference control mark in most of the studied time period, especially in terms of ratio and delta: they tended to rise in the first 3 years (not significant), then show a decrease compared to the control at 8, 12 and 18 years after scarification (significant in CD ratio and C delta). Also, these results showed that FUR and RID stocks are respectively significantly lower and higher than the control. Test results are contrasting for the two other microsites, as standard C stocks and ratios in BST indicate a slightly higher than control, while C deltas in BFP shows C stocks lower than control plots. When overall averages were compared, C stocks in scarified LW (49 Mg ha−1) were about 1.6 Mg lower than C stocks in the undisturbed (control) LW (50.62 Mg ha−1), and if this difference is not strictly significant, it is very close to (P = 0.057), while ratio and delta values are clearly so.
Table 4. Mean carbon density (CD) ratios and deltas by time from scarification and microsite type. Number in bold character indicates a significant (P < 0.05) one-tailed Student test on no departure from a reference value, which is: 1 for ratios, 0 for deltas, 50.62 for overall standard stocks and the latter weighted by the respective mean coverage proportions (respectively: 14.07, 19.03, 10.48 and 7.04).
Discussion
This study is one of the first to address the question of topsoil C stock changes in the context of the scarification of LW soils. This relatively recent afforestation opportunity is expected to become increasingly common, given the significant potential for C sequestration of these lands (Gaboury et al. Citation2009; Boucher et al. Citation2012; Ménard et al. Citation2023). The 18-year-long chronosequence that was used in this study is the oldest set of afforestation trials that are known from Quebec’s public forestland. They provided a unique opportunity to fill an important data gap regarding an important C reservoir.
The general picture of the C partitioning between microsites of the scarified areas confirms expectation, given that ridges, which is the microsite that is in fact a mounding of living and dead organic matter, exhibited the highest C density, while furrows, which was the microsite being created where the trencher removes organic matter, exhibited the lowest C density. At first glance, the two microsites that were not affected directly by the trenching blades (BFP and BST) appeared to be similar to the control plots. Yet, when looking at standardized C stocks from which time- and site-confounded variation had been removed, while also accounting for different microsite coverages, BST tended to be more stocked than BFP, given that the difference between these microsites was significant 12 years following scarification. Also, when comparing microsite-wise general C stocks expressed as standardized C stocks, CD ratio and C delta with reference C values, BST appeared significantly more stocked than the control, but BFP was lower.
The possible explanations for why seemingly similar microsites showed different C densities are intriguing. First, we assume that BST is likely supporting more living vegetation than BFP for two reasons: as there is no harvest prior to scarification in this afforestation trial, the trencher must pass where there is no major restriction from high vegetation (trees); and the trencher likely unavoidably kills some of the tall vegetation, which is forced over where BFP microsites are being formed. The result might be a more developed vegetation (including trees) in BST microsites, which is left untouched, resulting in higher C transfer to the forest floor DOM reservoir (leaf fall, etc.) than BFP, following scarification. Carbon levels in BST were slightly higher than control plots, as revealed by trends in all variables submitted to Student t-tests, and were significant for CD ratios and standardized C. This response in BST could also result from a growth stimulation of residual vegetation following scarification (Pothier Citation2000; Prévost and Dumais Citation2003). Data from another experiment in the same study sites indicated an absence of growth stimulation of advance regeneration following scarification (Hébert et al. Citation2024). This suggests that the remaining vegetation covering this microsite type, where trees are virtually absent, could be insufficient to drive significant growth enhancement at the stand-level. Collectively, these responses highlighted the importance of investigating for this possible growth stimulation.
Regardless of the cause, it seems clear that this higher BST stocks, when combined with a significant rise in FUR stocks from 8 to 18 years, is inconsistent with the strong and sustained decline in RID stocks that occurred throughout the observed recovery period. Those two opposite trends obviously explain why overall forest floor C stocks were not substantially changing over time. Nevertheless, this does not imply that scarification exerted no effect at all. Indeed, forest floor C stocks were broadly 2.2 Mg per hectare (1.6 Mg with the overall standard means method; 2.77 Mg with the mean delta method) lower than estimates from non-scarified sites 18 years following treatment.
There were two sources of uncertainty that must be emphasized regarding the C assessment made in this study. The first was the likely introduction, due to scarification, of mineral material in the RID from the FUR mineral material that was displaced and mounded along with organic material. It is doubtful that visually sorting of samples would have removed all of the mineral fraction from the complex mix of the RID matrix, and that these residual materials would not have been appropriately weighted along with the DOM fraction, thereby slightly overestimating the final C stock. The second source of uncertainty was the biomass fraction of C stocks in the ridges. Given that a predominant source of living material in the organic layers, i.e. ericaceous shrub root and lower stem parts, were inserted into rather loose material matrix in the ridges that did not offer much mechanical support, it is possible that the hammer core sampler tended to displace these roots and stems rather than cutting out and gathering sections from them. This would lead to BIOM underestimation and could explain why BIOM C density in RID (0.32 kg m−2) were surprisingly lower than in the FUR (0.40 kg m−2). The whole picture, though, is that these two contrasting uncertainties should tend to offset one another; if this were not the case, the imbalance would apply over only 14% of the field, which is the mean surface proportion occupied by ridges ().
Soil C-reduction that was encountered in this study, which represented about 4% after the first 18 years following scarification, was within the variation found in literature. For example, C loss due to scarification in coniferous stands that was reported in Maillard et al. (Citation2010) was as much as 54% of initial stocks after 20 years, while there was no noticeable change after 27 years as reported by Mjöfors et al. (Citation2017) or after 10 years as reported by Nordborg et al. (Citation2006). In comparison, if our approx. 2 Mg loss seems rather low, this could be explained by the natural disturbance history of LWs. These ecosystems were stocking only nearly 40% of their initial whole soil profile C stocks, prior to their transition from a closed-canopy black spruce stands to LWs (Ouimet et al. Citation2018), due to successive disturbances (Payette et al. Citation2000; Gagnon and Morin Citation2001). It is also possible that part of the C that was lost by scarification in the humus could have been transferred to another reservoir, in part, as this study did not include sampling in the underlying mineral layers. Here again, some contradictions appear in the literature. In some studies, noticeable losses in the humus could be offset by higher C densities in the mineral soil (Nordborg et al. Citation2006), but there was no noticeable change in others (Maillard et al. Citation2010).
The chronosequence that was used in this study was too short to represent a complete forest floor recovery timeline after scarification. While mostly shown by standard C density changes (), this study also offers some perspective for the years that follow. After 18 years, RID and FUR standard carbon densities were respectively 6.69 kg m-² and 2.85 kg m-², while BFP and BST values were the same, i.e. 5.08 kg m-². Assuming that RID and FUR should achieve, sooner or later, the levels of the BFP and BST reference values, it would mean that RID was about 1.6 kg m-² from this level after 18 years and, therefore, should have completely reached it after about 26 years. Indeed, a C density loss of 0.2 kg m-² year−1 was shown in this microsite over this study timeline. Simultaneously, the C-density departure of FUR from BFP-BST level diminished to 2.2 kg m-² 18 years after scarification. Owing to the pace at which FUR density increased from 8 to 18 years of recovery, i.e. 2.0 kg m-² over 10 years, it would take nearly 11 more years to reach the reference level if the process proceeded in a linear fashion. If this reasoning was appropriate, it would mean that the forest floor should have completely stabilized from the disturbance to its C stock due to scarification in nearly 30 years. As the differences with BFP-BST level in terms of stocks represented 4.6 Mg ha−1 in FUR and 2.2 Mg ha−1 in RID, respectively, 2.6 Mg ha−1 more C must be gained in FUR once the loss originating from RID is balanced. That suggests that once both microsite types are stabilized, the approx. 2 Mg C loss found in this study could be recovered, for the least.
In conclusion, with regards to overall C stock loss 18 years after scarification in LWs, it is important to take into account that this C debt of about two Mg per hectare in the forest floor, which created by the scarification treatment, must be rapidly offset by the C accretion rate of the planted trees. In fact, data from a previous study on afforested LWs (Boucher et al. Citation2012) indicate that according to the estimated annual C-stock increment rate achieved by the planted trees (results not shown), it would take only four years after planting seedlings for black spruce, or three years for seedlings of jack pine (Pinus banksiana Lamb.), to balance out this overall C stock loss due to scarification.
Acknowledgements
Authors warmly thank Olivier Fradette, Philippe Cournoyer Farley, Marco Fillion, Léna Levoy and Florence Bouchard-Jean for their help in the field and in the laboratory. We also thank Rock Ouimet and Michel Campagna for revising the manuscript. WF.J. Parsons corrected the English text.
Disclosure statement
No potential conflict of interest was reported by the author(s).
Additional information
Funding
References
- Boucher J-F, Bernier PY, Munson AD. 2001. Radiation and soil temperature interactions on the growth and physiology of eastern white pine (Pinus strobus L.) seedlings. Plant Soil. 236:165–174. doi:10.1023/A:1012763728049.
- Boucher JF, Tremblay P, Gaboury S, Villeneuve C. 2012. Can boreal afforestation help offset incompressible GHG emissions from Canadian industries? Process Saf Environ Prot. 90:459–466. doi:10.1016/j.psep.2012.10.011.
- Boucher J-F, Tremblay P, Lefebvre A, Fradette O, Bouchard S, Lord D. 2019. The carbon fraction in biomass and organic matter in boreal open woodlands of Eastern Canada. Écoscience. 26:309–314.
- Côté D, Girard F, Hébert F, Bouchard S, Gagnon R, Lord D. 2013. Is the closed-crown boreal forest resilient after successive stand disturbances? A quantitative demonstration from a case study. J Veg Sci. 24:664–674. doi:10.1111/j.1654-1103.2012.01488.x.
- Coursolle C, Giasson M-A, Margolis H, Bernier P. 2012. Moving towards carbon neutrality: CO2 exchange of a black spruce forest ecosystem during the first 10 years of recovery after harvest. Can J For Res. 42:1908–1918. doi:10.1139/x2012-133.
- Dufour B, Boucher J-F, Tremblay P, Mailly D, Lord D. 2016. Black-spruce–lichen woodlands growth and carbon drawdown potentials as revealed by mature stands. Boreal Environ Res. 21:71–86.
- Fradette O, Marty C, Tremblay P, Lord D, Boucher J-F. 2021. Allometric equations for estimating biomass and carbon stocks in afforested open woodlands with black spruce and jack pine, in the Eastern Canadian Boreal Forest. Forests. 12(1):59. doi:10.3390/f12010059.
- Gaboury S, Boucher J-F, Villeneuve C, Lord D, Gagnon R. 2009. Estimating the net carbon balance of boreal open woodland afforestation: A case-study in Québec’s closed-crown boreal forest. For Ecol Manag. 257:483–494. doi:10.1016/j.foreco.2008.09.037.
- Gagnon R, Morin H. 2001. Les forêts d'épinette noire du Québec: dynamique, perturbations et biodiversité. Nat Can. 125:26–35.
- Giasson M-A, Coursolle C, Margolis H. 2006. Ecosystem-level CO2 fluxes from a boreal cutover in eastern Canada before and after scarification. Agric ForMeteorol. 140:23–40.
- Girard F, Payette S, Gagnon R. 2008. Rapid expansion of lichen woodlands within the closed-crown boreal forest zone over the last 50 years caused by stand disturbances in eastern Canada. J Biogeogr. 35:529–537. doi:10.1111/j.1365-2699.2007.01816.x.
- Hansson LJ, Ring E, Franko MA, Gärdenäs AI. 2018. Soil temperature and water content dynamics after disc trenching a sub-xeric Scots pine clearcut in central Sweden. Geoderma. 327:85–96. doi:10.1016/j.geoderma.2018.04.023.
- Hébert F, Boucher J-F, Bernier PY, Lord D. 2006. Growth response and water relations of 3-year-old planted black spruce and jack pine seedlings in site prepared lichen woodlands. For Ecol Manag. 223:226–236. doi:10.1016/j.foreco.2005.11.005.
- Hébert F, Boucher J-F, Walsh D, Tremblay P, Cote D, Lord D. 2014. Black spruce growth and survival in boreal open woodlands 10 years following mechanical site preparation and planting. Forestry. 87:277–286. doi:10.1093/forestry/cpt052.
- Hébert F, Delisle I, Tremblay M, Tremblay P, Boucher J-F, Boucher Y, Lord D. 2024. Natural seeding as an alternative to planting in black spruce-lichen woodlands. For Ecol Manag. 552:121584.
- [IPCC] Intergovernmental panel on climate change. 2003. Good practice guidance for land Use, land-Use change and forestry (GPG-LULUCF): methodology report – November 1, 2003. IPCC National Greenhouse Gas Inventories Programme, Technical Support Unit. Institute for Global Environmental Strategies. Hayama, Japan.
- Jasinski JPP, Payette S. 2005. The creation of alternative stable states in the southern boreal forest, Québec, Canada. Ecol Monogr. 75:561–583. doi:10.1890/04-1621.
- Kristensen T, Ohlson M, Bolstad P, Nagy Z. 2015. Spatial variability of organic layer thickness and carbon stocks in mature boreal forest stands—implications and suggestions for sampling designs. Environ Monit Assess. 187:521. doi:10.1007/s10661-015-4741-x.
- Kurz WA, Dymond CC, White TM, Stinson G, Shaw CH, Rampley GJ, Smyth C, Simpson BN, Neilson ET, Trofymow JA, et al. 2009. CBM-CFS3: A model of carbon-dynamics in forestry and land-use change implementing IPCC standards. Ecol Modell. 220:480–504. doi:10.1016/j.ecolmodel.2008.10.018.
- Maillard É, Paré D, Munson AD. 2010. Soil carbon stocks and carbon stability in a twenty-year-old temperate plantation. Soil Sci Soc Am J. 74:1775–1785. doi:10.2136/sssaj2009.0273.
- Mäkipää R, Abramoff R, Adamczyk B, Baldy V, Biryol C, Bosela M, Casals P, Curiel Yuste J, Dondini M, Filipek S, et al. 2023. How does management affect soil C sequestration and greenhouse gas fluxes in boreal and temperate forests? – A review. For Ecol Manag. 529:120637. doi:10.1016/j.foreco.2022.120637.
- Mallik AU, Hu D. 1997. Soil respiration following site preparation treatments in boreal mixedwood forest. For Ecol Manag. 97:265–275. doi:10.1016/S0378-1127(97)00067-4.
- Ménard I, Thiffault E, Kurz WA, Boucher J-F. 2023. Carbon sequestration and emission mitigation potential of afforestation and reforestation of unproductive territories. New For. 54:1013–1035. doi:10.1007/s11056-022-09955-5.
- Mjöfors K, Strömgren M, Nohrstedt H-Ö, Johansson M-B, Gärdenäs AI. 2017. Indications that site preparation increases forest ecosystem carbon stocks in the long term. Scand J For Res. 32:717–725. doi:10.1080/02827581.2017.1293152.
- Nordborg F, Nilsson U, Gemmel P, Örlander G. 2006. Carbon and nitrogen stocks in soil, trees and field vegetation in conifer plantations 10 years after deep soil cultivation and patch scarification. Scand J For Res. 21:356–363. doi:10.1080/02827580600976615.
- Ouimet R, Boucher J-F, Tremblay P, Lord D, Lupwayi N. 2018. Comparing soil profiles of adjacent forest stands with contrasting tree densities: lichen woodlands vs. black spruce–feathermoss stands in the continuous boreal forest. Can J Soil Sci. 98:458–468. doi:10.1139/cjss-2018-0017.
- Ouimet R, Tremblay S, Périé C, Prégent G. 2007. Ecosystem carbon accumulation following fallow farmland afforestation with red pine in southern Quebec. Can J For Res. 37:1118–1133. doi:10.1139/X06-297.
- Payette S, Bhiry N, Delwaide A, Simard M. 2000. Origin of the lichen woodland at its southern range limit in eastern Canada: the catastrophic impact of insect defoliators and fire on the spruce–moss forest. Can J For Res. 30:288–305. doi:10.1139/x99-207.
- Piirainen S, Finér L, Starr M. 2015. Changes in forest floor and mineral soil carbon and nitrogen stocks in a boreal forest after clear-cutting and mechanical site preparation. Eur J Soil Sci. 66:735–743. doi:10.1111/ejss.12264.
- Pothier D. 2000. Ten-year results of strip clear-cutting in Quebec black spruce stands. Can J For Res. 30:59–66. doi:10.1139/x99-189.
- Prévost M, Dumais D. 2003. Croissance et statut nutritif de marcottes, de semis naturels et de plants d'épinette noire à la suite du scarifiage: résultats de 10 ans. Can J For Res. 33:2097–2107. doi:10.1139/x03-130.
- Smolander A, Heiskanen J. 2007. Soil N and C transformations in two forest clear-cuts during three years after mounding and inverting. Can J Soil Sci. 87:251–258. doi:10.4141/S06-028.
- Strömgren M, Mjöfors K. 2012. Soil-CO2 flux after patch scarification, harrowing and stump harvest in a hemi-boreal forest. Scand J For Res. 27:754–761. doi:10.1080/02827581.2012.723741.
- Sutton RF. 1993. Mounding site preparation: A review of European and North American experience. New For. 7:151–192. doi:10.1007/BF00034198.
- Thurner M, Beer C, Santoro M, Carvalhais N, Wutzler T, Schepaschenko D, Shvidenko A, Kompter E, Ahrens B, Levick SR, et al. 2014. Carbon stock and density of northern boreal and temperate forests. Glob Ecol Biogeogr. 23:297–310. doi:10.1111/geb.12125.
- Tremblay P, Boucher J-F, Tremblay M, Lord D. 2013. Afforestation of boreal open woodlands: early performance and ecophysiology of planted black spruce seedlings. Forests. 4:433–454. doi:10.3390/f4020433.
- Tremblay S, Ouimet R. 2013. White spruce plantations on abandoned agricultural land: Are they more effective as C sinks than natural succession? Forests. 4:1141–1157. doi:10.3390/f4041141.
- Tremblay S, Ouimet R, Houle D. 2002. Prediction of organic carbon content in upland forest soils of Quebec, Canada. Can J For Res. 32:903–914. doi:10.1139/x02-023.
- Tremblay S, Périé C, Ouimet R. 2006. Changes in organic carbon storage in a 50 year white spruce plantation chronosequence established on fallow land in Quebec. Can J For Res. 36:2713–2723. doi:10.1139/x06-076.
- Vesterdal L, Ritter E, Gundersen P. 2002. Change in soil organic carbon following afforestation of former arable land. For Ecol Manag. 169:137–147. doi:10.1016/S0378-1127(02)00304-3.