
 ?Mathematical formulae have been encoded as MathML and are displayed in this HTML version using MathJax in order to improve their display. Uncheck the box to turn MathJax off. This feature requires Javascript. Click on a formula to zoom.
ABSTRACT
Applications of nanomaterials in water and wastewater treatment and in environmental clean-up operations depend on the adsorption capacity of the materials for contaminants such as potentially toxic elements (PTEs). However, on their own nanoparticles can lose effectiveness as contaminant sorbents because of flocculation and aggregation. Embedding nanoparticles within a silica matrix offers one potential solution to the problem; hence, in this study, zinc oxide nanoparticles (ZnO-NP) were embedded in a mesoporous silica (MCM-41) matrix to create a composite material with potential for contaminants removal from water. The composite material (ZnO-mSiO2) and original ZnO-NP were characterised via UV-Vis, FTIR, XRD, TGA/DTA, BET, and SEM techniques, and were then evaluated for their capacities to remove cadmium (Cd), chromium (Cr) and lead (Pb) from water samples across varying conditions (pH, initial contaminant concentration, contact time and adsorbent mass: solution volume ratios). Langmuir and Freundlich adsorption isotherms were fit to the data to describe the adsorption observed. The ZnO-mSiO2 composite material proved highly effective at removing the PTEs (particularly Pb) across a wide range of conditions, with optimum removal rates achieved at pH 7 and above and 90 minutes contact time.
1. Introduction
Removal of potentially toxic elements (PTE) such as lead (Pb), cadmium (Cd), and chromium (Cr) from water is a major consideration in relation to domestic wastewater treatment, industrial waste streams, drinking water supplies and, in many cases around the world, management of rivers and groundwater. Fast, efficient and low-cost removal of PTEs therefore continues to be the focus of much research from the perspectives of human health [Citation1], engineering and waste management [Citation2,Citation3] and environmental protection [Citation4]. Removal via adsorption onto nano-scale metals and metal oxides is a particularly promising area of research because of the high adsorption efficiencies that may be achieved [Citation5,Citation6]. Zero valent iron (Fe), iron oxide, magnesium oxide (MgO) and zinc oxide (ZnO) nanomaterials are among those that have been proven successful at removing PTEs [Citation5–8], but it is known that untreated or on their own any type of nanoparticles can lose effectiveness as contaminant sorbents because of flocculation and aggregation processes during water treatment [Citation5,Citation9]. For this reason, research efforts have focused on stabilising metal nanoparticles with various stabilising agents, including extracts from coffee, green tea and cloves [Citation10], or by embedding within composite materials including organic substances such as chitosan [Citation11], polydopamine [Citation12], polyethylene glycol [Citation13], and inorganic substances such as silica [Citation14]. Mesoporous silica matrices such as MCM-41 and SBA-15 have received much attention because they provide effective supports for metal and metal oxide catalysts, both having periodically ordered structures consisting of two-dimensional arrays of mesopores in a hexagonal formation [Citation15]. Silica (SiO2) can also enhance the surface properties of, and adsorption by, nanoparticles [Citation16], increasing the benefit. The processes by which metal oxides remove inorganic pollutants from water may include physical or chemical adsorption [Citation17], oxidation/reduction and precipitation, or a combination of these [Citation18], the dominance of which can be influenced by physical characteristics of the sorbents. Characterising synthesised metal-silica composites can reveal their structure and so aid in elucidating the sorption and related processes involved in the removal of pollutants from water, hence in the present study ZnO nanoparticles embedded in mesoporous silica have been generated, characterised using a range of analytical techniques, and evaluated for their effectiveness at removing Pb, Cd and Cr from water samples under varying environmental conditions including ranges of pH, contact time, amount of adsorbent, and initial PTE concentration. For comparison, a commercial sample of ZnO nanoparticles has been also examined. Sorption isotherm models (Langmuir and Freundlich) have been utilised to describe and evaluate adsorption of the PTEs investigated.
2. Materials and methods
2.1. Materials
Reagents were used as purchased without further purification: from Sigma – Aldrich, UK, ZnO nanoparticles (ZnO-NP), tetraethyl orthosilicate (TEOS) 98%, and cetyl-trimethylammonium bromide (CTAB) 95%; from ACROS, UK, lead nitrate (Pb(NO3)2) and cadmium nitrate tetrahydrate (Cd(NO3)2·4 H2O); and from BDH, UK, chromium nitrate (Cr(NO3)3).
2.2. Synthesis of ZnO-mSiO2 nano-composite
The nano ZnO-silica composite (ZnO-mSiO2) was synthesised following an approach reported elsewhere [Citation19]. Briefly, 0.10 g of ZnO-NP dispersed in 60 mL of ethanol and 1.2 mL of ammonia solution (NH4OH; 28 wt%) were mixed and sonicated for 60 min. Then, 0.30 g CTAB was added to the mixture under constant stirring at 25°C, after which 0.43 ml TEOS was added dropwise while stirring. Stirring was then continued for 6 h at room temperature. The mixture was separated by centrifuging (4000 rpm) and washed with deionised water (~18.2 MΩ·cm) with a trace of HCl. The product was dried at 100°C for 12 h and calcinated at 500°C for 3 h.
2.3. Characterization of ZnO-mSiO2 nano-composite and ZnO-NP
The ZnO-mSiO2 nano-composite and ZnO-NP were characterised via UV-Vis spectrophotometry (UV-Cary 60, Agilent) on material dispersed in deionised water and glycerine and by Fourier-transform infrared spectrometry (Thermo iS10, Thermo Fisher Scientific, equipped with a DTGS detector with a spectral resolution of 4 cm−1). Powder X-ray diffraction (XRD) patterns were recorded employing a Bruker D8 Advance diffractometer with CuKα radiation at 40kv and 40 mA over the 2-theta (θ) angle range of 5–60°. For determining apparent surface areas, pore sizes and pore size distributions, nitrogen adsorption experiments were carried out on a Quantachrom Autosorb instrument with calculations then made using the BET model for the P/P0 relative nitrogen pressure <0.15 and the nonlinear density functional theory (NLDFT) model applied to the adsorption branch of the isotherms obtained. Thermogravimetric analysis (TGA) was conducted in flowing nitrogen using a Rheometric Scientific STA 1500 instrument; the sample weight change was measured as a function of temperature (ramped from 20°C to 800°C at 10°C/min). Field emission scanning electron microscopy (S-4500, HITACHI) was employed to examine the morphology of materials.
2.4. Metal adsorption studies
The capacity for the purchased ZnO-NP and the synthesised ZnO-mSiO2 nano-composite to adsorb, and thereby remove from solution, Pb(II), Cd(II) and Cr(III) ions was determined under varying conditions of pH, contact time, amount of adsorbent, and initial PTE concentration. The experiments were conducted in 50 ml centrifuge tubes with 25 ml total solution. The experiments examined initial PTE concentrations ranging 10–100 mg/L, adsorbent masses 10–80 mg, pH 3–9, and contact time 10–180 minutes. In all cases, test units were shaken at 100 rpm for the stipulated contact time after which they were centrifuged (5,000 rpm) for 10 minutes to separate solution from solids and the elemental analysis of the supernatant solution was carried out using inductively coupled plasma optical emission spectroscopy (VISTA-MPX, Agilent). Measured concentrations were used to calculate the percentage of a metal removed from solution (i.e. removal efficiency, %R, EquationEquation (1))(1)
(1) and the amount of a metal adsorbed by the tested materials (qe, EquationEquation (2)
(2)
(2) ).
Where C0 is initial (original) and Ce the final (equilibrium) concentration of the relevant metal (Cd, Cr or Pb; mg/L), respectively, m is the mass of adsorbent used (g) and V is the volume of solution (L).
Langmuir and Freundlich adsorption isotherms were fit to data obtained from batch tests using 50 mg adsorbent and metal concentrations spanning 0–10 mg/L. The linear forms of the isotherm equations are presented in EquationEquations (3)(3)
(3) and (Equation4
(4)
(4) ) (Langmuir and Freundlich, respectively).
Where KL and qm are the Langmuir constant and the associated maximum monolayer coverage capacity, respectively, KF is the Freundlich constant and 1/n is a dimensionless function of the Freundlich model linked to the strength of adsorption.
3. Results and discussion
3.1. Characterisation of optical, morphological and composition properties
3.1.1. UV-vis and Fourier transform infrared spectroscopy
The UV-vis spectra for ZnO-NP and composite ZnO-mSiO2 are shown in the supplementary information (Figure S1). The spectra show a broad absorption peak at ~ 330–370 nm, which is typical of ZnO-NP [Citation20].
The FTIR spectrum of Zn-NP presents largely featureless continuous absorbance between 4000 and 1000 cm−1 that would be expected for zinc oxide particles (supplementary information Figure S2). The mSiO2 infrared spectrum shows an intense peak at ~1100 cm−1 characteristic of Si-O stretching vibrations in silicates and mesoporous silica [Citation21]. In addition to the stretching vibrations of Si–O–Si bridges associated with peaks at ~1100 cm−1 in the spectra of ZnO-mSiO2, a broad band at ~3400 cm−1 due to the O-H stretching vibrations and a peak at ~1630 cm−1 due to the O-H bending vibrations have been attributed to OH-species and water molecules adsorbed on the surface of silica and ZnO of the composite material.
3.1.2. X-ray diffraction
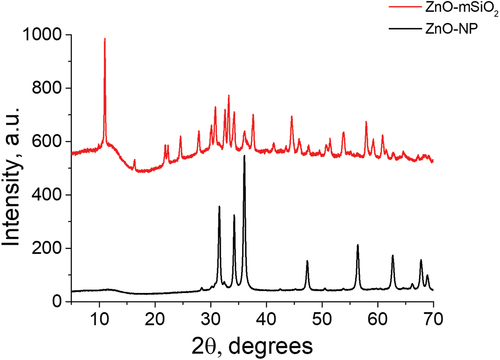
The major peaks in the XRD patterns () correspond to those expected for elemental zinc oxide and mSiO2. For the ZnO-NP, the five major peaks between 30° and 60° 2θ are indexed as (100), (002), (101), (102) and (110) planes of ZnO, wurtzite structure. The mean crystallite size, calculated from the broadening of XRD peaks using Scherrer equation, is 27.6 nm ( and S3). For ZnO-mSiO2, the pattern observed has been attributed to Zn5(OH)8Cl2·H2O, with the crystallite size of 27.4 nm, present as a single crystalline phase (which is supported on the amorphous mesoporous silica, according to our FTIR and nitrogen adsorption data) with no other crystalline phases detected ( and S4). Zn5(OH)8Cl2·H2O must have formed as a result of the reaction between ZnO and HCl followed by thermal treatment during preparation of the composite material. In agreement with our previous reports, the small-angle X-ray scattering pattern of mSiO2 shows an intense (100) peak corresponding to 3.5 nm d-spacing. This is consistent with the formation of a mesoporous material, which is characterised by long-range ordering, e.g. the hexagonal structure of MCM-41 [Citation22,Citation23]. It should be noted that SEM images do not appear to show any crystalline particles of ZnO, which could be explained by either a rather small size of zinc oxide nanoparticles, or by their successful encapsulation inside the mSiO2 matrix (see the supplementary information Figure S5).
Figure 1. XRD pattern for ZnO-NP (bottom) and ZnO-mSiO2 nano-composite (top).
3.1.3. Thermogravimetric analysis (TGA-DTA)
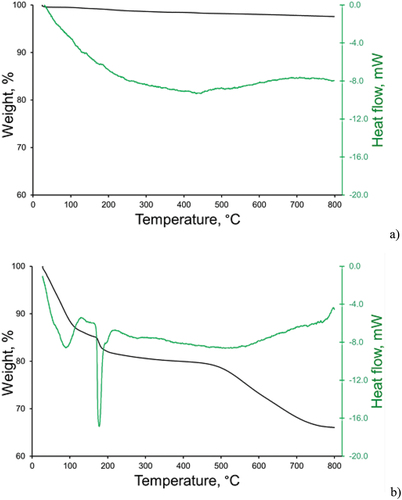
TGA-DTA curves for the ZnO-NP and ZnO-mSiO2 composite are presented in (Figure S6 provides information for mSiO2). The initial loss of mass from both materials below 150°C is indicative of the removal of water present as physisorbed H2O on ZnO, or as water adsorbed in the pores of mesostructured silicate and water of hydration in Zn5(OH)8Cl2·H2O for the ZnO-mSiO2 sample. For the ZnO-mSiO2 composite, the sharp endothermic peak at approximately 180°C likely resulted from the decomposition of Zn5(OH)8Cl2 into Zn(OH)Cl and ZnO, which is followed by the complete transformation of zinc hydroxy-chloride generating ZnO above 450°C [Citation24]. The decomposition of Zn(OH)Cl (or Zn(OH)2·ZnCl2) takes place at a higher temperature than expected from the literature data, probably due to the stabilising effect of the support. Our data indicate that ~ 8% weight loss results from the loss of water adsorbed in the pores of mesostructured silicate, and ~ 26% weight loss due to the decomposition of Zn5(OH)8Cl2·H2O.
Figure 2. TGA data for the ZnO-NP (a), and ZnO–mSiO2 (b) samples.
3.1.4. Nitrogen adsorption-desorption
The N2 sorption isotherm for mSiO2 (Figure S7) shows a significant nitrogen uptake at a low relative pressure (P/P0 <0.1), which is typical of highly porous mesostructured materials. This is followed by the second step in the N2 uptake with the relative pressure of ~ 0.3, which is due to the nitrogen multi-layer adsorption in the mesopores of the MCM-41 type material. The data analysis for mSiO2 shows a narrow pore size distribution peaking at 3.2 nm, with the pore volume of 0.640 cm3 g−1 and the surface area of 637 m2 g−1 (), which is typical of mesoporous silicas, e.g. MCM-41 and SBA-15 [Citation25]. The data analysis for ZnO-NP yields the pore volume of 0.071 cm3 g−1 and surface area of 54 m2 g−1, demonstrating a broad pore size distribution centred around 4.7 nm ( and Figure S7). The lower values for ZnO-NP may be attributable to nanoparticle agglomeration that led to a reduction in specific surface area and pore volume, as has been reported elsewhere [Citation26]. The ZnO-mSiO2 displays the pore volume of 0.154 cm3 g−1 and a surface area of 155 m2 g−1. The pore size distribution for this sample is also broad, with a maximum around 3.5 nm ( and ). The ZnO-mSiO2 thus has a notably greater surface area and porosity than ZnO-NP, however, it is still lower than that for the pure mesoporous silica, possibly owing to the constrained generation of the mesoporous structure in the obtained composite, or due to the presence of a significant amount of zinc oxide partially blocking the pores. Further research should be focused on the optimisation of the ZnO-mSiO2 synthesis.
Figure 3. Nitrogen adsorption-desorption isotherm for ZnO-mSiO2 and the pore size distribution (insert).
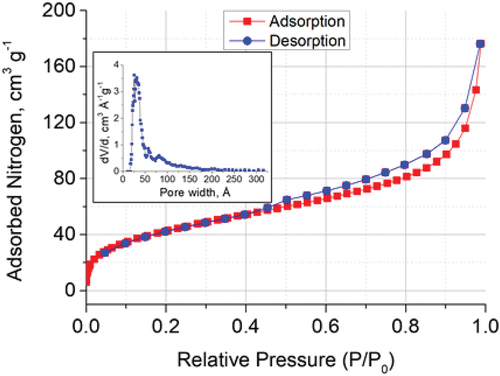
Table 1. The pore volume and surface area data obtained for mSiO2, Zn-NP and ZnO-mSiO2..
3.2. Lead, cadmium and chromium adsorption study
3.2.1. Effect of pH
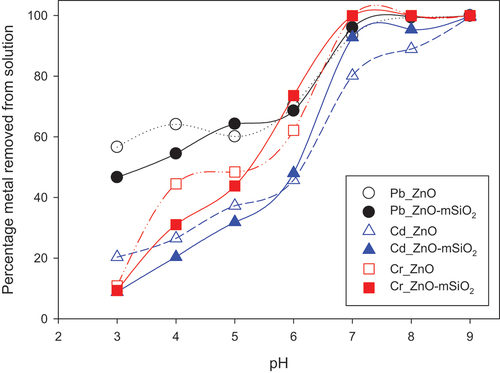
The effect of pH on sorption was clear for both ZnO-NP and ZnO-mSiO2, with effectively 100% of Cr and Pb removed from solution at pH 7 and above but only ~ 60% to 70% removed at pH 6 (). Adsorption of Cd and Cr by both materials decreased substantially as pH was lowered, with just 9–20% removed at pH 3. Across the pH range 3 to 5, both materials had a stronger affinity for Pb than for Cd or Cr. Adsorption of cationic metals at higher pH is a well-established phenomena, and largely attributable to greatly decreased competition from H+ in solution, nevertheless it was interesting that the composite material adsorbed a higher amount of Cd than did the ZnO at pH 7 and 8. This may be linked to deprotonation of surface silanol groups in the composite material as pH increases [Citation27], thereby creating additional binding points for cation adsorption. Adsorption of Cd and Pb by the mSiO2 alone is described in our previous work [Citation28].
Figure 4. Effect of pH on Pb (II), Cd (II) and Cr(III) adsorption (% removal from solution), with initial solution concentration 100 mg/L, 25 mg sorbent, 25 mL solution volume and 3 h equilibration time.
3.2.2. Effect of contact time
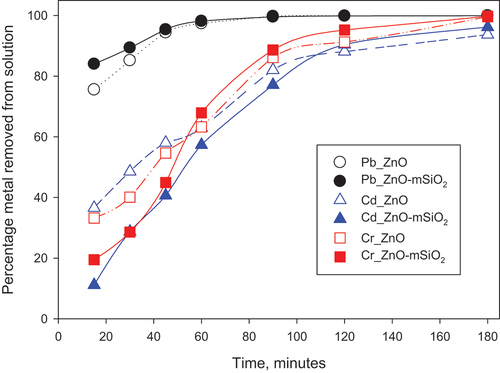
The contact time experiment (in which adsorbent mass was 0.025 g, solution volume 25 mL, and initial adsorbate concentrations 100 mg/L) revealed that adsorption of Pb from solution was ~ 80% or greater at every contact time tested (15–180 minutes) for both materials, with ~ 100% removal from solution at contact times of 60 minutes and beyond (). In contrast, Cd and Cr removal increased steadily from <40% at 15 minutes contact to >80% at 120 minutes, indicating a comparatively slower adsorption rate for these ions. Faster removal of Pb than Cd has also been reported for other adsorbents, such as natural zeolites used in the treatment of mine water [Citation29]. The data indicate that for both ZnO-NP and ZnO-mSiO2, for all metals tested, any additional contact time beyond 90 minutes would offer diminishing returns.
Figure 5. Effect of contact time on Pb (II), Cd (II) and Cr(III) removal percentage at pH 7, initial concentration 100 mg/l, 25 mg sorbent and 25 mL total volume.
3.2.3. Effect of adsorbent mass
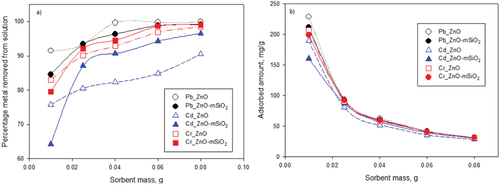
The effects of the adsorbent mass on the removal percentage and relative adsorbed amount (in solutions of 25 ml at pH 7 and with 180 minutes of contact time) are presented in . The data show that ZnO-NP removed ~ 100% of Pb at 40 mg and above, while ZnO-mSiO2 removed 96−100% of Pb across the same solid:solution ratios. The outcome for the two materials within this range was thus essentially the same, but any minute variation might be attributable to steric effects [Citation30] being more pronounced on the composite material. For Cr, both materials achieved very similar removal rates at the various mass doses tested and both achieved >95% removal at masses of 60 mg and above. The materials showed more divergent removals for Cd, with ZnO-mSiO2 achieving greater relative removal proportions across the 25–80 mg range. These effects were reflected in the relative adsorbed amounts achieved (qe; ), which showed similar patterns for both materials in relation to Pb and Cr but with slightly lower and more divergent values for Cd.
Figure 6. Effect of adsorbent dose on a) removal efficiency and b) amount sorbed (mg/g) of Pb (II), Cd (II) and Cr (III) with conditions set at pH 7, temperature 25°C, total volume 25 ml, and initial Pb, Cd and Cr concentration 100 mg/L.
3.2.4. Effect of initial ion concentration in solution
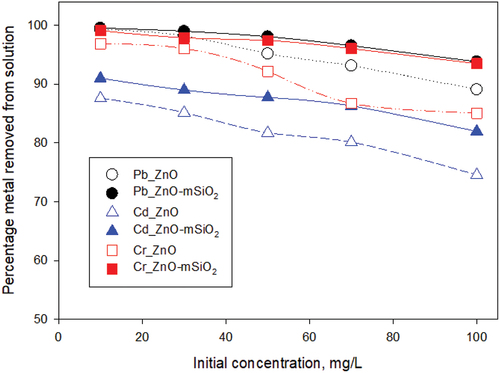
When the initial metal ion concentrations were varied 10–100 mg/L and other variables held constant, the synthesised ZnO-mSiO2 composite material achieved better ion removal than the commercially obtained ZnO-NP for all three elements across the entire concentration range (). For Cr and Pb, ZnO-mSiO2 adsorbed 94−100% of the ions present while for Cd it was >80%. The ZnO-NP removed substantial proportions of the metals, but the shortfall relative to that achieved by the ZnO-mSiO2 increased as the initial concentrations increased.
Figure 7. Effect of initial concentration of Pb (II), Cd (II) and Cr(III) on removal percentage by the adsorbents with conditions set at pH 7, temperature 25°C and sorbent dose 25 mg : 25 ml solution.
3.3. Sorption isotherm models
Langmuir and Freundlich adsorption models were fit to the data from the batch test in which initial concentrations of the PTEs were varied, with both models proving good fits to the data. The equations and constants for the isotherm models are presented in , while supplementary information Figures S8 and S9 present the isotherm plots. The Freundlich KF values were greater for ZnO-mSiO2 than for ZnO-NP in the case of all three PTEs investigated (Pb, Cd and Cr), indicating a greater potential adsorption capacity of the nanocomposite material compared with the ZnO-NP. The Langmuir parameter qm, which gives the theoretical maximum sorption capacity if adsorption is via monolayer coverage only [Citation31], was also greater for ZnO-mSiO2 than for ZnO-NP for each of Pb, Cd and Cr, further indicating an enhanced adsorption capacity of the ZnO-mSiO2. Interestingly, the order of maximum sorption capacity of ZnO-mSiO2 for the three different PTEs was Pb > Cr > Cd when considering the Freundlich KF values but was the reverse (Cd > Cr > Pb) when considering the Langmuir qm values (); when viewed in combination with the results shown above for the adsorption experiments (which tended to show stronger adsorption of Pb) this would suggest that multiple layer coverage of a heterogenous surface, as reflected by the Freundlich isotherm model, is likely to be a more accurate description of the adsorption processes involved on the ZnO-mSiO2 nanocomposite material. The present study employed linear forms of the adsorption isotherms to mathematically describe sorption and infer aspects of sorption processes; while these linear forms are widely used and can sometimes provide better fits than non-linear forms calculated with advanced computer techniques [Citation32,Citation33], it is also true that the non-linear forms can often provide better fits as well as additional information [Citation34] and so such non-linear forms should be incorporated in the future work.
Table 2. Freundlich and Langmuir linear isotherm model parameters and equations.
4. Conclusions
Zinc oxide nanoparticles were successfully encapsulated within a silica matrix to form ZnO-mSiO2. The nanocomposite material so generated effectively removed Pb, Cd and Cr from solution at pH 6 and above. The ZnO-mSiO2 had a greater affinity and greater efficiency at removing Pb than Cd and Cr, achieving high rates of Pb removal within 20 minutes of contact time (Cd and Cr removal at 80% and above was only achieved with 90 minutes of contact time or greater). The characterisation by FTIR, XRD, SEM and BET analysis enables greater understanding of the material generated and can be used in future work to optimise the ZnO-mSiO2 for pollutant removal.
Supplemental Material
Download PDF (1,019.3 KB)Acknowledgments
The authors thank the Ministry of Higher Education and Scientific Research, Iraq, for enabling Wahran Saod to undertake a research sabbatical in the UK. The authors thank Jenny Hillman and Simon Holborn (Keele University) for technical assistance and analytical support.
Disclosure statement
No potential conflict of interest was reported by the author(s).
Supplementary data
Supplemental data for this article can be accessed online at https://doi.org/10.1080/03067319.2023.2246016.
Additional information
Funding
References
- K. Zhang, S. Chang, Q. Zhang, Y. Bai, E. Wang, M. Zhang, Q. Fu, L. Wei and Y. Yu, J. Hazard. Mater. 450, 131003 (2023). doi:10.1016/j.jhazmat.2023.131003.
- V.N. Nagara, D. Sarkar, E.J. Elzinga and R. Datta, Environ. Technol. Innovat. 28, 102636 (2022). doi:10.1016/j.eti.2022.102636.
- L.E. Verduzco, J. Oliva, A.I. Oliva, E. Macias, C.R. Garcia, M. Herrera-Trejo, N. Pariona and A.I. Mtz-Enriquez, Mater. Chem. Phys. 229, 197–209 (2019). doi:10.1016/j.matchemphys.2019.03.006.
- I.R. Chowdhury, S. Chowdhury, M.A. Mazumder and A. Al-Ahmed, Appl. Water Sci. 12 (2022). doi:10.1007/s13201-022-01703-6
- R.A. Crane and T.B. Scott, J. Hazard. Mater. 211-212, 112 (2012). doi:10.1016/j.jhazmat.2011.11.073.
- S. Seif, S. Marofi and S. Mahdavi, Environ. Earth Sci. 78, 1 (2019). doi:10.1007/s12665-019-8380-3.
- M. Gu, L. Hao, Y. Wang, X. Li, Y. Chen, W. Li and L. Jiang, Chem. Phys. 534, 110750 (2020). doi:10.1016/j.chemphys.2020.110750.
- J.S.J. Bharti, S.S. Kumar, V. Kumar, A. Kumar and D. Kumar, Appl. Water Sci. 12 (2022). doi:10.1007/s13201-021-01566-3
- Y. Zhang, Y. Chen, P. Westerhoff, K. Hristovski and J.C. Crittenden, Water Res. 42, 2204 (2008). doi:10.1016/j.watres.2007.11.036.
- A. Mohamed, R.R. Atta, A.A. Kotp, F.I. Abo El-Ela, H. Abd El-Raheem, A. Farghali, D.H.M. Alkhalifah, W.N. Hozzein and R. Mahmoud, Sci. Rep. 13, 7227 (2023). doi:10.1038/s41598-023-31704-7.
- A.H.A. Saad, A.M. Azzam, S.T. El-Wakeel, B.B. Mostafa and M.B. Abd El-Latif, Environ. Nanotechnol. Monit. Manage. 9, 67 (2018). doi:10.1016/j.enmm.2017.12.004.
- T. Lei, S.-J. Li, F. Jiang, Z.-X. Ren, L.-L. Wang, X.-J. Yang, L.-H. Tang and S.-X. Wang, Nanoscale Res. Lett. 14, 352 (2019). doi:10.1186/s11671-019-3154-0.
- H. Wu, W. Wei, C. Xu, Y. Meng, W. Bai, W. Yang and A. Lin, Ecotox. Environ. Safe 188, 109902 (2020). doi:10.1016/j.ecoenv.2019.109902.
- D. Maučec, A. Šuligoj, A. Ristić, G. Dražić, A. Pintar and N.N. Tušar, Catal. Today 310, 32 (2018). doi:10.1016/j.cattod.2017.05.061.
- A.Y. Khodakov, V.L. Zholobenko, R. Bechara and D. Durand, Microporous Mesoporous Mater. 79, 29–39 (2005). doi:10.1016/j.micromeso.2004.10.013.
- M. Wawrzkiewicz, M. Wiśniewska, A. Wołowicz, V.M. Gun’ko and V.I. Zarko, Microporous Mesoporous Mater. 250, 128 (2017). doi:10.1016/j.micromeso.2017.05.016.
- O.D. Agboola and N.U. Benson, Front. Environ. Sci. 9, (2021). doi:10.3389/fenvs.2021.678574.
- A.T. Le, S.Y. Pung, S. Sreekantan, A. Matsuda and D.P. Huynh, Heliyon 5, e01440 (2019). doi:10.1016/j.heliyon.2019.e01440.
- I.M. El-Nahhal, J.K. Salem, S. Kuhn, T. Hammad, R. Hempelmann and S. Al Bhaisi, Powder Technol. 287, 439 (2016). doi:10.1016/j.powtec.2015.09.042.
- Z. Song, T.A. Kelf, W.H. Sanchez, M.S. Roberts, J. Ricka, M. Frenz and A.V. Zvyagin, Biomed. Opt. Express 2, 3321 (2011). doi:10.1364/BOE.2.003321.
- S.M. Holmes, V.L. Zholobenko, C.S. Cundy and J. Dwyer, J. Chem. Soc. Faraday Trans. 94, 2025 (1998). doi:10.1039/a801898g.
- V.L. Zholobenko, A.Y. Khodakov and D. Durand, Microporous Mesoporous Mater. 66, 297 (2003). doi:10.1016/j.micromeso.2003.09.023.
- A. Al-Ani, R. Darton, S. Sneddon and V. Zholobenko, ACS Appl. Nano Mater. 1, 310 (2018). doi:10.1021/acsanm.7b00169.
- A. Moezzi, M. Cortie and A. McDonagh, Dalton Transact. 45, 7385 (2016). doi:10.1039/C5DT04864H.
- M. Impéror-Clerc, I. Grillo, A.Y. Khodakov, D. Durand and V.L. Zholobenko, Chem. Commun. 834, 834–836 (2007). doi:10.1039/B611208K.
- R. Sivakami, S. Dhanuskodi and R. Karvembu, Spectrochim. Acta A 152, 43 (2016). doi:10.1016/j.saa.2015.07.008.
- B.M. Lowe, C.-K. Skylaris and N.G. Green, J. Colloid Interface Sci. 451, 231–244 (2015). doi:10.1016/j.jcis.2015.01.094.
- W.M. Saod, I.W. Oliver, D.F. Thompson, S. Holborn, A. Contini and V. Zholobenko, Environ. Nanotechnol. Monit. Manage. 20, 100817 (2023). doi:10.1016/j.enmm.2023.100817.
- U. Wingenfelder, C. Hansen, G. Furrer and R. Schulin, Environ. Sci. Technol. 39, 4606 (2005). doi:10.1021/es048482s.
- D. Wu, Ph. D. thesis, Catalysis. Université de Lille (tel-03553822), 2020. https://theses.hal.science/tel-03553822.
- D. Sparks, Environmental Soil Chemistry (Academic Press, San Diego, 2003). doi:10.1016/B978-012656446-4/50001-3.
- J. Lopez-Luna, L.E. Ramirez-Montes, S. Martinez-Vargas, A.I. Martinez, O.F. Mijangos-Ricardez, M.D.A. Gonzalez-Chavez, R. Carrillo-Gonzalez, F.A. Solis-Dominguez, M.D. Cuevas-Diaz and V. Vazquez-Hipolito, SN Appl. Sci. 1 (2019). doi:10.1007/s42452-019-0977-3
- A.R.P. Hidayat, D.O. Sulistiono, I.K. Murwani, B.F. Endrawati, H. Fansuri, L.L. Zulfa and R. Ediati, J. Environ. Chem. Engineer. 9, 106675 (2021). doi:10.1016/j.jece.2021.106675.
- K.C. Nebaghe, Y. El Boundati, K. Ziat, A. Naji, L. Rghioui and M. Saidi, Fluid Phase Equilib. 430, 188–194 (2016). doi:10.1016/j.fluid.2016.10.003.