
 ?Mathematical formulae have been encoded as MathML and are displayed in this HTML version using MathJax in order to improve their display. Uncheck the box to turn MathJax off. This feature requires Javascript. Click on a formula to zoom.
Abstract
Bread wheat is one of the key food grains in Ethiopia. However, its production and productivity are affected by stripe rust. The objective of this study was to investigate and develop integrated management options for stripe rust using varieties and fungicide application frequency in the study area. A field experiment was conducted at Enarj Enawuga district in the Metaya Kebele farmer training center during the 2022 main cropping season. There were sixteen total treatment combinations [four bread wheat varieties (Ogolcho, Lemu, Hidase, and Local as check), and four Tilt 250 EC fungicide application frequencies (nil, 1, 2, and 3 times)]. The design of the experiment was laid out in a randomized complete block design with factorial arrangements within three replications. Both disease and yield-related data were collected and analyzed using SAS 9.4 software. The disease and yield parameters showed a significant (p < 0.01) difference, and all treated plots had higher yield and lower disease severity than untreated plots. On the untreated plots, the final mean stripe rust severity was 18.53%, 22.57%, 36.73%, and 57.63% on Ogolcho, Lemu, Hidase, and local varieties, respectively. The maximum disease control was recorded from Ogolcho variety (61.31%) with a three-time application of Tilt 250EC. Grain yield and thousand kernel weight increment were obtained at 79.72% and 17.37% from Ogolcho, 100% and 23.44% from Lemu, 94.85% and 34.54% from Hidase, and 102.85% and 49.56% from local varieties treated by three times of Tilt 250EC, respectively. A higher yield reduction and AUDPC (114 DAS) were recorded from untreated plots of local (50.70%, 2,031.49% days−1), and Hidase (48.68%, 1,020.6% days−1) varieties, receptively. The 15-day interval application frequency of Propiconazole increased the grain yield of all tested varieties and reduced stripe rust severity. The Ogolcho variety treated three times yielded the maximum net benefit (216,750 Birr/ha) with an accepted marginal rate of return (22,810%). Therefore, based on the results obtained, producers use the Ogolcho variety with three-time application of propiconazole fungicide for optimum wheat production and could be recommended to manage stripe rust in the study area.
Introduction
Bread wheat (Triticum aestivum L.) is a key food for more than 35% of the world’s population, with an annual global production of 772.6 million tons (Omara et al. Citation2021). Africa accounts for 3.5% of the world’s wheat production, producing 27.1 million tons on 10.4 million hectares with an average yield of 2.6 t ha−1 (FAOSTAT Citation2018; FAO Citation2017). Ethiopia produced bread wheat on 1.7 million hectares and their production came in third (4.21 million tons) behind Egypt (9.27 million tons) and Morocco’s (5.11 million tons), but they ranked sixth in yield among African nations behind Zambia (0.3 million tons), Namibia (0.02 million tons), Egypt (8.5 million tons), Mali (1.4 million tons), and South Africa (1.8 million tons) (FAO Citation2019). The total production of bread wheat in Ethiopia is estimated at 5.8 million tons, with an average yield of 3 ton per ha, which is lower than the global average (CSA Citation2021).
Bread wheat production and productivity in Ethiopia are influenced by a complex combination of biotic and abiotic problems (Chen and Kang Citation2017; CSA Citation2021). Ethiopia’s limited access to modern varieties, outdated farming practices, cultivation of marginal lands, and the impact of terminal drought stress have collectively led to low bread wheat yields in the country (Semahegn et al. Citation2021). The most significant biotic variables that influence wheat production in Ethiopia are diseases like stripe rust (P. striiformis f. sp. tritici) and leaf rust (P. triticina), as well as insect pests like the Russian wheat aphid (Diuraphis noxia) (Gupta et al. 2017). Stripe rust can reduce both yield and quality of bread wheat leading to substantial economic losses in major wheat producing nations such as Ethiopia. In Ethiopia, stripe rust has a potential to cause up to 100% yield losses on highly susceptible cultivars during severe outbreaks (Degefie et al. Citation2020; Zheng et al. Citation2018; Allen-Sader et al. Citation2019). Large outbreaks of stripe rust occurred in Ethiopia in the 1970s, 1988, and 2010, which resulted in grain yield losses of 47.2%, 32%, and 28% in the worst-case scenarios in the north Shewa, East Gojjam, and South Gondar, respectively (Shiferaw et al. Citation2020), which are bordering Enarj Enawga district.
Bread wheat production and productivity in the study area are low because farmers use low-yielding, and susceptible local varieties and a single chemical control option (Haile et al. Citation2021). To judiciously manage the disease in the region, it is crucial to adopt and implement ecologically and biologically sound disease control strategies, while also utilizing fungicides responsibly. Farmers in Ethiopia employ different measures to minimize losses by stripe rust. These include cultural control, biological control, chemical control, use of resistant cultivars, and integrated disease management strategies (Chen and Kang Citation2017; Shiferaw et al. Citation2020). Due to the introduction of exotic races, aggressiveness, the evolution of new local races, and changes in environmental conditions, most varieties suffer from stripe rust quickly after their release, leading to a rising interest in chemical control of stripe rust (Omara et al. Citation2017). The use of resistant wheat cultivars coupled with the application of fungicides containing propiconazole 250 EC (Tilt), Tebuconazole 250 EC (Folicur), or Triadimefon 25 WP (Bayleton) has been reported to minimize losses by stripe rust on grain physical quality and flour yield (Buendía-Ayala et al. Citation2019; Mengesha Citation2020). Previous literature by Gupta et al. (Citation2017) suggests that a single application of fungicides and cultivars should be used to avoid overusing of fungicides. Nevertheless, growers asserted that fungicides applied once a year were insufficient to prevent the disease in their bread wheat crops and that the stripe rust was resistant to the fungicide. Thus, management strategies based on integrated disease management can improve stripe rust disease control while remaining environmentally safe. Therefore, this research was initiated with the objective of investigating and developing integrated stripe rust management option to increase bread wheat production and productivity.
Materials and methods
Description of study area
The field experiment was conducted at Metaya Kebele (lower administrative unit) administration’s Farmers Training Centre (FTC) under rain-fed conditions during the 2022 main cropping season. The experimental site is located at 10°41′764'’ N latitude and 38°15′860'’ E longitude, at an elevation of 2340 meters above the sea level. The location is representative of the Woyna Dega agro-climatic zone (mid-land) (EEDAO Citation2022 unpublished). The main rainfall season, which accounts for around 70–90% of the annual rainfall, occurs from June to September, while small rains also occur from December to March, and the annual temperature ranges from 12 to 21 degrees Celsius. Wheat (Triticum aestivum), maize (Zea mays), barley (Hordeum vulgare), faba bean (Vicia faba) and field pea (Pisum sativum) are the principal crops grown in the region; nevertheless, owing to various limitations, their productivity and production are inadequate. Wheat (Triticum aestivum) is the dominant crop produced next to tef in the Kebele administration (EEDAO Citation2022 unpublished). The site represents important wheat-growing and stripe-rust-prone regions within the highlands of the Amhara region in Ethiopia.
Experimental materials
A total of four wheat varieties namely: Ogolcho (resistant), Lemu (moderately resistant), Hidase (moderately susceptible) and a local variety (as a check) were used as varietal treatments. Seeds of each bread wheat variety except the local variety were obtained from the Adet Agricultural Research Center. Prior to planting, the germination percentage of each variety was assessed using the top-of-paper seed testing technique in sterile petri dishes. The Ogolcho variety had a germination percentage of 100%, Hidase variety had a germination percentage of 97% and Lemu variety had a 99% germination percentage. Propiconazole (Tilt 250EC) fungicide was used as fungicide frequency for disease control.
Treatments, experimental design, and management procedures
The experimental treatments consisted of sixteen combinations, comprising four wheat varieties (Ogolcho, Hidase, Lemu, and Local) and four frequencies (nil, 1, 2, and 3 times) of Tilt 250 EC fungicide. The experiment was set up with three replications using a randomized complete block design (RCBD) in factorial layout, and the treatments were assigned randomly on experimental plots within a block using the lottery method (). The design of the experiment was arranged appropriately, and the seedbed was prepared. Each experimental plot comprised seven rows. The spaces between blocks and plots were 1 m and 0.5 m, respectively. The area of each plot was 2.1 m2 with a width of 1.4 m and a length of 1.5 m. The net and gross areas for the experimental site were 100.8 m2 and 274.7 m2, respectively. The seeds of each variety were sown manually in rows at a depth of 2–3 cm, at a rate of 150 kg per hectare, in a well-prepared seedbed on July 2022, during the main growing season. Urea and NPSB fertilizers were applied at a rate of 261 and 100 kg ha−1 (½ at sowing and ½ at booting stage), respectively. The propiconazole fungicide was applied at a frequency of 0.5 L ha−1 of in 250 L ha−1 water. Tilt 250 EC fungicide was begun to be sprayed at the first occurrence of visible disease symptoms, and the spray was repeated every 15 days. During the fungicide application, each plot was protected with 2 m high polyethylene plastic sheets on all sides to reduce inter-plot interferences. A knapsack sprayer was used for applying fungicide manually. Weeds were manually removed and all other agronomic practices were uniformly applied to each plot at the recommended level.
Table 1. Combination of treatment used for field experiment at Enarj Enawuga district.
Data collected
Disease data
Disease incidence (%)
The incidence of stripe rust was evaluated based on the total number of plants in the plots and calculated using the formula established by Roelfs et al. (Citation1992).
Disease severity (%)
It was assessed visually from ten randomly selected and pre tagged plants in each plot, starting from the time of stripe rust symptom appearance up to physiological maturity of the crop at a 14-day interval. Following the onset of the initial symptoms, disease severity was recorded for each pre-tagged plant on the flag leaf and two succeeding leaves and compared using a diagrammatic Cobb scale (Peterson et al. Citation1948). The evaluation of the reaction of each bread wheat variety to stripe rust and disease severities was conducted according to the following scale: Trace (0%), 5%, 10%, 20%, 30%, 40%, 50%, 60%, 70%, 80%, 90%, 100% infection.
PSI stands for percent severity index.
Percent disease control (%)
The percentage of disease control was determined using the following formula (Roelfs et al. Citation1992):
PST stands for percent severity in the treated plot, PDC for percent disease control, and PSU for percent severity in the untreated plot.
Coefficient of infection (CI)
It was calculated by multiplying the final stripe rust severity data with a constant value of the variety’s resistance level for field response. The field constant values for resistance were R (resistant) = 0.2, moderate resistance (MR) = 0.4, intermediate resistance (MRMS) = 0.6, moderate susceptibility (MS) = 0.8, moderate susceptibility-susceptibility (MSS) = 0.9, and susceptibility (S) = 1 (Akhtar et al. Citation2002).
The Area under Disease Progress Curve/AUDPC (% days − 1)
It calculated from severity data in order to determine the development of disease on a whole plant or part of the plant for each treatment at different days after sowing (Wilcoxson et al. Citation1975).
Where ti is the time (days after planting) at the ith observation, n is the total number of observations, and Xi is the representation of the proportion of accumulated disease severity at the ith observation.
Disease progress rate
It was determined by repeated assessment of the percentage of leaf area affected by stripe rust disease in each plot starting from the onset of the disease. To determine the disease progress parameter from each treatment, a Gompertz model [-ln [-ln(Y)]] was used (Berger, Citation1981). Y is the average coefficient of infection shown over time in days. To calculate the rate, the altered data were regressed over time (DAS). The models’ goodness of fit was assessed based on each model’s residuals (SE) and size of the coefficient of determination (R2) (Campbell Citation1990). Next, the disease’s progression rate (r) and the curve’s intercept were found using a suitable model. To compare how the disease progressed under each treatment, these parameters were used in the analysis of variance. Due to the temporal progression of stripe rust, the Gompertz model had a lower coefficient of determination (R2) and a higher standard error (SE) compared to the logistic model. The summary of the temporal progression of stripe rust was more appropriate for the Gompertz model. Therefore, the rate of increase in stripe rust was estimated and compared using the Gompertz model.
Growth and yield parameters
Plant height (cm)
It was measured at the physiological maturity stage by selecting ten pre-tagged plants from the center rows of each plot. The height was measured from the surface of ground to the tip of the spike, excluding the awns. The average plant height was used for further analysis.
Spike length (cm)
It was measured by selecting ten pre-tagged plants from each plot and measuring the length of their spikes in centimeters. The average spike length was used for further analysis.
Number of grains per spike
Number of grains per spike of ten randomly selected and pre-tagged main tiller plants per plot was counted using a seed counter.
Thousand kernel weights (g)
One thousand seed weights were randomly selected from the total harvested grains after threshing from each experimental plot. The weight of the seeds was measured using a balance after adjusting the grain moisture content to 12.5% with a moisture tester.
Above ground dry biomass yield (t ha−1)
To determine the above-ground biomass yield, the total weight of sun-dried plant biomass (including straw and grain) was weighed in kilograms, which was then translated to tones per hectare.
Grain yield (t ha−1)
It was determined by measuring the weight of grains threshed from the net plot area of each plot after adjusting the grain moisture content to 12.5% and converted to tons per hectare.
Straw yield (t ha−1)
It was calculated by subtracting grain yield weight from total above ground biomass yield weight and converted to ton per hectare.
Harvesting index (%)
it was calculated as the percentage of grain production at a moisture content of 12.5% to the total above-ground biomass yield (Singh and Stoskopf Citation1971).
Relative yield loss (%)
The thousand kernel weight and relative yield losses were calculated separately for each treatment with varying levels of disease using the formula developed by Sharma et al. (Citation2016).
Where, RYL stands for relative loss (decrease of the parameters TSW and grain yield), Y1 for the mean of the relevant parameter on protected plots (plots with greatest protection), and Y2 for the mean of the relevant parameter in unprotected plots.
Relative yield increment (%)
For each bread wheat variety, the percentage increases in grain yield and thousand kernel weights were calculated relative to the protected plots of the same variety.
Where, RYI%=Percent yield increment (increment of the parameters grain yield and TSW), Y1 = mean of the respective parameter on protected plots (plots with maximum protection), and Y2 = mean of the respective parameter in unprotected plots (For example, unsprayed plots or sprayed plots with varied disease levels).
Data analysis
The data were analyzed using the general linear model (GLM) technique in SAS 9.4 (SAS Citation2023) and subjected to analysis of variance (ANOVA). When treatment differences were found to be significant, the means separation of significant treatments was compared using the Duncan Multiple Range Tests (DMRT) at a 1% or 5% level of significance (Gomez and Gomez Citation1984). A correlation and regression analysis were performed to study the nature and degree of relationship between disease parameters and yield parameters. Correlation coefficient values (r) were calculated, and the test of significance was analyzed using the Pearson correlation procedure found in SAS software. The economic data was analyzed using the partial budget analysis approach of CIMMYT (Citation1988) to determine the costs and incomes of each treatment that was employed in the experiment. The gross benefit was incurred as the product of the market price and grain yield of wheat, whereas the net benefit was the difference between the gross benefit and the total variable costs. To adjust for management differences, the yield and straw data collected at the time of harvest from each treatment were reduced by 10% to account for the variation between the experimental yield and the expected yield that farmers could have obtained from the same treatment. The marginal rate of return (MRR) was obtained by dividing the difference in net benefit (NB) by total input costs. The dominance analysis was used to identify treatments that were more expensive but gave a lesser net benefit than the next lowest-priced treatment. The total variable costs (TVC) for each treatment were calculated, and then the treatments were arranged in ascending order based on TVC. Subsequently, a dominance analysis was conducted.
Where, GB = gross benefit, AjY = adjusted yield, and AvY = average field yield obtained.
Results and discussions
Disease occurrence and incidence
The first stripe rust onset was observed early at the booting stage on local and Hidase varieties (58 DAS) and at the heading stage on Lemu and Ogolcho varieties (72 DAS) (). The analysis of variance showed that the main effect of varieties had a very highly significant (p < 0.01) effect at the first (58 DAS) and second (72 DAS) stripe rust incidence assessments. From first-time disease assessment, the highest mean disease incidence was recorded from local variety (3.38%), while a 0.00% mean incidence was recorded from Ogolcho and Lemu varieties (). The result, in lined with the study of Erdado Oullie (Citation2019), found that at first time assessments (78 DAP), the highest stripe rust incidence (53.56%) was recorded from the Hidase variety, whereas the minimum disease incidence (37.8%) was obtained from the Danda varieties. The result was strengthened by the work of Zenebe (Citation2022), who stated that at the first date of stem rust assessment, a higher incidence (15.5%) was recorded from local variety and no incidence was recorded on Ogolcho variety. According to Mengesha (Citation2020), the combined use of variety and fungicide (Tilt 250 EC) spray had a significant impact on the onset of stripe rust.
Table 2. Main effect of tested varieties on stripe rust incidence at 58 DAS and 72 DAS disease assessments.
The main effect of varieties and fungicide frequency shown a very high significance (p < 0.01) effect on the third (86 DAS), fourth (100 DAS), and fifth (114 DAS) days of disease incidence assessments. The maximum mean incidence (97.38%) was recorded from local variety on fifth-time stripe rust assessment (). As a function of fungicide application frequency, the highest incidence (83.57%) was recorded on an untreated plot (). This result, in agreement with Erdado Oullie (Citation2019), found that at final time assessments (99 DAP), 100% incidence was recorded from Hidase variety, 93.3% from Shorima variety, and 89.03% from Dandaa variety. An earlier study by Riazanova and Schwartau (Citation2015) reported the highest stripe rust incidence was recorded from unsprayed plots than treated plots. According to Zhou et al. (Citation2022), fungicides typically protect crops for 20 to 40 days, so two or more applications are sometimes required. The best method of disease prevention is the use of resistant varieties as found by Carmona et al. (Citation2020). The most effective method to minimize losses in wheat caused by yellow rust is to cultivate new varieties that are resistant to the disease as stated by Xu et al. (Citation2020).
Table 3. Main effect of fungicide frequency and cultivars on the occurrence of stripe rust on various assessment days.
Disease severity
The analysis of variance showed that the main effect of varieties had very highly significant (p < 0.01) effect on the first day’s (58 DAS) stripe rust severity assessment. The highest mean disease severity (5.21%) was recorded from local variety (). The current result was strengthened by the finding of Zenebe (Citation2022), who reported at the first day’s assessment of stem rust severity that there was no disease severity observed on Ogolcho variety, while the highest stem rust severity (2.2%) was recorded from local. Additionally, Sewenet et al. (Citation2021), which found that Ogolcho, Tay, and Abola had better resistance to yellow rust than Kingbird, Tsehay, and Kekeba varieties.
Table 4. Main effect of bread wheat varieties on stripe rust severity on 58 DAS assessments.
Stripe rust severity was significantly influenced (p < 0.01) by cultivars and fungicide frequency on 72-day disease evaluation. The severity ranged from 4.86% to 11.83% on Ogolcho and local varieties, respectively. The highest mean severity (8.58%) was found in an untreated plot, whereas the lowest severity (6.12%) was found in three times sprayed plots (). The result was supported by the study of Xu et al. (Citation2020), who stated that the impact of yellow rust on wheat is reduced by using resistant varieties. According to Zhou et al. (Citation2022), the foliar fungicide application increased the stripe rust resistance capacity of wheat varieties.
Table 5. Main effect of varieties and fungicide frequency on disease severity at 72 DAS assessments.
At the third and fourth-times disease severity assessment, the results of the analysis of variance indicated that there was a highly significant (p < 0.01) interaction between cultivars and fungicide frequency on stripe rust severity. From the first disease assessment up to the fifth assessment, the untreated plots of local variety showed faster stripe rust severity increments than other varieties (). The result indicated stripe rust severity was increased with an untreated plot compared to treated plots. The result in agreement with the finding of Carmona et al. (Citation2019), who reported that the creation of powerful fungicides is one of the key accomplishments in the fight against stripe rust. Sharma et al. (Citation2016) found that registered fungicides aid to stripe rust control.
Table 6. Combined effect of bread wheat varieties and frequency of fungicide on third, fourth- and fifth-time stripe rust severity assessments.
Final stripe rust severity
An analysis of variance revealed that the final stripe rust severity was significantly impacted (p < 0.01) by the interaction effect of variety and fungicide frequency. The maximum final severity (57.63%) was recorded from an untreated local variety, while a minimum final severity (7.17%) was obtained from Ogolcho with three times application of Tilt 250EC (). The result in line with the finding of Ayele et al. (Citation2019), who found that the highest terminal yellow rust severity (90%) was recorded on unsprayed plots of Kubsa variety. Similarly, Erdado Oullie (Citation2019) found that the maximum final stripe rust severity was obtained from untreated plots compared to treated plots.
Table 7. Interaction effect of bread wheat varieties and fungicide frequency on percent stripe rust control and final disease severity.
Percent disease control
A repeated application of fungicide had a positive effect on stripe rust severity reduction. The maximum percent disease control (61.31%) was recorded from Ogolcho variety, while a minimum percent disease control (44.00%) was obtained from local variety with three-time sprayed plots, respectively (). Three times sprayed plots (44.00% to 61.31%) followed by two times sprayed plots (20.06% to 37.02%) had maximum advantages for stripe rust control over untreated plots. The result in agreement with Vera Ardila (Citation2021) report that, “AC Barrie” variety showed stripe rust severity reduction by 26% after applying fungicide at mid-flower and by 58% after applying fungicide at stem elongation. A total of 60 million birr were spent for fungicide purchases to protect yellow rust (Abeyo et al. Citation2014).
Coefficient of infection
The statistical analysis of variance revealed that the integrated effect of varieties and fungicide application frequency had very highly significant (p < 0.01) difference on coefficient of infection. The tested varieties revealed that the maximum coefficient of infection was obtained from untreated plots than treated plots (). The result in lined with the study of Ayele et al. (Citation2019), who found that, untreated plots had a higher yellow rust coefficient of infection than treated plots.
Table 8. Combined effects of variety and fungicide frequency on coefficient of infection.
Area under disease progress curve
A highly significant interaction effect (p < 0.01) was observed between the frequency of fungicide application and variety on the area under the disease progress curve. In both tested varieties, the highest AUDPC was recorded from untreated plots compared to treated plots (). The current result, in line with the work of Erdado Oullie (Citation2019), found that the interaction of fungicide and variety had a significant effect on the AUDPC of stripe rust. Additionally, Ayele et al. (Citation2019) found that the maximum AUDPC (1783.3% days−1) was recorded from the untreated Kubsa variety compared to treated with Rex2 fungicide.
Table 9. Combined effects of variety and fungicide frequency on AUDPC.
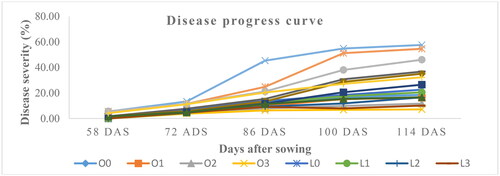
Disease progress curve
The disease progress curve exhibited linear progression at various growth stages of the tested varieties. After the onset of stripe rust up to crop maturity, stripe rust severity rapidly reached 57.63% and 36.73% on local and Hidase varieties, respectively, while Ogolcho (18.53%) and Lemu varieties (22.57%) showed the lowest disease severity (). The disease progress curve of the untreated plot was progressed at a faster rate than the treated plot. The result was in line with the work of Mengesha (Citation2020), who stated that yellow rust progress rate reduction was observed after application of different fungicides. Foliar fungicide treatment increased wheat variety rust resistance, and two or more applications are required to decrease disease rates and tackle re-infection as mentioned by Zhou et al. (Citation2022).
Figure 1. Bread wheat stripe rust disease progress curve at Enarj Enawuga district during 2022 main cropping season. Hint: O0: Ogolcho with nil application; O1: Ogolcho with once application; O2: Ogolcho with twice application; O3: Ogolcho with three times application; L0: Lemu with nil application; L2: Lemu with once application; L2: Lemu with twice; L3: Lemu with three times application; H0: Hidase with nil application; H1: Hidase with once application; H2: Hidase with twice application; H03= Hidase with three times application; A0: Locally adapted with nil application; A1: Local with once application; A2: Local with twice application; A3: Local with three times application of fungicide.
Disease progress rate
The analysis of variance indicated that the interaction impact of cultivars and fungicide frequency showed a highly significant (p < 0.01) influence on disease progress rate. The maximum progress rate (0.0318729 units days−1) was recorded from untreated local variety, whereas a minimum disease progress rate (0.00220245 units days−1) was obtained from Ogolcho variety with three times treated plots (). The maximum stripe rust progress rate was recorded from the untreated plots than treated plots. The result in agreement with the findings of Mengesha (Citation2020), who reported that untreated plots of all varieties showed the highest yellow rust progress rate; however, the maximum yellow rust progress rate was recorded from Kubsa (0.0470 units day−1) and Hidase varieties (0.0475 units day−1). Additionally, Ayele et al. (Citation2019) stated that a high infection rate of yellow rust (1.16 units days−1) was obtained on untreated plots of the Kubsa variety but that treated plots was units days−1 to 0.0 units days−1. Spraying of fungicide at the required interval is required because a single application of fungicide is not effective to control stripe rust for more than a week and re-infestation occurs either through old pustules or newly emerging spores, which leads to a slowly increasing disease progress rate as stated by Zhou et al. (Citation2022). Wind disperses the fungal spores that cause wheat rust, and they can remain infectious after travelling considerable distances as confirmed by Allen-Sader et al. (Citation2019).
Table 10. The interaction effect of varieties and fungicide frequency on disease progress rate.
Plant height
The analysis of variance indicated that the interaction of varieties and fungicide frequency had a significant (p < 0.05) effect on plant height. Local variety received with three times fungicide application had the tallest plant height (69.96 cm), while an untreated Hidase variety produced the shortest plant height (20.87 cm) (). The current result in agree with the study of Tesfaye et al. (Citation2018), who reported that there was a significant difference in plant height among varieties within treated and untreated plots. Similarly, Chen and Kang (Citation2017) stated that the use of fungicides is needed to reduce the effects of stripe rust. According to Khushboo et al. (Citation2021), stripe rust decreases plant vigor and causing poor root growth, leaf desiccation, and early maturity.
Table 11. Combined effects of varieties and fungicide frequency on plant height.
Spike length
The integrated effect of varieties and fungicide frequency showed a significant (p < 0.05) difference on spike length. The longest spike length (4.6 cm) was recorded from local variety treated with three times, while the shortest spike length (1.70 cm) was recorded from untreated Hidase variety (). The result was supported by the study of Ayele et al. (Citation2019), indicated that fungicide application reduced yellow rust spike infection. Similarly, Aktar-Uz-Zaman et al. (Citation2017) stated that using resistant cultivars for the control of stripe rust gave different response.
Table 12. Combined effects of variety and spray frequency of fungicide on spike length.
Number of grains per spike
The integrated effect of varieties and fungicide frequency showed a significant (p < 0.05) difference on number of grains per spike. The highest number of grains per spike (77.40) was obtained from Ogolcho variety with three times application of fungicide, while the lowest number of grains per spike (32.13) was recorded from untreated local variety (). The current result, in line with the study of Erdado Oullie (Citation2019), reported that on the management of stripe rust, the use of fungicide sprays and varieties had a significant effect on the number of kernels per spike in the Hadiya zone. The current result was strengthened by the study of Zenebe (Citation2022), who stated that on the managed of stem rust, Ogolcho variety treated with Tilt 250EC had the highest number of grains per spike (62.0), while untreated local variety had the lowest number of grains per spike (18.9).
Table 13. Combined effects of varieties and frequency of fungicide on number of grains per spike.
Thousand-kernel weight
Thousand kernel weight was significantly (p < 0.05) impacted by the combined effect of variety and fungicide frequency. The maximum TKW (48.65 g) was obtained from three times treated plots of Ogolcho variety, while the lowest TKW (23.87 g) was recorded from untreated local variety (). This result agreed with the study of Erdado Oullie (Citation2019), stated that a maximum TKW (13.8 g) was recorded from Danda variety treated with fungicide, while the lowest TKW (6.5 g) was recorded from untreated Hidase variety. Similarly, Vera Ardila (Citation2021) found that TKW increased to 38.2 g after the application of fungicide at midflower and to 35.6 g gained when the fungicide was applied at stem elongation. Additionally, Nabetani (Citation2020) reported that there was an interaction effect between cultivar and fungicide frequency on bread wheat TKW.
Table 14. Combined effects of bread wheat variety and spray frequency of on TKW.
Above ground biomass yield
Above-ground biomass output was significantly (p < 0.05) affected by the interaction of cultivars and fungicide frequency. The highest above-ground biomass yield (7.70 t ha−1) was obtained from Ogolcho variety, which received three times application of Tilt 250EC, whereas a minimum above-ground biomass yield (3.02 t ha−1) was recorded from untreated local variety (). The result, in line with the work of Alemu and Mideksa (Citation2015) stated that there was more variation in above ground biomass yield between tested and checked fungicide and the highest above ground yield (13.34 qt ha−1) was recorded from treated plots than untreated plots (9.74 qt ha−1). Additionally, Sebei et al. (Citation2018) reported that there was a significant difference in biomass yield between treated and untreated plots. Similarly, Sewenet et al. (Citation2021), who reported that Abola (11.38 t ha−1) and Ogolcho varieties (11.20 t ha−1) had a maximum above-ground biomass yield compared to Lemu (9.02 t ha−1) and Wane varieties (8.70 t ha−1), respectively.
Table 15. Combined effects of variety and frequency of fungicide on above ground biomass yield.
Grain yield
Based on the ANOVA results, the interaction between variety and frequency of Tilt 250EC had a remarkably significant impact (p < 0.01) on grain yield. The maximum grain yield (3.90 t ha−1) was gained from Ogolcho variety with three times sprayed plots, while the minimum grain yield was (1.05 t ha−1) received from an untreated local variety (). The result, in line with the study of Ayele et al. (Citation2019), who indicated that maximum grain yield (6085 kg ha−1) was recorded from Wane variety treated with Rex 2 fungicide, and lowest grain yield (273.3 kg ha−1) was recorded from an untreated plot of Kubsa variety. Additionally, Zenebe (Citation2022), who reported that maximum grain yield (3.2 t ha−1) was obtained from Ogolcho variety treated with Tilt 250EC, while minimum grain yield (2.53 t ha−1) was recorded from an untreated local variety. Like the current result, Vera Ardila (Citation2021) stated that the yield of the ‘AC Barrie’ cultivar was increased by 60% (2733 kg ha−1) and 32% (3595 kg ha−1) over the untreated plots, respectively. According to Wegulo et al. (Citation2012), the use of propiconazole (Tilt 250EC) fungicides to control foliar fungal disease resulted in a higher yield increment. Furthermore, Nabetani (Citation2020) reported that a dual application of fungicide provided the highest yield (2183 kg ha−1) for "AC Bellatrix," which was 124% higher than the unsprayed treatment (975 kg ha−1). A study conducted earlier by Krupinsky et al. (Citation2002) revealed that genotypes can be differentiated based on their reaction to disease, grain yield, environmental adaptability, and agronomic practices.
Table 16. Combined effects of bread wheat variety and spray frequency of fungicide on grain yield.
Straw yield
The interaction effect of variety and frequency of Tilt 250EC showed a significant difference (p < 0.05) on straw yield. The maximum straw yield (3.90 t ha−1) was recorded from Lemu variety (3.9 t ha−1), with three-times sprayed plots, while the minimum straw yield (1.88 t ha−1) was produced from an untreated local variety (). The finding was supported by a previous study conducted by Jørgensen and Olesen (Citation2002), which reported fungicide treatments significantly increased straw yield.
Table 17. Combined effects of bread wheat variety and spray frequency of fungicide on straw yield.
Harvesting index
The interaction of varieties and fungicide application frequency had a significant (p < 0.05) difference on the harvesting index. The maximum harvesting index (55.39%) was recorded from Ogolcho variety with two applications of Tilt 250EC, while the minimum harvesting index (35.14%) was recorded from untreated local variety (). The result, in agreement with the finding of Sewenet et al. (Citation2021), who found that the Abola variety had the highest harvesting index, while the Lemu variety had the lowest harvesting index. Similarly, Chimdesa and Tesfaye (Citation2017) reported that disease resistance and well-performing varieties produced the highest harvesting index.
Table 18. Combined effect of variety and spray frequency of fungicide on harvesting index.
Relative yield loss
The maximum grain yield loss (50.70%), and TKW loss (33.14%) were recorded from an untreated local variety, while a minimum grain yield loss (11.39) and TKW loss (8.56%) were recorded from Lemu variety received two times sprayed plots. After two applications of Tilt 250EC, maximum grain yield loss was saved by 23.77%, 12.21%, 11.39%, and 6.92% from Hidase, Local, Lemu, and Ogolcho varieties, respectively (). All treated plots had the lowest grain yield and TKW loss compared to untreated plots. Similarly, Alemu et al. (Citation2019), who stated that stripe rust disease affects grain production, quality, and size and in sensitive wheat cultivars leads 100% yield losses. Additionally, Jaleta et al. (Citation2019) indicated that stripe rust results in frequent crop failure and significant economic loss in Ethiopia. An earlier study by Wegulo et al. (Citation2009) showed that the application of fungicide to winter wheat production prevented a 42% yield loss from tan and spot blotch disease. On susceptible bread wheat cultivars across the world, stripe rust causing large and severe losses as reported by Chen (Citation2020). Foliar fungicide treatment increased the stripe rust resistance level of wheat varieties as mentioned by Zhou et al. (Citation2022). According to Carmona et al. (Citation2019), fungicide application is best when the existing variety is prone to rust and lacks resistance.
Table 19. Relative yield and thousand kernel weight loss at Enarj Enawuga district.
Relative yield increment
The results showed that there were grain yield increments as well as TKW in all tested varieties from nil to three times application of Tilt 250EC. Using a three-time application of Tilt 250EC with resistance varieties was useful for the management of stripe rust and saved grain yield loss by 1.08 t ha−1 on susceptible local variety, 1.29 t ha−1 from Hidase variety, 1.8 t ha−1 from Lemu variety and 1.22 t ha−1 from Ogolcho variety, respectively (). The result, in lined with the finding of Singh et al. (Citation2016), who indicated that treatments treated with Azoxystrobin 25SC fungicide showed a 77.33% and 44.14% increase in grain yield and TKW, respectively compared to untreated plots. Similarly, Sharma et al. (Citation2016), who reported that the application of different fungicides had a better advantage in the reduction of wheat yield loss over untreated plots and gave 39% yield increments compared to untreated plots. According to Mengesha (Citation2020), the combined use of variety and Tilt 250 EC fungicide spray had a significant impact on yield increments.
Table 20. Relative bread wheat varieties grain yield and thousand kernel weight increment.
Association between grain yield and yield components with stripe rust
To determine the relationship within and between stripe rust disease parameters (AUDPC, final disease severity, and coefficient of infection), and yield components (TKW, grain yield, and above-ground biomass yield) a linear correlation analysis was conducted. Yield components had a very high degree of positive correlation (p < 0.01). AUDPC, coefficient of infection, and final stripe rust severity had a very high degree of significant (p < 0.01) positive correlation (). The current result indicated that disease parameters had a very high to sufficiently high degree of negative correlation with yield and yield components but a positive correlation between them. The result, in line with the work of Abebele et al. (Citation2020), who found that there was a positive correlation within stripe rust parameters but a highly negative correlation between grain yield and disease parameters (final rust severity, coefficient of infection, and AUDPC). Similarly, Erdado Oullie (Citation2019), who reported that the yellow rust disease parameter had a highly significant negative correlation with yield components and yellow rust disease parameters showed a positive correlation within each other.
Table 21. Correlation on bread wheat yield and yield related components, and disease parameters at Enarj Enawuga district.
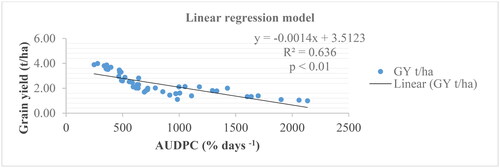
Linear regression of grain yield and AUDPC
To estimate grain yield loss a linear regression model was regressed by considering AUDPC data as independent variables and grain yield data as dependent variables. The regression analysis showed a very highly significant (p < 0.01) negative or inverse relationship between each other (). After linear regression analysis of grain yield and AUDPC, the model generated an equation, y = -0.0014x + 3.5123, and the graph indicated that in every increment of AUDPC (% days−1), the predicted loss of wheat grain yield decreased by 0.0014 t ha−1 at Enarj Enawuga district during the 2022 main cropping season. Linear regression models of grain yield with AUDPC predict or estimate that 63.6% of grain yield loss occurred due to stripe rust during the study season. The current result, in agreement with the study of Mengesha (Citation2020), stated that AUDPC value increments in each unit lead to 0.0226% grain yield loss due to yellow rust.
Figure 2. Linear relationship of bread wheat yield and AUDPC at Enarj Enawuga district.
Economic/partial budget analysis
The fungicide, which cost 1500 Birr per liter, was purchased from regional distribution centers. The cost of each variety seeds was 48 Birr kg−1 for Ogolcho, Lemu, and Hidase varieties and 40 Birr kg−1 for local varieties. The cost of daily Labour was 200 birr per day for spraying fungicide. During the harvest season, the local market prices for bread wheat grain yield and straw were 50-birr kg−1- and 15-birr kg−1, respectively. After the economic analysis the maximum net benefit (216,750 birr/ha) was recorded from the Ogolcho variety treated with three times treated plots. Ogolcho, Lemu, and Hidase varieties (151,050 birr/ha) with three times sprayed plots had 148,905 birr/ha, 136,755 birr/ha, and 83,205 birr/ha more net benefit advantages than untreated local variety (67,845 birr/ha), respectively (). The current result showed that with a production cost of 10,050 birr/ha, the Ogolcho variety with three-times application of Tilt 250EC had the maximum net benefit (216,750 birr/ha) than other treatments. After being sprayed once, twice, and three times with Tilt 250EC, the Ogolcho variety showed marginal rate of return of 29,335%, 35,410%, and 22,810% (). This indicated that a 15-gap application of Tilt 250EC fungicide had economic advantages and was best suited to combating stripe rust disease in Enarj Enawuga district during a severe epidemic year. The current result, in line with the earlier work of Wegulo et al. (Citation2012), who concluded that the use of propiconazole fungicides to control foliar fungal disease was effective in winter wheat and resulted in a higher yield increment and a maximum net return.
Table 22. Economic analysis (birr t/ha) of bread wheat stripe rust management at Enarj Enawuga district during 2022 main cropping season.
Table 23. Order of TVC and dominance analysis of bread wheat stripe rust management during 2022.
Conclusion
The field result indicated that stripe rust was one of the most severe and damaging fungal diseases in the study area, with different levels of infestation. On the tested variety, the stripe rust incidence, and severity level of stripe rust ranged from low to highly infested, while its intensity was affected by growth stage of the crop, used varieties, and management practices. As compared to those factors, maximum disease intensity was recorded from an untreated local susceptible variety, crops at heading stage. The study indicated that, stripe rust revealed a very high significant negative impact on yield and yield-related components among tested varieties. It reduced the kernel weight and grain yield of untreated plots on the experimental site inversely, increasing the severity of the disease. Depending on severity level, fungicide application frequency leads to varieties that react with stripe rust at susceptible, moderately susceptible, moderately resistant, and resistance levels. The variability of the tested varieties might be due to their genetic resistance level and the effectiveness of Tilt 250EC frequency for the control of stripe rust. However, starting from the occurrence of stripe rust, three applications followed by two applications of Tilt 250EC at a 15-day interval were the most important, and give the highest net benefit compared to untreated plots. The varieties Ogolcho and Lemu had the best performance and gave the maximum net benefit compared to others. However, the Ogolcho variety was best adapted and gave the most net benefit with the accepted MRR in the study area. Therefore, wise use of varieties and application frequency of Tilt 250EC is advisable and effective to control stripe rust in the study area. Fungicide application has harmful effects since one- to three-time spraying is not accepted or allowed when the disease pressure is low in grown varieties and when it does not occur during the growing season. When the disease became severe and the variety lost its resistance capacity through the growing period, a wise application of fungicide at the recommended rate, interval, and time was required and advisable. Before applying the fungicide, farmers should observe disease occurrence and quantify infestation levels. Farmers should be integrating a variety of practices to develop a long-term disease management strategy that is suitable for their production system and location. Therefore, based on the results obtained, producers use Ogolcho variety with three-time application of Tilt 250EC fungicide for optimum wheat production and could be recommended to manage stripe rust in the study area.
Author´s contributions
Adane Fentaye Belay (M.Sc.) prepared the manuscript, conceived, and designed the study, collected, and analyzed the data, and interpreted the results. Abaynew Jemal Jenber (Ph.D.) contributed to edited the manuscript. All authors reviewed the results and approved the final version of the manuscript.
Acknowledgements
The authors would like to thank the Adet Agriculture Research Centre for their support in providing bread wheat seeds. Additionally, the authors would like to express their gratitude to the Enarj Enawuga district agricultural office for providing the experimental field.
Disclosure statement
No potential conflict of interest was reported by the author(s).
Data availability statement
The corresponding author can supply the datasets produced and/or analyzed during the current work by reasonable request.
Additional information
Funding
References
- Abebele GM, Admasu MA, Agdu BH. 2020. Field evaluation of bread wheat (Triticum aestivum L.) genotypes for stripe rust (Puccinia striiformis W.) resistance in Arsi highlands of Oromia region, South-eastern-Ethiopia. J Plant Sci. 8(4):87–97. doi:10.11648/j.jps.20200804.13.
- Abeyo B, Hodson D, Hundie B, Woldeab G, Girma B, Badebo A, Denbel W. 2014. Cultivating success in Ethiopia: the contrasting stripe rust situations in 2010 and 2013. In: McIntosh R, Pretorius Z, editors. Abstr. BGRI 2014 Tech. Workshop. Ciudad Obregon, Mexico. Online publication. http://www.globalrust.org/sites/default/files/2014%20BGRI%20Plenary% 20Abstracts-ALL.pdf
- Akhtar MA, Ahmad I, Mirza JI, Rattu AR, E-Ul-Haque, Hakro AA, Jaffery AH. 2002. Evaluation of candidate lines against stripe and leaf rusts under national uniform wheat and barley yield trial 2000-2001. Asian J Plant Sci. 1(4):450–453. doi:10.3923/ajps.2002.450.453.
- Aktar-Uz-Zaman M, Tuhina-Khatun M, Hanafi M, Sahebi M. 2017. Genetic analysis of rust resistancegenes in global wheat cultivars: an Overview. Biotechnol Biotechnol Equip. 31(3):431–445. doi:10.1080/13102818.2017.1304180.
- Alemu SK, Badebo A, Tesfaye K, Uauy C. 2019. Identification of stripe rust resistance in Ethiopian durum wheat by phenotypic screening and competitive allele specific PCR (KASP) SNP markers. Plant Pathol Microbiol. 10:483. doi:10.35248/2157-7471.19.10.483.
- Alemu W, Mideksa T. 2015. Verification and evaluation of fungicides efficacy against wheat rust diseases on bread wheat (Triticum aestivum L.) in the highlands of Bale, South-eastern Ethiopia. Inter J Res Stud Agric Sci. 2(9):35-40. doi:10.20431/2454-6224.0209005.
- Allen-Sader C, Thurston W, Meyer M, Nure E, Bacha N, Alemayehu Y, Stutt R, Safka D, Craig A, Derso E, et al. 2019. An early warning system to predict and mitigate wheat rust diseases in Ethiopia. Environ Res Lett. 14(11):115004. doi:10.1088/1748-9326/ab4034.
- Ayele A, Chala A, Shikur E. 2019. Effect of varieties, fungicides, and application frequencies to wheat yellow rust disease (Puccinia striiformis f. sp. tritici) management in Arsi highlands of Ethiopia. AJBIO. 7(6):113–122. doi:10.11648/j.ajbio.20190706.15.
- Berger R. 1981. Comparison of the gompertz and logistic equations to describe plant disease progress. Phytopathology. 71(7):716–719. doi:10.1094/Phyto-71-716.
- Buendía-Ayala BL, Martínez-Cruz E, Villaseñor HE, Hortelano Santa Rosa R, Espitia-Rangel E, Buendía-González MO. 2019. The incidence of yellow rust and the industrial quality of the grain and the dough in bread wheat. Remexca. 10(1):143–154. doi:10.29312/remexca.v10i1.1333.
- Campbell CL. 1990. Temporal analysis of epidemics. I: description and comparison of diseases progress curves. Introduct Plant Dis Epidemiol.
- Carmona MA, Sautua FJ, Pérez-Hernández O, Grosso C, Vettorello L, Milanesio B, Corvi E, Almada G, Hovmøller MS. 2019. Rapid emergency response to yellow rust epidemics caused by newly introduced lineages of Puccinia striiformis f. sp. tritici in Argentina. Trop Plant Pathol. 44(4):385–391. doi:10.1007/s40858-019-00295-y.
- Carmona M, Sautua F, Pérez-Hérnandez O, Reis E. 2020. Role of fungicide applications on the integrated management of wheat stripe rust. Front Plant Sci. 11(19):733. doi:10.3389/fpls.2020.00733.
- Chen X. 2020. Pathogens which threaten food security: puccinia striiformis, the wheat stripe rust pathogen. Food Sec. 12(2):239–251. doi:10.1007/s12571-020-01016-z.
- Chen X, Kang Z. 2017. Stripe rust research and control: conclusions and perspectives. In: Stripe rust, p. 601–630. Dordrecht: Springer. doi:10.1007/978-94-024-1111-9_7.
- Chimdesa O, Tesfaye Y. 2017. Participatory variety selection of improved bread wheat varieties for High Land Guji Zone, Southern Ethiopia. J Biol Agric Healthcare. 7(7):11–14.
- [CIMMYT] International Maize and Wheat Improvement Center. 1998. From agronomic data to farmer recommendations: an economic workbook. Mexico: CIMMYT.
- [CSA] Central Statistical Agency. 2021. Agricultural Sample Survey Report on Area and Production of Major Crops (Private peasant holdings, Meher Season). Vol. 1, Statistical Bulletins 590, Addis Ababa, Ethiopia.
- Degefie T, Almaz N, Olika D, Abu T. 2020. Spatiotemporal hotspot patterns of wheat rust inciden-ce and severity in Ethiopia. Afr J Agric Res. 16(9):1289–1297. doi:10.5897/AJAR2020.14832.
- [EEDAO] Enarj Enawuga District Agricultural Office. 2022. Enarj Enawuga District Agricultural Off-ice Annual Report, 2022. (unpublished).
- Erdado Oullie F. 2019. Integrated management of stripe rust (Puccinia striiformis f. sp. tritici) of bread wheat (Triticum aestivum L.) Through host resistance and fungicide spray schedules in Hadiya Zone, SNNPR, Ethiopia. [Doctoral Dissertation]. Haramaya University. http://localhost:8080/xmlui/handle/123456789/691.
- [FAO] Food and Agriculture Organization. 2017. FAOSTAT on crop. Rome: FAO.
- [FAO] Food and Agriculture Organization. 2019. FAOSTAT on crops and livestock products. Rome: FAO.
- [FAOSTAT] Food and Agricultural Organization of the United Nations Statistics. 2018. Food balance sheets. Rome: FAOSTAT.
- Gomez KA, Gomez AA. 1984. Statistical procedures for agricultural research. New York: Wiley.
- Gupta N, Batra N, Bhardwaj SC. 2017. Wheat rust research–Status, efforts, and way ahead. J Wheat Res. 9(2):72–86.
- Haile A, Siyum N, Assefa M, Bahta M. 2021. Pre-extension demonstration of improved bread wheat varieties with their production packages in high land area of Eastern Amhara Region, Ethiopia. Agro Bali Agric J. 4(2):145–158. doi:10.37637/ab.v4i2.702.
- Jaleta M, Abeyo B, Yirga C, Hodson D, Erenstein O. 2019. Small holders coping mechanisms with wheat rust epidemics: lessons from Ethiopia. PLoS One. 14(7):e0219327. doi:10.1371/journal.pone.0219327.
- Jørgensen L, Olesen J. 2002. Fungicide treatments affect yield and moisture content of grain and straw in winter wheat. Crop Prot. 21(10):1023–1032. doi:10.1016/S0261-2194(02)00086-8.
- Khushboo S, Gupta V, Pandit D, Abrol S, Choskit D, Farooq S, Hussain R. 2021. Epidemiology of stripe rust of wheat: A Review. Int J Curr Microbiol App Sci. 10(01):1158–1172. doi:10.20546/ijcmas.2021.1001.140.
- Krupinsky J, Bailey K, McMullen M, Gossen B, Turkington T. 2002. Managing plant disease risk in diversified cropping systems. Agron J. 94(2):198–209. doi:10.2134/agronj2002.1980.
- Mengesha GG. 2020. Management of yellow rust (Puccinia striiformis f. sp. tritici) and stem rust (Puccinia graminis f. sp tritici) of bread wheat through host resistance and fungicide application in Southern Ethiopia. Cogent Food Agric. 6(1):1739493. doi:10.1080/23311932.2020.1739493.
- Nabetani K. 2020. Stripe rust management in spring and winter wheat by varietal resistance and fungicide application [Doctoral dissertation]. University of Saskatchewan.
- Omara R, Abd El-Malik N, Abu A. 2017. Inheritance of stem rust resistance at adult plant stage in some Egyptian wheat cultivars. EJPB. 21(2):261–275. doi:10.12816/0046426.
- Omara R, Nehela Y, Mabrouk O, Elsharkawy M. 2021. The emergence of new aggressive leaf rust races with the potential to supplant the resistance of wheat cultivars. Biology. 10(9):925. doi:10.3390/biology10090925.
- Peterson RF, Campbell AB, Hannah AE. 1948. A diagrammatic scale for estimating rust intensity on leaves and stems of cereals. Can J Res. 26(5):496–500. doi:10.1139/cjr48c-03.
- Riazanova M, Schwartau V. 2015. Effect of proquinazid and copper hydroxide on homeo stasis of an ions in winter wheat plants in generative phase of development. BioSystems Diversity, 23(1), 28–32. doi:10.15421/011505.
- Roelfs AP, Singh RP, Saari EE. 1992. Rust diseases of wheat: concepts & Methods of Disease Management. Mexico, D.F.: CIMMYT. PP 81.
- [SAS] Statistical Analysis System. 2023. Release version 9.4, SAS Inc.
- Sebei A, Ferjaoui S, Bchini H. 2018. Yellow rust affects grain yield and yield components of some spring bread wheat cultivars under rain fed conditions. World J Agric Res. 6(2):65–69. doi:10.12691/wjar-6-2-5.
- Semahegn Y, Shimelis H, Laing M, Mathew I. 2021. Farmers’ preferred traits and perceived production constraints of bread wheat under drought prone agroecologies of Ethiopia. Agric Food Secur. 10(1):18. doi:10.1186/s40066-021-00290-0.
- Sewenet HK, Anley AM, Getie MA. 2021. Performance evaluation and participatory varietal selection of improved bread wheat (Triticum aestivum L.) varieties, the case of Debre Elias District, Northwestern Ethiopia. Ecolog Genetics Genom. 19:100086. doi:10.1016/j.egg.2021.100086.
- Sharma RC, Nazari K, Amanov A, Ziyaev Z, Jalilov AU. 2016. Reduction of winter wheat yield losses caused by stripe rust through fungicide management. J Phytopathol. 164(9):671–677. doi:10.1111/jph.12490.
- Shiferaw W, Abinasa M, Tadesse W. 2020. Evaluation of bread wheat (Triticum aestivum L.) genotypes for stem and yellow rust resistance in Ethiopia. CBB. 8(2):43–51. doi:10.11648/j.cbb.20200802.13.
- Singh ID, Stoskopf NC. 1971. Harvest index in cereals 1. Agron J. 63(2):224–226. doi:10.2134/agronj1971.00021962006300020008x.
- Singh VK, Mathuria RC, Gogoi ROBN, Aggarwal RASHMI. 2016. Impact of different fungicides and bio agents and fungicidal spray timing on wheat stripe rust development and grain yield. Ind Phytopathol. 69(4):357–362.
- Tesfaye Y, Teshome G, Asefa K. 2018. Evaluation of fungicides efficacy against stripe rusts (Puc-cinia striiformis). At Guji Zone Southern Ethiopia. Inter J Res Agric Forestry. 5(10):6–113.
- Vera Ardila JT. 2021. Integrated Stripe Rust Management of Bread Wheat [Doctoral dissertation]. University of Saskatchewan.
- Wegulo S, Breathnach J, Baenziger P. 2009. Effect of growth stage on the relationship between tan spot and spot blotch severity and yield in winter wheat. Crop Prot. 28(8):696–702. doi:10.1016/j.cropro.2009.04.003.
- Wegulo S, Stevens J, Zwingman M, Baenziger PS. 2012. Yield response to foliar fungicide application in winter wheat. INTECH Open Access Publisher.
- Wilcoxson RD, Skovmand B, Atif AH. 1975. Evaluation of wheat cultivars for ability to retard development of stem rust. Ann Appl Biol. 80(3):275–281. doi:10.1111/j.1744-7348.1975.tb01633.x.
- Xu Q, Tang C, Wang L, Zhao C, Kang Z, Wang X. 2020. Haustoria–arsenals during the interaction between wheat and Puccinia striiformis f. sp. tritici. Mol Plant Pathol. 21(1):83–94. doi:10.1111/mpp.12882.
- Zenebe M. 2022. Assessment and Management of Wheat Stem Rust (Puccinia graminis tritici) Using Fungicides and Wheat Varieties in Meket District, North Wollo, Ethiopia [Doctoral dissertation].
- Zheng Q, Huang W, Cui X, Dong Y, Shi Y, Ma H, Liu L. 2018. Identification of wheat yellow rust using optimal three-band spectral indices in different growth stages. Sensors. 19(1):35. doi:10.3390/s19010035.
- Zhou X, Fang T, Li K, Huang K, Ma C, Zhang M, Li X, Yang S, Ren R, Zhang P. 2022. Yield losses associated with different levels of stripe rust resistance of commercial wheat cultivars in China. Phytopathology®. 112(6):1244–1254. doi:10.1094/PHYTO-07-21-0286-R.