
 ?Mathematical formulae have been encoded as MathML and are displayed in this HTML version using MathJax in order to improve their display. Uncheck the box to turn MathJax off. This feature requires Javascript. Click on a formula to zoom.
Abstract
There is a growing demand for detailed building façade models (Level-of-Detail 3: LoD 3) in a variety of applications. Despite the increasing number of papers addressing this issue in the literature, occlusions are still a significant problem when processing building façade elements. Conversely, depending on the view angle of the images, the detected elements might not be projected to their accurate locations causing uncertainties in their 3D locations. In this paper, we address the aforementioned issues utilizing multi-view images. Using a building footprint layer, we first locate the points belonging to buildings. We then detect the 2D windows and doors in images by combining Faster R-CNN and Segment Anything (SAM) deep learning models. The 2D borders are projected into the 3D object space using a pinhole camera model and collinearity equations. Utilizing the multi-view capabilities of mobile scanning systems, this method effectively mitigates uncertainties associated with occlusion and exterior orientation parameters (EOP). This study provides a comprehensive evaluation of 3D spatial accuracy, achieving an average of 84% Intersection over Union (IoU) accuracy for 12 different single-sided façades over 750 multi-view images for 312 windows and doors of various sizes with rectangular and curved shapes.
RÉSUMÉ
Il y a une demande croissante de modèles détaillés de façades de bâtiments (Niveau de détails 3: LoD 3) pour diverses applications. Malgré la croissance d‘articles traitant de ce problème dans la littérature, les occultations posent toujours un gros problème lorsqu’il s‘agit de traiter les éléments des façades des bâtiments. D'autre part, en fonction de l‘angle de vue des images, les éléments détectés peuvent ne pas être projetés à leurs emplacements précis, entraînant des incertitudes quant à leurs emplacements en 3D. Dans cet article, nous abordons les problèmes susmentionnés en utilisant des images multi-vues. En utilisant la couche d’empreinte au sol des bâtiments, nous localisons d‘abord les points appartenant aux bâtiments. Ensuite, nous détectons les fenêtres et les portes en 2D sur les images en combinant les modèles d‘apprentissage en profondeur Faster R-CNN et Segment Anything (SAM). Les bordures en 2D sont projetées dans l‘espace objet en 3D à l‘aide d‘un modèle de caméra sténopé et d‘équations de colinéarité. En utilisant les capacités multi-vues des systèmes de numérisation mobiles, cette méthode atténue efficacement les incertitudes liées aux occultations et aux paramètres d‘orientation extérieure (EOP). L'étude fournit une évaluation complète de la précision spatiale en 3D, atteignant une précision moyenne de 84% pour l‘intersection sur union (IoU) pour 12 façades unilatérales différentes sur 750 images multi-vues pour 312 fenêtres et portes de tailles diverses avec des formes rectangulaires et courbes.
Introduction
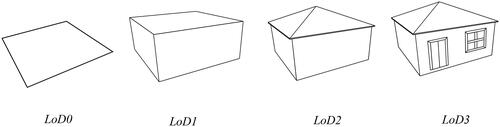
In recent years, 3D building façade models with high level of detail (LoD) e.g., LoD3 according to the cityGML standard (Gröger and Plümer Citation2012), have become increasingly important for a range of applications including urban planning, cultural heritage, building information modeling, disaster management, and computer graphics (Pu and Vosselman Citation2009; Malihi et al. Citation2018). To meet the increasing demand for higher LoDs in building models which is shown in , it is essential to consider not only the geometric details of buildings but also the specific features of their façades (Sun et al. Citation2022). Among these features, windows, and door elements need specific attention in the building façade, given their significant role in different applications such as energy loss or flood hazard modeling. With the availability of high-resolution remote sensing data and mobile scanning as well as AI algorithms, creating LoD3 building models is becoming more accessible than ever (Pu and Vosselman Citation2009; Malihi et al. Citation2018).
Figure 1. Four levels of detail (LoDs) represent building models. As the level of detail increases, the geometric detail and semantic complexity also increase.
The existing studies in the literature on these subjects can be divided into three categories: (1) 2D detection, (2) 3D detection, and (3) 2D detection and 3D projection.
In the (1) 2D detection category, the focus is on detecting the façade elements in 2D image space. The previous studies in these categories used façade parsing (Liu et al. Citation2020; Lu et al. Citation2023; S. Wang et al. Citation2022) and machine learning algorithms (Pu and Vosselman Citation2009; Teeravech et al. Citation2014; Wen et al. Citation2019). Neuhausen and König (Citation2018) detected 2D rectangular-shaped windows in the street view façade images using the Viola and Jones cascade classifier. The area of façade parsing underwent a substantial transition with the emergence of deep learning algorithms, marking a pivotal shift in this field. Liu et al. (Citation2020) applied Mask R-CNN and Fully Convolutional Neural (FCN) deep learning networks to locate windows and doors by their symmetry shapes using façade close-range images. In another study, Li et al. (Citation2020) detected 2D locations of windows from façade images as four corners using a Fully Convolutional Network (FCN) and heat map analysis.
Nordmark and Ayenew (Citation2021) proposed a method to segment windows’ 2D location from façade street view images using a Mask R-CNN deep neural network. Sun et al. (Citation2022) segmented windows from other façade elements in façade images using the Mask R-CNN deep network. Wang et al. (Citation2022) proposed a method for parsing façade images, which includes three parts: a CNN backbone, object detection, and segmentation parts. For the façade image, the segmentation decoding part outputs the pixel-level semantic class, while the object detection part outputs the generalized bounding boxes in the object level boxes in the object level. Liu et al. (Citation2022) generated the 3D façade model by incorporating both segmentation and detection results using symmetry information along with shape grammar concepts.
Zhang et al. (Citation2022) automatically detected façade elements using the pyramid scene parsing deep network by taking advantage of their symmetrical prior knowledge from façade images. Zhuo et al. (Citation2023) segmented façade images using an attention-U-ResNet deep learning model and injected the resulting segments in the SE-ResNet deep model to extract accurate window corners which resulted in the parsed façade model. A method developed by Lu et al. (Citation2023) for parsing building façades uses a revised SOLOv2 algorithm to accurately segment windows while ignoring occlusions. Ma et al. (Citation2022) proposed a deep learning network to parse the façade images by segmenting visible and invisible parts of the façade occluded by obstructions. Most studies in this category assume the image plane is parallel to the object (i.e., building front) plane (Ma et al. Citation2022; Zhang et al. Citation2022; Liu, Li, and Zhu Citation2022), which is not the case especially in mobile mapping systems.
In the (2) 3D detection category, some studies in the literature investigate façade parsing using point cloud data. These studies either perform façade semantic segmentation (W. Wang et al. Citation2021; Z. Li et al. Citation2017) and windows or doors detection from 3D point cloud data acquired from Structure from Motion (SfM) or LiDAR (W. Wang et al. Citation2021; Z. Li et al. Citation2017; Salehi and Mohammadzadeh Citation2017; Chen et al. Citation2019). Z. Li et al. (Citation2017) developed a hierarchical method of parsing urban building façades. As part of this process, Terrestrial Laser Scanning (TLS) point clouds were segmented to identify façade elements, and knowledge-based information was used to label the distinct elements, then boundaries between the segmented elements were extracted, and the building façade models were generated.
In Previtali, Díaz-Vilariño, and Scaioni (Citation2018), an optimization-based approach was proposed to model indoor scenes by detecting regular patterns with Indoor Mobile Mapping Systems (IMMS) point clouds. This method employed a voxel-based visibility analysis to identify openings in walls, such as windows and doors, as well as to distinguish between occluded and empty regions. Following the detection of wall elements, the regularized indoor models of the buildings were generated.
Jung et al. (Citation2018) developed 3D volumetric models of building interiors containing multiple rooms utilizing point clouds, aiming to enhance the level of detail in Building Information Models (BIM). In the first step of the proposed method, the ceiling and floor heights were estimated using histogram analysis of point clouds. After segmenting the point cloud into different rooms, the floor-wall boundaries were extracted from those segments. Following that, the volumetric wall components were represented with a cuboid shape, then windows and doors were detected and added to the wall components, and finally, the 3D volumetric model was generated. Zheng et al. (Citation2018) employed indoor laser scanning point clouds to identify windows and doors and subsequently subdivide the space. The proposed method initiates by extracting local geometric regularities from the point cloud scanlines to detect windows and doors within the point cloud. When windows and doors are detected, the scanner trajectory is partitioned into distinct spaces based on these detections. Finally, the labels for windows and doors, along with the results of space subdivision, are preserved as point cloud labels.
Lotte et al. (Citation2018) produced SfM point clouds from the façade images, and then segmented them by a CNN network into the different segments such as wall, window, roof, balcony, door, and shop. They labeled them by a ray tracing method which resulted in a 3D façade model. Malihi et al. (Citation2018) developed a method to use perceptual organization and density-based filtering algorithms to detect 3D locations of the windows in the SfM point cloud. Chen et al. (Citation2019) reconstructed a 3D façade model using Mobile Laser Scanning (MLS) point cloud by a histogram analysis, and a peak extraction method accordingly. Xia and Wang (Citation2019) separated facades from point clouds derived from ground-based LiDAR for urban planning. The proposed method involved extracting edges from the point cloud. Next, a window detection method was developed to extract windows from the point cloud. Then, windows and edge information were used to separate facade blocks into individual facade instances.
Pexman, Lichti, and Dawson (Citation2021) created 3D building models and 2D floor plans based on terrestrial laser scanner scans by delineating the story levels of historic buildings and detecting their windows and doors. The proposed method started by rotating the input point cloud around the Z axis, aligning it with the orthogonal X and Y axes. The M-estimator Sample Consensus (MSAC) was used to identify walls after separating building story levels from the rotated point cloud. By analyzing the histograms of two walls, it is possible to detect windows, doors, and points located between them. Lastly, the detected walls, doors, and windows are translated into a CAD model using their outlines. For 2D and 3D shapes, the minimum and maximum values of their X Y, or Z coordinates are stored. By doing so, simple planar features can be represented in a 2D or 3D CAD model. A method proposed by W. Wang et al. (Citation2021) exploits façade knowledge information with semantic segmentation. It utilizes a hierarchical mesh multi-view domain for semantic segmentation of the façade SfM point cloud. Wysocki, Hoegner, and Stilla (Citation2022) detected the 3D location of the buildings’ underpasses by comparing a co-registered Mobile Laser Scanning System (MLS) data with the existing semantic 3D building models in a Bayesian network. There are, however, still problems with deep learning algorithms in terms of localizing windows and doors using 3D point cloud data mainly due to the uncertainty of LiDAR around glass (Kamra et al. Citation2023).
(3) 2D detection and 3D projection: in these studies, the authors focused on 2D parsing or detecting and then they used camera location-orientation models to project the detected windows and doors to 3D object space. Salehi & Mohammadzadeh (Citation2017) fused the geometrical and spectral features coming from airborne LiDAR point cloud and optical images to generate a 3D building roof model including dormers and chimneys at LOD3. Wen et al. (Citation2019) developed an approach for extracting 2D lines from both image and point cloud data, subsequently establishing correspondences between these lines to generate a comprehensive 3D building model at LoD3. Pantoja-Rosero et al. (Citation2022) proposed an automated method that can detect the 2D location of windows and doors from multi-view façade images. The resulting 2D locations are then projected into 3D object space by assisting EOP parameters. The projected locations are then integrated into a LoD2 model produced through a polyfit process, resulting in the generation of the LoD3 model. The recent work by Cheng et al. (Citation2023) describes a method for projecting 2D opening boundaries onto 3D object space. It was accomplished by extracting these boundaries both from the projected indoor point cloud and from the RGB image. The difference in reflectivity of windows and doors was leveraged efficiently to accomplish this task.
Most of these studies did not consider the effect of occlusion, which can be a significant issue due to the existence of vegetation, cars, pedestrians, etc. in urban areas. The other effects that are not extensively addressed in the literature are the spatial uncertainty in the location of the projected façade elements in 3D due to EOP errors (Pantoja-Rosero et al. Citation2022; Wen et al. Citation2019; Cheng et al. Citation2023), oblique view angles, and consequently the misalignment between projected 2D and 3D features.
In this paper, we propose a new method for window and door detection (hereafter referred to as façade elements for brevity) in the 2D image space benefiting from state of art deep learning solutions and utilizing multi-view images to reduce spatial uncertainties. Using Faster-RCNN (Ren et al. Citation2015; Esri Citation2022) and Segment Anything (SAM) (Kirillov et al. Citation2023) deep learning models, we detect the façade elements in the image space (2D), and then project them into the 3D object space using a pinhole camera model and collinearity equations. We utilize the multi-view capabilities of the mobile scanning systems to reduce spatial uncertainties due to occlusion and EOP errors. To address the uncertainties, we propose an Inverse Distance Weighting (IDW) - inspired function to improve the 3D location of facade elements.
Data preparation
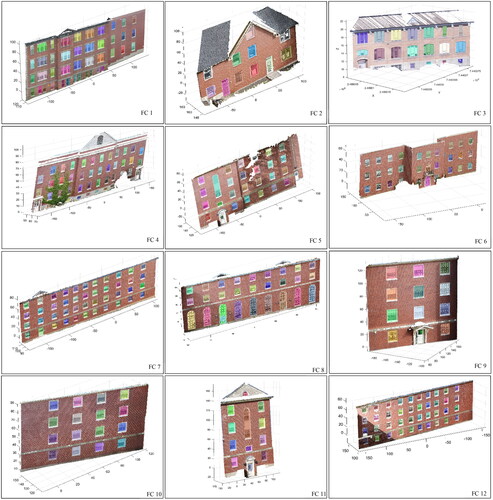
This study exploits data from two different sources. The first set of data comprises multi-view camera images obtained directly from single-sided building façades at the University of New Brunswick (UNB) campus in Fredericton, captured using a Digital single-lens reflex (DSLR) camera. The second dataset consists of street-view camera images and MLS point clouds acquired using the Leica MLS device. We applied our proposed method to analyze 750 multi-view images of 12 single-sided facades (FC 1 – FC 12), as illustrated in . Specifically, we focused on 312 facade elements of various sizes, including rectangular and curved shapes, from buildings in urban areas of Fredericton, NB (most of the buildings are of red brick type). As shown in , in some images, certain parts of the buildings, such as facade elements, were obstructed by trees, and other obstacles. To process the data, the multi-view DSLR camera images were utilized to create SfM point clouds using the Pix4D mapper software. Subsequently, building footprint polygons of Fredericton city from GeoNB's data catalog were employed to extract façade-specific point clouds. Both datasets encompassed information regarding EOP and internal orientation parameters (IOP) . EOP defines the position and orientation of the camera at the time an image is captured. It consists of 6 parameters: 3 projection center coordinates
and 3 rotations
around X, Y, and Z axes, respectively. Camera position is determined using a Global Positioning System (GPS), while rotations are measured using an Inertial Navigation System (INS) mounted on the measuring device. Moreover, IOP defines the camera calibration parameters, which include three parameters such as
as image principal point coordinates, and
as the camera focal length. contains the accuracy information of the EOPs for the two datasets while the specifications of the DSLR camera and the MLS device are provided in .
Figure 2. The windows are obstructed by trees and billboard.
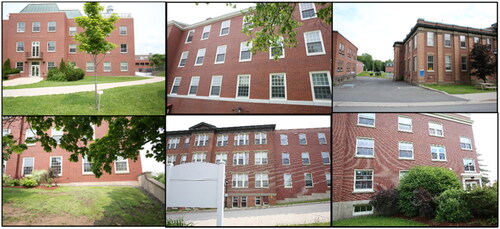
Figure 3. Dataset compilation from single-sided facades (FC 1- FC 12).
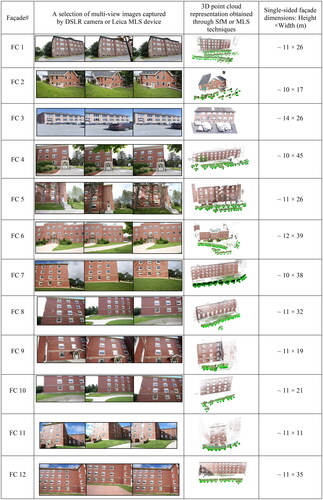
Table 1. EOPs accuracies for two datasets, coordinates in meters, and angles in degree unit.
Table 2. The specifications of data collection devices.
Methodology
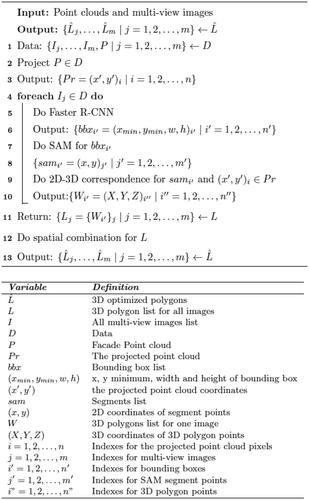
As illustrated in the flowchart in , we utilize Faster-RCNN and SAM deep learning models for detecting facade elements in multi-view images. These elements are then projected into the 3D object space. Subsequently, we integrate 3D polygon candidates representing facade elements. This integration aims to reduce spatial uncertainty and improve the 3D localization accuracy of these elements. To clarify the process, the pseudo-code of the work as depicted in , along with detailed explanations of each step, is provided as follows.
Figure 4. The overall flowchart of the proposed method.
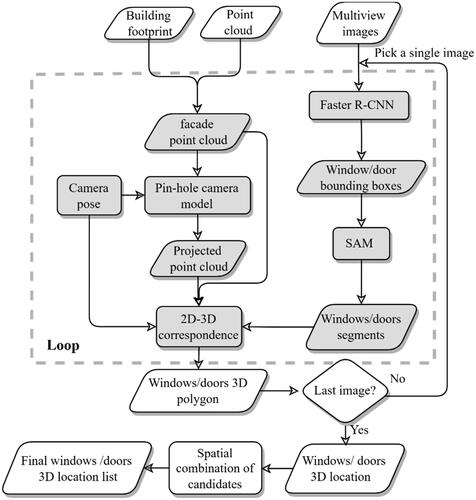
Figure 5. The pseudo-code of the proposed method.
Faster – R-CNN
Faster R-CNN is an object detection algorithm that integrates deep convolutional neural networks with region proposal networks. This integration allows for the effective and precise detection of objects in images (Ren et al. Citation2015). We used the Esri Faster R-CNN pre-trained windows and doors extraction model (Esri Citation2022; Kuznetsova et al. Citation2018). To detect windows and doors, multi-view façade images are inputted into the model, generating 2D bounding boxes for each facade element in every façade image in which
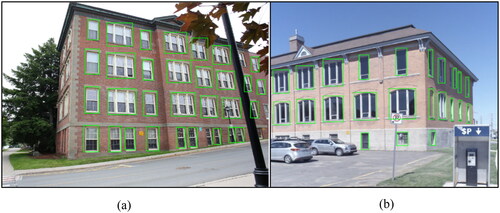
refer to 2D coordinates of the top-left corner, width, and height of a bounding box respectively. As we use multi-view images, i’ refers to each single image and n’ is total number of images in which a single window is detected. We detected bounding boxes (green) in two different single images as can be seen in
Figure 6. The overlaid bounding boxes (green) on single view façade images captured by DSLR cameras (a), and Leica MLS device (b).
Segment anything (SAM)
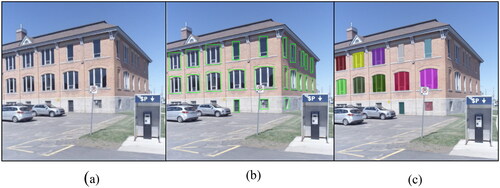
As shown in , the bounding boxes generated by Faster R-CNN fail to precisely represent the true boundaries of facade elements. To improve the boundary detection step, a segmentation algorithm like SAM is needed. SAM model has garnered significant attention in computer vision research (Zhang et al. Citation2023). Notably, SAM possesses the capability of zero-shot image segmentation, enabling its application in specialized scenarios like facade elements segmentation. SAM can segment a façade image into different segments including all façade structures. These segments can be selected only for façade elements by using SAM’s promptability feature. We provide the detected bounding boxes as approximate locations of facade elements as input prompts as can be seen in , which helps the SAM model to generate the segments corresponding to façade elements as depicted in (Kirillov et al. Citation2023; Y. Wang, Zhao, and Petzold Citation2023).
Figure 7. a) A single view façade image captured Fredericton residential area b) detected windows and doors bounding boxes by Faster-RCNN c) refined 2D SAM segments.
2D–3D correspondence
To find the 3D location of façade elements, we project the points of the façade point cloud into each individual image using a Pin-Hole camera model which can be seen in . Moreover, to determine the depth of the 2D border points of facade elements’ segments, there are two possible options. The first option involves identifying matched points on the borders of facade elements across various multi-view images of the façade, followed by triangulation. However, matching linear features from one image to another can be time-consuming, and prone to errors due to matching errors (Han et al. Citation2014; Moghimi et al. Citation2022; Collins, Mesejo, and Bartoli Citation2014). Moreover, the varying number of edge points for the same facade elements across different multi-view images of the façade further complicates the process. Alternatively, assuming façade elements lay on a single plane, we augmented the original system of collinearity equations in EquationEquation (1)(1)
(1) with an additional plane. This augmentation is crucial to establish determinacy and facilitate the solution for the depth.
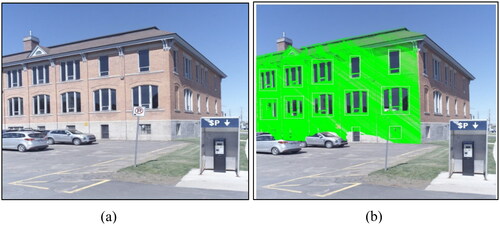
Figure 8. a) A single view façade image captured Fredericton residential area b) projected point cloud overlaid on the image.
The concept of collinearity consists of a straight line connecting the exposure station, the point of interest within the frame, and its corresponding image. As a result of this relationship, the object in the real world, its representation in the image, and the observer’s perspective are aligned (Wolf, Dewitt, and Wilkinson Citation2014). In the collinearity equations, (,
) are image coordinates,
are image principal point coordinates,
is the camera focal length,
are elements of rotation matrix (M) between object space and image space coordinate systems, (X, Y, Z) are ground coordinates in the object space, and
are camera perspective center coordinates in the object space.
(1)
(1)
The known parameters involved in this process include the elements of the rotation matrix (), camera perspective center coordinates
, image coordinates (x, y), image principal center coordinates (
), and camera focal length (f), all obtained from the camera pose file.
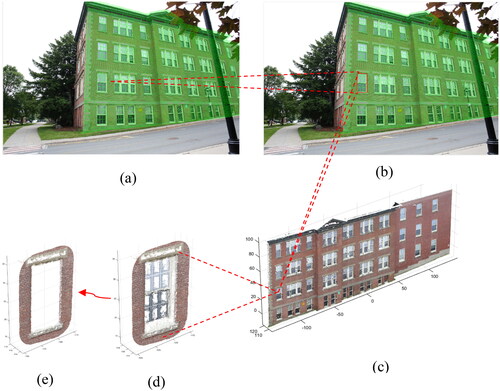
To determine the plane parameters for each facade element, we extract their corresponding 3D points from the point cloud as shown in by overlaying the points within their segment borders onto the projected point cloud as shown in . Moreover, a predefined buffer (100 pixels), determined by considering the approximate façade elements sizes and Ground Sampling Distance (GSD) of images is applied to the 2D borders’ points. This buffer is designed to encompass a broader range of 3D points from the surrounding façade walls. This step is crucial because the areas of facade elements often contain noisy points due to mirrors and curtains behind the window glass. Subsequently, the 3D points associated with facade elements are removed as seen in from the buffered 3D points. The remaining 3D points are then processed through the MSAC algorithm to identify the inlier points, which allows the extraction of the plane parameters (a, b, c, and d) (Torr and Zisserman Citation2000).
Figure 9. 2D-3D correspondence and buffering process. (a) projected point cloud on a single view façade image b) overlaid 2D border segment (red color) c) SfM point cloud d) buffered corresponding 3D point cloud, e) removed noisy window points.
After extracting the plane parameters and formulating the plane equation for each façade element, we then augment the respective collinearity equations as can be seen in EquationEquation (2)(2)
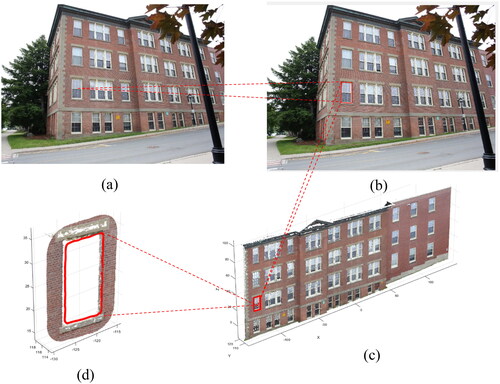
(2) , resulting in 3D location (X, Y, Z) depicted in for every 2D border’ points (x, y) shown in . This procedure is repeated for every border of the facade element in all multi-view images. When this process is completed, we have the 3D location estimates for façade elements.
(2)
(2)
Figure 10. The process to generate facade elements 3D locations. a) A single view façade image captured UNB campus b) overlaid a 2D polygon from SAM (red color) c) the projected 3D polygon overlaid on SfM point cloud d) zoomed in the projected 3D polygon.
Spatial combination of candidates
Following the generation of 3D polygons for each façade element in each image, overlapping polygons across the entire set of multi-view images need to be identified. In this study, we employed the IoU metric (Tripodi et al. Citation2020) iteratively to detect instances of overlapping polygons as can be seen in .
Figure 11. Three samples of overlapping 3D polygons (window border candidates) across three image views. a) Overlapping 3D polygons for a single window b) 2D polygons in different view angles.
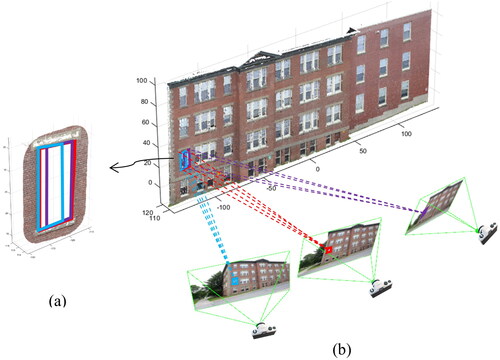
Figure 12. Overlaid 3D polygons on the single-sided façade point clouds (FC 1-12).
As shown in , façade elements 3D candidates, do not entirely overlap due to their location uncertainties coming from their EOP or IOP errors, random errors, and unmodeled biases. Therefore, we aim to develop a method to combine all candidates, effectively reducing the total spatial uncertainty for each facade element. In this work, we developed a spatial weighting function, which was derived from the IDW concept (Shepard Citation1968). In practice, the image that “sees” a single façade element under a vertical angle (where the image plane is parallel to the object plane) can better represent the window compared to oblique images. However, since due to obstacles, all façade elements might not be well-represented in vertical angle images, it is beneficial to utilize multi-view angle images to increase the chance of obstacle avoidance. As a result, multiple 3D borders can be generated which should be “averaged” to improve precision. However, images with oblique angles should not get equal weights as vertical images. The view angle (α) is found by the vector from the camera perspective center to the center of 3D window candidate polygon
(
is number of points from the façade element candidate polygon) and the normal vector of the image plane
. Equations (3) and (4) are used to calculate the view angle and uncertainty-reducing function.
On the other hand, to further improve precision, the 3D borders that are closer to each other should get higher weights. Inspired by the IDW function, Equation (5) is used to find the enhanced borders of the façade elements.
Where : are candidate coordinates, and
are the weights computed in Equation (4), and
) are the combined 3D polygon coordinates. After computing the combined 3D polygon coordinates, they are injected into the Ramer-Douglas-Peucker algorithm, as described in Salehi and Mohammadzadeh (Citation2017), to simplify the overall shape of 3D polygons.
In practice, out of all the overlapping candidates for every façade element, we begin by selecting the one with the maximum area. Following this, we use the KNN search algorithm to determine which candidates’ points in each polygon are closest to the maximum area candidate points, and we designate these as KNN points. Then, we calculate their distance to the maximum area of candidate points.
Results and evaluation
To evaluate the accuracy of the final 3D facade elements’ polygons, we used the IoU metric as shown in EquationEquation (6)(6)
(6) between the computed 3D polygons and ground truth 3D polygons drawn manually over the 3D point cloud (Tripodi et al. Citation2020).
(6)
(6)
where
is the area of overlap between 3D computed polygon and ground truth, and
is the area of union between them. In this research, we processed 750 multi-view images for 12 single-sided façades to compute the 3D locations of 312 façade elements. The results for all single-sided building facades (FC 1 – FC 12) tested with our proposed method are presented in , and corresponding figures can be found in . Furthermore, we computed the mean (
and standard deviation (σ) of IoU values using EquationEquation (7)
(7)
(7) for each single-side façade, considering all the facade elements within that particular façade.
(7)
(7)
Figure 13. Detected incorrect objects (yellow dash line circles) in the two different image views.
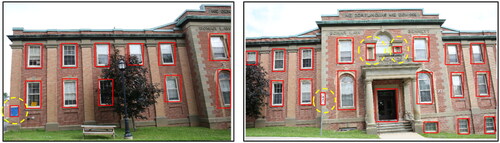
Table 3. Mean and standard deviation of IoU values for the final 3D polygons of facade elements, and the number of façade elements and images used in the implementation.
Where N is the number of façade elements and IoU values range from 0 to 1, with 1 indicating a perfect overlap between the detected and ground truth façade elements.
Discussion
We conducted tests on our proposed method using 12 single-sided facades, encompassing a total of 312 rectangular and curved-shaped facade elements with varying shapes and sizes. It is important to note that this experiment specifically targeted red brick buildings and focused on a single side, which may not fully represent all cases. However, the adaptability of the method to more diverse building scenarios, including other sides or the entire structure, with different shapes and architectures, is evident. Despite the noise present in the facade point clouds and the obscuration of facade elements due to various occlusions, our proposed method demonstrates effective detection. Additionally, the method showcases the capability to model facade elements with diverse shapes and architectures, irrespective of their size or visibility amid occlusions. Furthermore, the efficiency of the proposed method is underscored by its successful implementation on a substantial number of multi-view images (750 images), suggesting its adaptability for large-scale implementation.
Across all facades (FC 1 to 12), our proposed method achieved an overall IoU score of 0.84 as shown in . Furthermore, a standard deviation of 0.16 suggests moderate variability in the accuracy of detections across different images and facades. The accuracy of detection varies depending on the type of facade. For example, FC 2 obtained a very high IoU score of 0.90, which indicates very accurate facade element detection, whereas FC 6 obtained a relatively lower IoU score of 0.76, which indicates less accurate detection in this facade. In contrast, FC 6 attained a relatively lower IoU score of 0.76, suggesting less accurate detection in this particular facade. These discrepancies likely stem from challenges such as variations in image quality, lighting conditions, complete obstruction of windows by trees in specific views, or architectural diversity among different facades. While the proposed method has demonstrated effectiveness in predicting facade elements in 2D through the trained Faster R-CNN model, it is essential to acknowledge certain limitations. Specifically, predicting very small facade elements can pose challenges, and there may be difficulty in distinguishing between billboards or other rectangular objects and actual facade elements, as illustrated in .
The proposed method demonstrates strong performance when applied to segmenting an entire image using SAM. However, challenges persist, notably in terms of over-segmentation and difficulty in distinguishing between different parts of facade elements. Additionally, a noticeable misalignment occurs between the registered projected point cloud and the 2D image, particularly along the borders of facade elements, a discrepancy more pronounced when dealing with the MLS dataset. This misalignment may arise from uncertainties in in-field data registration and inaccuracies in RGB point cloud coloring algorithms. Furthermore, inaccuracies resulting from imprecise EOP or IOP during data collection could contribute to this misalignment. Despite these uncertainties, the proposed method effectively leverages multiple 3D candidates from different view angles for each facade element, thereby mitigating uncertainties and enhancing the final accuracy of facade element localization in 3D.
Furthermore, in the 2D to 3D correspondence, we extract localized point clouds corresponding to each facade element. This approach proves advantageous for fitting more accurate planes for individual facade elements, as opposed to attempting to fit a single plane for all facade elements simultaneously. However, challenges arise when fitting local planes for facade elements located near the intersection of two cardinal walls or when one facade plane deviates from the others. This challenge becomes more pronounced when the image view angle is narrow, leading to the identification of incorrect plane points.
The proposed method introduces an alternative approach to augment the original system of collinearity equations by incorporating an additional plane. This augmentation facilitates the computation of the depth of the 2D borders’ points of facade elements’ segments, skipping the need for matching linear features from one image to another and mitigating potential matching errors. However, the accuracy of this process hinges on precise plane parameters and EOP derived from the camera’s pose, as well as the alignment between the projected point cloud and the image. Any inaccuracies in these parameters can lead to imprecise 3D polygons. To address this, the proposed method leverages a modified spatial IDW-inspired function, considering both the view angle and the distance of each 3D point along the border of 3D facade element candidates.
Conclusion and future directions
Our study proposes a novel method for detecting facade elements in image space (2D) by combining Faster R-CNN and SAM, followed by a projection into 3D object space. Our findings demonstrate the effectiveness of our approach with an % 84 IoU score for the accurate detection of facade elements in 3D, across the dataset of 12 different single-sided façades over 750 multi-view images for 312 facade elements of various sizes with rectangular and curved shapes. This high performance is attained by addressing key limitations present in current techniques. These limitations encompass occlusion effects and spatial uncertainties arising from errors in EOPs, oblique view angles, and misalignment between the projected point cloud and image (2D) which are essential for generating a LOD3 façade model. To overcome these challenges, we employed multi-view capabilities to reduce uncertainties arising from occlusion and EOP errors. To address these uncertainties, we introduced an IDW-inspired spatial weighting function that significantly enhanced the accuracy of 3D localization for facade elements.
Furthermore, there are two potential avenues for improving the proposed method. Firstly, in the registration process between point clouds and image data, enhancement can be achieved by adopting more automated and robust registration methods. This refinement would contribute to a more seamless alignment between the two data sources. Secondly, augmenting the original collinearity equations by introducing additional constraints, such as incorporating the linearity of other objects, has the potential to further enhance the registration process and contribute to the overall refinement of the system. Looking ahead, our future efforts will concentrate on two key areas. The first area of focus will be the integration of indoor elements of buildings into our 3D model. This advancement will enable a more comprehensive 3D representation of the entire building structure, encompassing both exterior and interior environments. The second area of emphasis will be on occluded elements, which require in-depth research and investigation. Additionally, various architectural and functional façade elements will be incorporated to create a more intricate and precise representation of the structures.
Acknowledgments
We extend our gratitude to the NBIF-POSS and NSERC-Discovery funding agencies for their invaluable support throughout this project. Special thanks are also due to Esri and Meta companies for providing access to the pre-trained deep learning models essential to our research. Our sincere appreciation goes to Leica Geosystems and Eagle Engineering and Consulting companies for generously supplying the required dataset, which was vital to our work. We are grateful to GeoNB, a government subdivision, for granting us access to the building footprint dataset, a crucial component of our research. Additionally, the utilization of Generative AI tools significantly enhanced the quality of our writing. We would also like to acknowledge the support received from Pix4D and Trimble Inc. companies, without which this research would not have been possible.
Disclosure statement
No potential conflict of interest was reported by the author(s).
References
- Chen, Y., Liu, X., Yao, M., Deng, S., Li, F., Cheng, L., and Li, M. 2019. “Repeated Structure Detection for 3D Reconstruction of Building Façade from Mobile Lidar Data.” Photogrammetric Engineering & Remote Sensing, Vol. 85 (No. 2):pp. 1–16. doi:10.14358/PERS.85.2.93.
- Cheng, B., Chen, S., Fan, L., Li, Y., Cai, Y., and Liu, Z. 2023. “Windows and Doors Extraction from Point Cloud Data Combining Semantic Features and Material Characteristics.” Buildings, Vol. 13 (No. 2):pp. 507. doi:10.3390/buildings13020507.
- Collins, T., Mesejo, P., and Bartoli, A. 2014. “An Analysis of Errors in Graph-Based Keypoint Matching and Proposed Solutions.” In Computer Vision – ECCV 2014, edited by David Fleet, Tomas Pajdla, Bernt Schiele, and Tinne Tuytelaars, 138–153. Lecture Notes in Computer Science. Cham: Springer International Publishing. doi:10.1007/978-3-319-10584-0_10.
- Esri. 2022. https://www.arcgis.com/home/item.html?id=8c0078cc7e314e31b20001d94daace5e
- Gröger, G., and Plümer, L. 2012. “CityGML – Interoperable Semantic 3D City Models.” ISPRS Journal of Photogrammetry and Remote Sensing, Vol. 71 (No. July):pp. 12–33. doi:10.1016/j.isprsjprs.2012.04.004.
- Han, Y., Choi, J., Byun, Y., and Kim, Y. 2014. “Parameter Optimization for the Extraction of Matching Points Between High-Resolution Multisensor Images in Urban Areas.” IEEE Transactions on Geoscience and Remote Sensing, Vol. 52 (No. 9):pp. 5612–5621. doi:10.1109/TGRS.2013.2291001.
- Jung, J., Stachniss, C., Ju, S., and Heo, J. 2018. “Automated 3D Volumetric Reconstruction of Multiple-Room Building Interiors for as-Built BIM.” Advanced Engineering Informatics, Vol. 38 (No. October):pp. 811–825. (Elsevier: doi:10.1016/j.aei.2018.10.007.
- Kamra, V., Kudeshia, P., Arabinaree, S., Chen, D., Akiyama, Y., and Peethambaran, J. 2023. “Lightweight Reconstruction of Urban Buildings: Data Structures, Algorithms, and Future Directions.” IEEE Journal of Selected Topics in Applied Earth Observations and Remote Sensing, Vol. 16 pp. 902–917. Institute of Electrical and Electronics Engineers Inc.: doi:10.1109/JSTARS.2022.3232758.
- Kirillov, A., Mintun, E., Ravi, N., Mao, H., Rolland, C., Gustafson, L., Xiao, T., et al. 2023. “Segment Anything.” https://arxiv.org/abs/2304.02643v1
- Kuznetsova, A., Rom, H., Alldrin, N., Uijlings, J., Krasin, I., Pont-Tuset, J., Kamali, S., et al. 2018. “The Open Images Dataset V4: Unified Image Classification, Object Detection, and Visual Relationship Detection at Scale.” International Journal of Computer Vision, Vol. 128 (No. 7):pp. 1956–1981. doi:10.1007/s11263-020-01316-z.
- Li, C.-K., Zhang, H.-X., Liu, J.-X., Zhang, Y.-Q., Zou, S.-C., and Fang, Y.-T. 2020. “Window Detection in Facades Using Heatmap Fusion.” Journal of Computer Science and Technology, Vol. 35 (No. 4):pp. 900–912. doi:10.1007/s11390-020-0253-4.
- Li, Z., Zhang, L., Mathiopoulos, P.T., Liu, F., Zhang, L., Li, S., and Liu, H. 2017. “A Hierarchical Methodology for Urban Facade Parsing from TLS Point Clouds.” ISPRS Journal of Photogrammetry and Remote Sensing, Vol. 123 (No. January):pp. 75–93. doi:10.1016/j.isprsjprs.2016.11.008.
- Liu, H., Li, W., and Zhu, J. 2022. “Translational Symmetry-Aware Facade Parsing for 3D Building Reconstruction.” IEEE Multimedia., Vol. 29 (No. 4):pp. 38–47. doi:10.1109/MMUL.2022.3195990.
- Liu, H., Xu, Y., Zhang, J., Zhu, J., Li, Y., and Hoi, S.C.H. 2020. “DeepFacade: A Deep Learning Approach to Facade Parsing with Symmetric Loss.” IEEE Transactions on Multimedia, Vol. 22 (No. 12):pp. 3153–3165. (Institute of Electrical and Electronics Engineers Inc.: doi:10.1109/TMM.2020.2971431.
- Lotte, R.G., Haala, N., Karpina, M., de Aragão, L.E.O., Cruz, e., and Shimabukuro, Y.E. 2018. “3D Façade Labeling over Complex Scenarios: A Case Study Using Convolutional Neural Network and Structure-From-Motion.” Remote Sensing, Vol. 10 (No. 9):pp. 1435. doi:10.3390/rs10091435.
- Lu, Y., Wei, W., Li, P., Zhong, T., Nong, Y., and Shi, X. 2023. “A Deep Learning Method for Building Façade Parsing Utilizing Improved SOLOv2 Instance Segmentation.” Energy and Buildings, Vol. 295 (No. September):pp. 113275. doi:10.1016/j.enbuild.2023.113275.
- Ma, W., Ma, W., and Xu, S. 2022. “Deep Facade Parsing with Occlusions.” KSII Transactions on Internet and Information Systems, Vol. 16 (No. 2):pp. 524–543. doi:10.3837/TIIS.2022.02.009.
- Malihi, S., Zoej, M.J.V., Hahn, M., and Mokhtarzade, M. 2018. “Window Detection from UAS-Derived Photogrammetric Point Cloud Employing Density-Based Filtering and Perceptual Organization.” Remote Sensing, Vol. 10 (No. 8):pp. 1320. doi:10.3390/rs10081320.
- Moghimi, A., Celik, T., and Mohammadzadeh, A. 2022. “Tensor-Based Keypoint Detection and Switching Regression Model for Relative Radiometric Normalization of Bitemporal Multispectral Images.” International Journal of Remote Sensing, Vol. 43 (No. 11):pp. 3927–3956. doi:10.1080/01431161.2022.2102951.
- Neuhausen, M., and König, M. 2018. “Automatic Window Detection in Facade Images.” Automation in Construction, Vol. 96 (No. December):pp. 527–539. doi:10.1016/j.autcon.2018.10.007.
- Nordmark, N., and Ayenew, M. 2021. “Window Detection In Facade Imagery: A Deep Learning Approach Using Mask R-CNN,” July. https://arxiv.org/abs/2107.10006v1.
- Pantoja-Rosero, B.G., Achanta, R., Kozinski, M., Fua, P., Perez-Cruz, F., and Beyer, K. 2022. “Generating LOD3 Building Models from Structure-from-Motion and Semantic Segmentation.” Automation in Construction, Vol. 141 (No. September):pp. 104430. doi:10.1016/j.autcon.2022.104430.
- Pexman, K., Lichti, D.D., and Dawson, P. 2021. “Automated Storey Separation and Door and Window Extraction for Building Models from Complete Laser Scans.” Remote Sensing, Vol. 13 (No. 17):pp. 3384. doi:10.3390/rs13173384.
- Previtali, M., Díaz-Vilariño, L., and Scaioni, M. 2018. “Towards Automatic Reconstruction of Indoor Scenes From Incomplete Point Clouds: Door and Window Detection and Regularization.” The International Archives of the Photogrammetry, Remote Sensing and Spatial Information Sciences, Vol. XLII-4 pp. 507–514. doi:10.5194/isprs-archives-XLII-4-507-2018.
- Pu, S., and Vosselman, G. 2009. “Knowledge Based Reconstruction of Building Models from Terrestrial Laser Scanning Data.” ISPRS Journal of Photogrammetry and Remote Sensing, Vol. 64 (No. 6):pp. 575–584. doi:10.1016/j.isprsjprs.2009.04.001.
- Ren, S., He, K., Girshick, R., and Sun, J. 2015. “Faster R-CNN: Towards Real-Time Object Detection with Region Proposal Networks.” IEEE Transactions on Pattern Analysis and Machine Intelligence, Vol. 39 (No. 6):pp. 1137–1149. doi:10.1109/TPAMI.2016.2577031.
- Salehi, A., and Mohammadzadeh, A. 2017. “Building Roof Reconstruction Based on Residue Anomaly Analysis and Shape Descriptors from Lidar and Optical Data.” Photogrammetric Engineering & Remote Sensing, Vol. 83 (No. 4):pp. 281–291. doi:10.14358/PERS.83.4.281.
- Shepard, D. 1968. “A Two-Dimensional Interpolation Function for Irregularly-Spaced Data.” Paper presented at Proceedings of the 1968 23rd ACM National Conference On. ACM Press, 517–524. doi:10.1145/800186.810616.
- Sun, Y., Malihi, S., Li, H., and Maboudi, M. 2022. “DeepWindows: Windows Instance Segmentation through an Improved Mask R-CNN Using Spatial Attention and Relation Modules.” ISPRS International Journal of Geo-Information, Vol. 11 (No. 3):pp. 162. doi:10.3390/ijgi11030162.
- Teeravech, K., Nagai, M., Honda, K., and Dailey, M. 2014. “Discovering Repetitive Patterns in Facade Images Using a RANSAC-Style Algorithm.” ISPRS Journal of Photogrammetry and Remote Sensing, Vol. 92 (No. June):pp. 38–53. doi:10.1016/j.isprsjprs.2014.02.018.
- Torr, P.H.S., and Zisserman, A. 2000. “MLESAC: A New Robust Estimator with Application to Estimating Image Geometry.” Computer Vision and Image Understanding, Vol. 78 (No. 1):pp. 138–156. doi:10.1006/cviu.1999.0832.
- Tripodi, S., Duan, L., Poujade, V., Trastour, F., Bauchet, J. P., Laurore, L., and Tarabalka, Y. 2020. “Operational Pipeline for Large-Scale 3D Reconstruction of Buildings from Satellite Images.” Paper presented at International Geoscience and Remote Sensing Symposium (IGARSS), September. Institute of Electrical and Electronics Engineers Inc., 445–448. doi:10.1109/IGARSS39084.2020.9324213.
- Wang, S., Kang, Q., She, R., Tay, W. P., Navarro, D. N., and Hartmannsgruber, A. 2022. “Building Facade Parsing R-CNN,” May. https://arxiv.org/abs/2205.05912v1.
- Wang, W., Xu, Y., Ren, Y., and Wang, G. 2021. “Parsing of Urban Facades from 3D Point Clouds Based on a Novel Multi-View Domain.” Photogrammetric Engineering & Remote Sensing, Vol. 87 (No. 4):pp. 283–293. (American Society for Photogrammetry and Remote Sensing: doi:10.14358/PERS.87.4.283.
- Wang, Y., Zhao, Y., and Petzold, L. 2023. “An Empirical Study on the Robustness of the Segment Anything Model (SAM),” May. https://arxiv.org/abs/2305.06422v2.
- Wen, X., Xie, H., Liu, H., and Yan, L. 2019. “Accurate Reconstruction of the LoD3 Building Model by Integrating Multi-Source Point Clouds and Oblique Remote Sensing Imagery.” ISPRS International Journal of Geo-Information, Vol. 8 (No. 3):pp. 135. doi:10.3390/ijgi8030135.
- Wolf, P. R., Dewitt, B. A., and Wilkinson, B. E. 2014. “Elements of Photogrammetry” (with Applications in GIS). 4th ed. New York: McGraw-Hill Education.
- Wysocki, O., Hoegner, L., and Stilla, U. 2022. “Refinement of Semantic 3D Building Models by Reconstructing Underpasses from MLS Point Clouds.” International Journal of Applied Earth Observation and Geoinformation, Vol. 111 (No. July):pp. 102841. doi:10.1016/j.jag.2022.102841.
- Xia, S., and Wang, R. 2019. “Façade Separation in Ground-Based LiDAR Point Clouds Based on Edges and Windows.” IEEE Journal of Selected Topics in Applied Earth Observations and Remote Sensing, Vol. 12 (No. 3):pp. 1041–1052. doi:10.1109/JSTARS.2019.2897987.
- Zhang, C., Puspitasari, F.D., Zheng, S., Li, C., Qiao, Y., Kang, T., Shan, X. 2023. “A Survey on Segment Anything Model (SAM): Vision Foundation Model Meets Prompt Engineering.” arXiv doi:10.48550/arXiv.2306.06211.
- Zhang, G., Pan, Y., and Zhang, L. 2022. “Deep Learning for Detecting Building Façade Elements from Images Considering Prior Knowledge.” Automation in Construction, Vol. 133 (No. January):pp. 104016. doi:10.1016/j.autcon.2021.104016.
- Zheng, Y., Peter, M., Zhong, R., Elberink, S.O., and Zhou, Q. 2018. “Space Subdivision in Indoor Mobile Laser Scanning Point Clouds Based on Scanline Analysis.” Sensors (Basel, Switzerland), Vol. 18 (No. 6):pp. 1838. doi:10.3390/S18061838.
- Zhuo, X., Tian, J., and Fraundorfer, F. 2023. “Cross Field-Based Segmentation and Learning-Based Vectorization for Rectangular Windows.” IEEE Journal of Selected Topics in Applied Earth Observations and Remote Sensing, 16: 431–448. doi:10.1109/JSTARS.2022.3218767.