
 ?Mathematical formulae have been encoded as MathML and are displayed in this HTML version using MathJax in order to improve their display. Uncheck the box to turn MathJax off. This feature requires Javascript. Click on a formula to zoom.
Abstract
Ultraviolet (UV)-reflectance is an essential signal of many plant species, which use wavelength-selective pigments in floral reproductive structures to determine the color of flowers and how they appear to their aerial pollinators, primarily bees. This paper presents a pollinator-inspired remote-sensing system incorporating UV reflectance into a flower detector for strawberry crops. We designed a compact, cost-effective UV-sensitive camera for aerial remote sensing over crop rows. Our camera and a deep-learning algorithm comprise our Nature-Inspired Detector (NID) system. We trained YOLOv5 and Faster R-CNN on our dataset of strawberry images incorporating the UV spectrum (300–400 nm). Our results showed that NID-based YOLO V5 outperformed NID-based Faster R-CNN in training time (0.3 vs. 4.5–5.5 hours) and mean Average Precision—mAP (0.951 vs. 0.934). We also present the field-test of our NID-based YOLOv5 system on a drone platform to validate its ability to detect strawberry flowers.
RÉSUMÉ
La réflectance ultraviolette (UV) est un signal essentiel de nombreuses espèces végétales qui utilisent des pigments sélectifs en longueur d’onde dans les structures reproductives florales pour déterminer la couleur des fleurs et leur apparence pour leurs pollinisateurs aériens, principalement les abeilles. Cet article présente un système de télédétection inspiré des pollinisateurs incorporant la réflectance UV dans un détecteur de fleurs pour les cultures de fraises. Nous avons conçu une caméra sensible aux UV compacte et économique pour la télédétection aérienne sur les rangées de cultures. Notre caméra et un algorithme d’apprentissage profond constituent notre système de détection inspiré de la nature (NID). Nous avons entraîné YOLOv5 et Faster R-CNN sur notre ensemble de données d’images de fraises incorporant le specter UV (300–400 nm). Nos résultats ont montré que YOLOv5 pour notre NID surpassait Faster R-CNN en temps d’entraînement (0,3 contre 4,5–5,5 heures) et mAP (0,951 contre 0,934). Nous présentons également une validation sur le terrain de notre système YOLOv5 avec notre NID sur une plateforme aérienne pour valider sa capacité à détecter les fleurs de fraisier.
Introduction
Agriculture stands at the forefront of innovation, especially in this era marked by dynamic shifts such as climate change, urbanization, and a burgeoning global population (Davis Citation2018). To navigate these changes successfully, the agricultural sector must embrace cutting-edge technologies, including compact digital cameras, perception sensors, AI-based algorithms, and unmanned aerial vehicles (UAVs), to enhance crop management. Among these, UAV-based remote sensing methods are rapidly emerging as indispensable tools, both in agricultural (Tsouros et al. Citation2019) and nonagricultural (Shakhatreh et al. Citation2019) domains, for comprehensive data gathering.
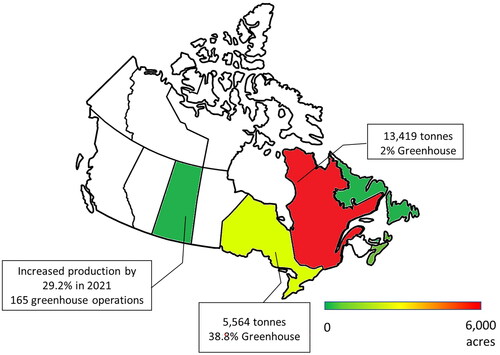
Within the vast family of Rosaceae, encompassing prominent crops like apples, pears, raspberries, blackberries, strawberries, and cloudberries, strawberries distinguish themselves by certain cultivars that flower continuously throughout the season. This unique trait, coupled with the consistent growth of strawberries—Canada’s fifth most valuable fruit crop reaching a farm gate value of $129 million in 2021—positions them as ideal subjects for aerial imagery studies. Furthermore, the recent shift toward local and domestic food production post-pandemic (Beingessner and Fletcher Citation2020) has fueled greenhouse strawberry production, witnessing a notable 19.1% sales increase in 2021 (Government of Canada Citation2022b; Government of Saskatchewan Citation2023; ). As the leading strawberry producer, Quebec grapples with production challenges due to reduced pesticide use and unpredictable weather, prompting considerations for greenhouse and polytunnel production. However, greenhouse environments pose challenges to natural pollinators, potentially paving the way for the adoption of robotic pollinators in Canadian fruit farming.
Figure 1. 2021 Canadian farm distribution map for strawberry fruit production (Government of Canada Citation2022a; Government of Saskatchewan Citation2023; Statistics Canada Citation2022).
We postulate that it is feasible to develop an intelligent system capable of performing aerial sensing inspired by natural pollinators, such as honeybees, to address key agricultural challenges. The technologies highlighted earlier—compact digital cameras, perception sensors, AI-based algorithms, and UAVs—have made significant strides in addressing agricultural issues, from crop management to pest detection and resource optimization. Despite their contributions, a noticeable gap remains in the realm of bioinspired intelligent systems, especially those mirroring the sensory capabilities of natural pollinators like honeybees. Most existing systems overlook the UV-G-B spectrum, a key element in effective pollination. Research has shown that flowering plants, evolving over millennia, have developed intricate interactions with insects whose vision spans the UV-G-B range (Briscoe and Chittka Citation2001). Honeybees, as pollinating insects, excel at distinguishing crop species and cultivars based on floral patterning in the undetectable-to-human-vision UV-G-B spectrum (Briscoe and Chittka Citation2001). This increased contrast significantly contributes to their efficiency in target detection. We hypothesize that the UV-G-B range would be better suited to UAV platforms for flower detection as it would mimic pollinator vision and detect the intended plant cues. Our proposed system aims to bridge this gap by incorporating the UV-G-B range in UAV platforms, thereby mimicking pollinator vision. This bioinspired approach not only holds the potential to enhance artificial pollination methods but also introduces a novel solution to unaddressed challenges in agricultural technology, contributing significantly to the sustainability and efficiency of crop management amidst changing environmental conditions.
The field of crop sensing offers various aerial platforms, each selected based on specific application requirements. For instance, fixed-wing platforms boast increased flight time and payload capacity, but their inability to hover poses challenges in acquiring higher-quality data. Blimps, with their hovering ability, can capture clear images but prove slow and challenging to maneuver outdoors. In recent years, there has been a notable shift toward using UAVs in precision agriculture (Kim et al. Citation2019; Mulla Citation2013). Rotor copters, with hovering capabilities, play a crucial role in capturing clear, high-resolution images. Unlike fixed-wing UAVs, they can remain stationary over a specific point of interest, ensuring steady focus without motion blur. While studies have comprehensively reviewed the advantages and disadvantages of different aerial platforms for agricultural applications (Sankaran et al. Citation2015), most quadcopters used in these studies are often closed-source, expensive, and heavy. The limitations associated with heavy, closed-source, and expensive drones—such as restricted maneuverability, limited customization options, and higher operational costs—pose significant challenges for technology adoption in this domain.
The most frequently used optoelectronic sensors for precision agriculture applications use a visible light range 400–700 nm (Pallottino et al. Citation2019). However, the spectral bands outside of the range of human vision, such as the Near UV (300–400 nm), offer valuable data about crops. This underexplored range in multispectral cameras is crucial for understanding the co-evolved interactions between flowering plants and insects, which use UV reflectance in the Near UV range (Briscoe and Chittka Citation2001). Remote-sensing data in this range can capture ecological signaling, enhancing our understanding of pollinator landscapes. Innovations like UAV-based NIR imagery for water stress detection (Antolίnez Garcίa and Cάceres Campana Citation2023; Zhou et al. Citation2021) and multispectral cameras for disease detection in crops (Abdulridha et al. Citation2020; Gómez-Candón et al. Citation2016) demonstrate the potential of remote detection beyond the visual range. This project aims to leverage these advancements by developing a biologically inspired flower detection system using the UV-G-B spectrum, deploying a powerful yet cost-effective drone setup.
UV cameras are expensive and cumbersome (Stuart et al. Citation2019). The underdevelopment of such sensors may stem from the lag in studies exploring the use of UV floral reflectance of plants. Spectral reflectance studies have reported down to 300 nm, but most species in reflectance databases are native species, not crops (Arnold et al. Citation2008). The lack of data on the floral reflectance of crops leaves a knowledge gap for estimating the visibility of crop cultivars to pollinators. Furthermore, UV cameras and lenses in plant UV spectral reflectance studies are bulky and expensive, leading to even fewer field studies (Stuart et al. Citation2019).
Building upon the identified research gap, this paper introduces a Nature-Inspired Detector (NID), a biologically inspired UV-G-B camera emulating a natural pollinator’s vision for detecting crop flowers. Integrated with a state-of-the-art object detection algorithm, our NID system not only promises improved flower counting for yield estimation but also aims to assist farmers in making more informed decisions. Subsequent sections delve into hardware development, aerial platform selection, and object detection algorithms, outlining methodologies adopted for field experimentation and data analysis. The discussion in the later sections addresses the results, highlighting both accomplishments and avenues for future research.
Methodology
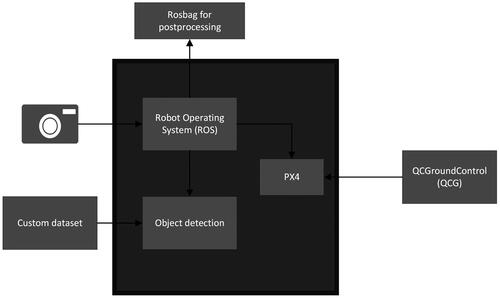
Building upon the information outlined in the previous section, this section details the hardware tools selected to support our NID and the software tools used to achieve the desired detection. Additionally, a schematic workflow of the entire system is illustrated in .
Figure 2. Complete schematic workflow of the NID based detection system.
Nature-Inspired Detector (NID)
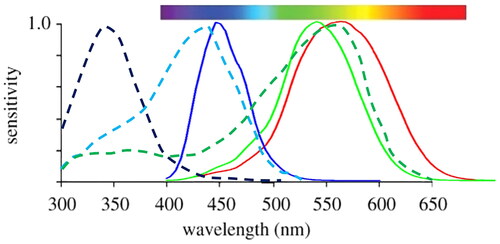
We postulated that UV-based detection would enhance airborne flower count, but adapted remote sensors were missing. Therefore, a custom sensor was designed that was inspired by bees. For this research, we focus specifically on Apis mellifera, or western honeybees (James and Pitts-Singer Citation2008). Like humans, bees have three peaks in their vision spectrum. While humans see from 400 to 700 nm, from blue to red (RGB), honeybees see from 300 to 650 nm, from near-UV to green (Briscoe and Chittka Citation2001). presents the respective sensitivity curves.
Figure 3. Visual spectral Sensitivity of Western Honey Bee vs. Human. Dotted black, blue, and green lines represent bee UV, B, G. Solid red, green and blue lines represent human R, G, and B (Coliban et al. Citation2020; Dyer et al. Citation2015).
The design and development of our NID encompasses two main components. The first component is the design of the sensor that makes it possible to capture images in the required wavelength spectrum. The second component focuses on the development of suitable hardware and integration with other relevant components so that the detector can be used in a multitude of applications—in this case with a quadcopter. The following subsections dive deeper into the details of the design of NID.
Sensor design
Most of the digital cameras that capture images in the human visual spectrum use a Bayer filter, a pattern of red, green, and blue filters (RGB) across the photodiode matrix (Palum Citation2001). The internal body of most cameras also has an Anti-Aliasing (AA) (blur)/IR cut filter (ICF) made of various glass, which prevents UV light from reaching the sensor due to the absorption of photon energy (Ulizio Citation2015). Internal microlens and external glass lenses also affect UV light transmission similarly. shows the internal spectral transmission of an industry-standard GoPro camera.
Figure 4. Internal visual remote sensor design. (a) GoPro Hero 9 RGB action camera (b) NID monochrome camera. * 80% transmission, ** >91.5% transmission, ***>10% transmission. (Bandara Citation2011; Corning Inc Citation2022; Dyer et al. Citation2015; Nieto et al. Citation2012; Präzisions Glas & Optik Citation2023; Taguchi and Enokido Citation2017).
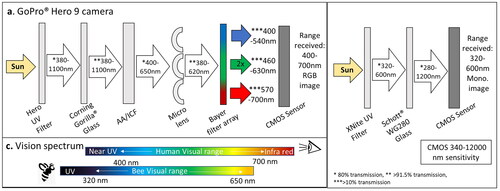
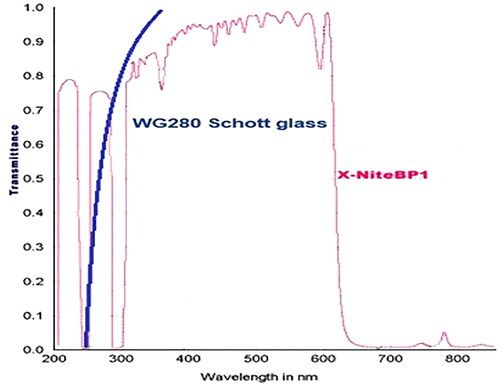
To make our NID able to capture images in the near UV-G-B range, we first removed the Bayer filter from a CMOS sensor to facilitate this. (Lopez-Ruiz et al. Citation2017) accomplished this with their UV sensor for a Raspberry Pi camera; however, the process needed to be more robust and replicable. Therefore, we partnered with a commercial company to remove the filter for us using their proprietary methodology (LDP LLC—MAXMAX Citation2022b). We replaced the AA/ICF with Schott WG280 glass which transmits light to 280 nm (Schott AG Citation2023). We removed the microlens and added an external lens to restrict the transmission above 650 nm, which allowed 80–100% transmission between 300 and 650 nm (X-NiteBP1 filter, Max Max), as seen in .
Figure 5. Transmission spectrograph for materials of NID camera. The blue line represents WG280 Schott glass, and the pink line represents the XNite BP1 filter. >80% transmission in the 300-650 nm range (LDP LLC—MAXMAX Citation2022a; Schott AG Citation2023).
This design results in a monochrome sensor that mimics the vision spectrum of a western honeybee. Inherently, monochrome sensors can achieve higher resolution, outputting smaller data arrays which leads to faster processing times or frame rates, and smaller recording than their RGB counterparts, as colored images are processed over three dimensions. The Bayer filter can also reduce the optical resolution of the system (Burlayenko and Lukianchuk Citation2017). In this context, monochrome images present several advantages for machine vision processing. contrasts a standard GoPro’s internal light transmission design to our NID camera.
Camera design
Our NID is designed with a handful of key requirements tailored to agricultural context. The camera has been designed to be lightweight, affordable, and portable, with a specific emphasis on usability with drones. Given the limited shipping conditions for the 2019 pandemic, compares two camera body models that were considered. Both are lightweight and can be mounted onto a drone. When considering camera resolution requirements, we considered that the downdraft from rotors could move target flowers and introduce excess blur to images, decreasing data quality. To keep downdraft effects to a minimum, we designed the system to fly at 3 meters. When determining the appropriate sensor resolution, we sampled comparable flower detection studies that used ground sampling distance (GSD) as a standard metric across various camera remote sensors, which ranged from 0.7 to 3 cm/pixel (Chen et al. Citation2019; Hunt and Daughtry Citation2018; Vanbrabant et al. Citation2020). For digital photos in remote sensing, GSD is a geometric relationship, described in EquationEquation (1)(1)
(1) , between a camera’s physical attributes and distance from a target to determine ground measurements from pixel distances in an image (Purcell Citation2000). Considering our predetermined flight altitude of 3 meters, we determined that a resolution of 3,264 × 2,448 would result in a GSD = 1.16 cm/pixel. Both models considered had sensors that could provide an adequate resolution. However, unlike the GoPro, the X-Nite has a USB cable connecting the camera directly to a computer for image capture and continuous power drawing. This camera is lighter in weight and retails for 500 USD. These attributes made it more robust and cost-effective compared to the GoPro model.
Table 1. Our camera model contrasted with a comparable camera on the market.
We calculated GSD with the following:
(1)
(1)
where H is the flight altitude (m), and c, the focal length (mm). λ is the pixel size, 1.4 um, as provided by the manufacturer among the sensor’s specifications.
Camera characterization
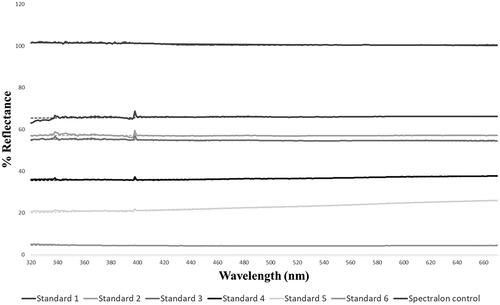
Characterization of a camera model has applications in developing and using color-related image-processing algorithms (Barnard and Funt Citation2002). It ensures a predictive relationship between the camera sensor’s response as a function of wavelength. Previous studies have quantitatively analyzed the color patterns of animals in the UV spectrum using linear camera responses (Garcia et al. Citation2013). As the NID is a novel design, we characterized the camera to ensure a linear response for analyzing strawberry flowers similarly. A reflectance standard is a reference sample of a known reflectance ratio (amount of light reflected by a surface given a determined amount of incident radiation) within a given spectral range (Wen Citation2016). As commercially available reflectance standards poorly reflect UV (320–400 nm), we created appropriate reflectance standards. Following the work of Dyer et al. (Citation2004), we created five standards from varying proportions of medical-grade magnesium oxide (MgO), Plaster of Paris, and activated carbon and a sixth standard of black UV-absorbing plastic. We measured each standard’s (1–6) spectral reflectance (% R) in the 200–700 nm range with a Perkin Elmer’s Lambda 850 UV-VIS spectrophotometer. shows the resulting spectrogram. The intercept for each curve denotes the consistent % R each standard will emit across varying lighting conditions.
Figure 6. UV reflectance standards spectrogram measured with Perkin Elmer’s Lambda 850 UV-VIS spectrophotometer.
Images of the standards were recorded with our NID camera in raw monochrome format and encoded into an 8-bit scale using ImageJ (1.53t). The camera response consisted of mean pixel values obtained from point sampling ten pixels at the center region of each standard. Calculations involved in characterization were performed in Microsoft® Excel® 2016.
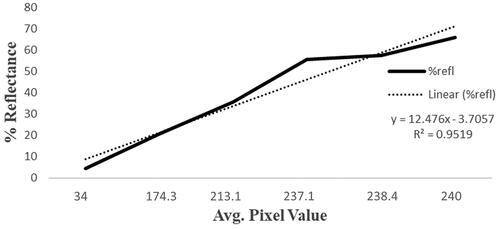
The Opto-electronic conversion function curve for the NID was constructed by plotting the camera’s response for each spectral reflectance reading (%R) of the reflectance standards (Garcia et al. Citation2014). A simple linear model was fitted to the curve, providing strong evidence for a linear relationship between the camera response, pixel value, and spectral reflectance (, R2 = 0.9519).
Figure 7. Correlation curve for UV-reflectance standards and image pixel values. % Reflectance measured with Perkin Elmer’s Lambda 850 UV-VIS spectrophotometer. Pixel value from images produced with the NID camera.
UAV system implementation
We selected the UAV platform to maximize the payload capacity while minimizing cost and size. Additionally, the choice of the aerial platform also incorporated the aspect of it being open source. details the comparison of the potential options we considered. Spiri Robotics LLC (Citation2023) stood out as the best option compared to other commercially available devices. The Mu is powered by Nvidia’s TX2, powerful enough for heavy onboard image processing. To mount our camera and interface it to the onboard computer, we replaced the original underbelly of the Mu with an in-lab 3D printed attachment, which could house the mounting for the camera. Moreover, we replaced the original landing gear of the drone with wooden dowels to make it taller to accommodate the additional sensor. shows the modified drone in the field, ready for take off.
Figure 8. Modified Spiri Mu quadcopter. (A) NID camera held on the underside of UAV facing the ground at 90 degrees. (B) Extended legs to accommodate NID camera mounting.
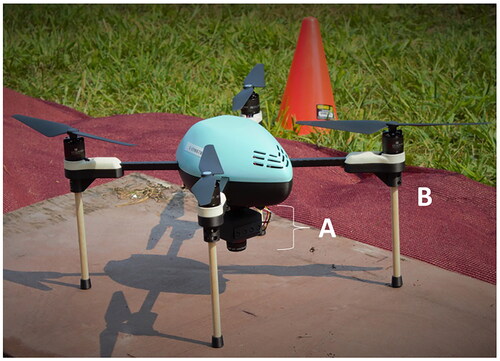
Table 3. Cost and size comparison of Spiri Mu with similar UAV models: DJI Mavic 3 (DJI Citation2023a), and DJI Phantom 4 Pro (DJI Citation2023b), and Spiri Robotics LLC (Citation2023).
Qground Control (QGC) calibrates onboard sensors and monitors mission parameters during flight. The onboard system runs on Linux with ROS preinstalled, simplifying our sensors’ software integration and providing us with tools to record and transmit data efficiently. Our ROS camera driver is based on standard ROS packages to fetch and convert the USB camera feed to a ROS image topic. Relevant ROS topics were stored in a ROS bag and later processed to extract relevant information for further utilization. shows an excerpt of the training data set.
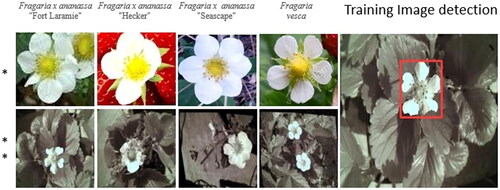
Figure 9. Strawberry cultivars. * RGB images from Vesey (Citation2022), ** monochrome images captured with NID camera. The far-right image shows Yolo’s detection of a strawberry flower on the training dataset.
Field deployment setup
To validate the usefulness of our solution as a precision agriculture tool, we deployed our sensor on the Spiri Mu and flew over a local strawberry field. We conducted field flights at Pépinère F. Fortier near Princeville, Quebec—planted with a mix of white-flowering “Seascape” and “Albion” cultivars. An altitude of 3 meters reduced the effects of rotor downdraft on plants and produced a GSD = 1.16 cm/pixel. The Spiri Mu captured video under sunny conditions from 11 am to 1 pm to keep consistent with the training dataset. We used 88 frames, which were tiled and resized to 768 × 768 pixels to reduce processing time, to test our trained algorithm. A single reviewer counted 2,295 flowers as the ground truth.
Data analysis
This section details the tools we leverage and our contributions to the analysis of the data gather from our NID.
Object detection algorithm
In our methodology, we compared two Convolutional Neural Network (CNN) architectures for flower detection: Faster R-CNN (Faster Region-based Convolutional Neural Network) and YOLOv5 (You Only Look Once), chosen based on their documented performance in similar research. Faster R-CNN has demonstrated high accuracy in various applications, including strawberry flower detection using a DJI Phantom 4 pro, with a mean average precision (mAP) of 0.772 (Chen et al. Citation2019). This method employs a two-stage approach with a Region Proposal Network (RPN) and a separate network for classification and refinement of regions. However, it is computationally expensive and slower in performance (Mahendrakar et al. Citation2022). YOLOv5, on the other hand, is known for its efficiency and real-time detection capabilities, with studies like Immaneni and Chang (Citation2022) achieving 91.95% accuracy at 14.6 frames per second in drone images from a strawberry field. YOLO’s architecture processes the entire image in one evaluation, predicting bounding boxes and class probabilities directly, making it suitable for real-time applications (Jocher et al. Citation2020).
For our study, we adapted and trained these algorithms specifically for images captured by our NID. We selected Faster R-CNN to compare with Chen et al. (Citation2019) but opted for Inception V2 instead of their used Resnet 50, as Inception V2 has been shown to yield higher detection accuracy (Bianco et al. Citation2018; Sukegawa et al. Citation2022). Inception V2 uses parallel convolutions to capture information at various scales, offering a wider but shallower architecture compared to Resnet 50. We employed YOLOv5 following a review by Tian and Liao (Citation2021) on its performance in flower detection. Our code implementation was based on the publicly available scripts for both YOLOv5 (Jocher et al. Citation2020) and Faster R-CNN (Ren et al. Citation2015). This comparative approach was taken to ensure a credible and meaningful analysis, aligning with the current state of the art in this domain.
Dataset generation
Most of the off-the-shelf object detection algorithms with pre-trained weights are trained on RGB image datasets, such as MS COCO—one of the most widely used datasets for object detection. Since no image datasets of the UV-G-B spectrum were available, we created an original dataset using various strawberry cultivars and made it publicly available in PytorchYOLOv5 and TF record formats (DOI: 10.5281/zenodo.7863719). F. x ananassa “Seascape” and “Fort Laramie” are commonly recommended commercial everbearing cultivars for central and east coast Canadian provinces. Therefore, we included them along with F. x ananassa “Hecker,” an older everbearing cultivar popular with commercial growers for decades before “Seascape” (Strawberry plants LLC Citation2022). F. Vesca is a North American woodland native grown by breeders for its genetic attributes and by specialty fruit growers for wine production. We procured and potted all bare-root plants from a local Quebec nursery. We captured images under sunny conditions between 11 am and 1 pm within the 320–600 nm. We placed the camera 6 cm from an open flower at a 90-degree overhead angle. Images had 640 × 480 resolution (focal length = 3.6 mm, GSD = 0.023 cm/pixel).
Image preprocessing
The objective of the project is to develop a sensor that captures information within a specific spectrum and reduces the need for extensive image preprocessing steps. The hardware design simplifies the complete image processing pipeline—making it possible for real-time implementation in real-world applications. Therefore, no radiometric correction was applied to the raw images. However, for training our object detection algorithm, several image processing and augmentation steps were followed. These were essential to ensure accurate and robust predictions out of the learning-based model.
Roboflow Inc (2022) was used for dataset creation—bounding box augmentation and image labeling. Images were pre-processed for auto-orientation and resized into a square shape of 416 × 416 for detection algorithm compatibility. We then applied the following augmentations of the dataset for training purposes: horizontal and vertical flip, rotate ±90 degrees, rotate ±15 degrees, sheer ±15 degrees vertical and horizontal, noise 5%, and blur 5px. The resulting dataset consisted of 284 NID images.
Results
This section focuses on the results and validation of the NID based on its ability to detect flowers using UV reflectance. shows the comparison between the RGB and UV-G-B images of the same variants of the flowers. Flowers in this specific spectrum of light appear to be brighter than the objects in the vicinity, thus making it easier to detect and eliminating the need for major image preprocessing. We then discuss the performance of the object detection algorithms on the UV-G-B image dataset and validate the design of the NID.
Flower detection and algorithm comparison
Initially, pretrained weights were employed for both algorithms from MS COCO2017 (Lin et al. Citation2014). Training, validation, and test split was 40%/40%/20%. We compared the algorithms using the following metrics: [email protected], True positive (TP), False positive (FP), and False negative (FN). We trained YOLO and Faster R-CNN on our dataset to compare results. YOLOv5s was chosen due to the small training dataset in this study and ran for 1,000 epochs. We ran Faster R-CNN with inception V2 for 20,000 steps. shows the results for the trained algorithms. YOLOv5s showed overall higher performance than Faster R-CNN. Therefore, we used YOLO for field-testing of the system.
Table 2. Resulting detection from UV-G-B trained YOLOv5 and Faster R-CNN on training dataset at 416 × 416 resolution, and on aerial images at 96 × 96 resolution.
The flower resolution from aerial images (field deployment) was much lower than the training dataset. We, therefore, trained YOLOv5 and Faster R-CNN on the same image dataset as before but at a lower resolution, 96 × 96 pixels, to increase TP detection (). We ran inferences with a 0.51 confidence threshold for both algorithms on a Tesla P100-PCIE − 16 GB in Google Colab (Bisong Citation2019). shows the results of our trained YOLOv5 on the aerial images.
Table 4. Comparison of sensors in similar experimental conditions.
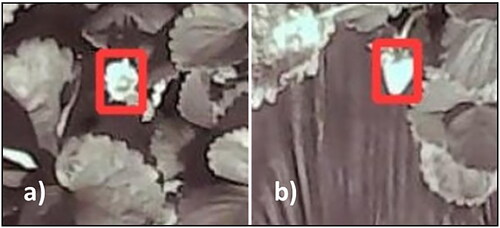
Although the TP detection proportion was low (37.1%) for YOLOv5, overall, 97% of flowers were accurately detected (n = 1,218 of 1,243 in the dataset). However, the FP detections (n = 2,042, 62.2%) far outnumbered the TP leading to a lower proportion. Ripening or developing fruits accounted for 33.3% (n = 680) of FP detections 9b. A similar result was attained with Faster R-CNN (17.6%). YOLOv5 showed the best overall performance for our system. As we did not train our algorithm with strawberry fruits, and they exhibited similar spectral properties as the flowers, this led to increased FP detections (see, for instance, ). Chen et al. (Citation2019) conducted a similar flower detection study on strawberries using a Phantom 4 Pro to capture aerial images in RGB. compares their results with ours. Chen et al. (Citation2019) used Faster R-CNN with Resnet 50 trained on ImageNet at a flight altitude of 3 m. Our system used Inception V2, resulting in higher mAP with Faster R-CNN than their study, however, overall detection was low. When comparing the results from the NID to the findings from Chen et al. (Citation2019), the NID showed higher detection accuracy (mAP) with a higher image processing time (FPS). This result can be attributed to the difference in CNN architecture as Inception V2 does produce higher accuracy but is much slower than Resnet50 (Bianco et al. Citation2018; Sukegawa et al. Citation2022).
Figure 10. Detection examples from aerial images of (a) TP detections of open flowers and (b) FP from ripening fruits.
Our YOLOv5 algorithm vastly outperformed Faster R-CNN algorithms in training time (0.3 vs. 4.5–5.5 hours), mAP (mAP = 0.951 vs mAP = 0.934–0.772) and image processing (14.5 vs. 0.54 or 8.872 FPS) and was therefore used in our field validation.
Orthomosaic of field
An orthomosaic was created using 742 video frames using Pix4D software (Pix4D-SA Citation2023) with 80% overlap, synchronized with GPS coordinates (). We isolated one row comprising 57 frames () and manually counted 33 flowers for ground truth and present the results of the NID system on the orthomosaic. Overall, 90.9% of flowers were accurately detected (n = 30 of 33 in the row). Patterns of FP, TP and FN rates are consistent with NID detection on individual video frames. However, the higher FP rate could be attributed to stitching effects from the orthomosaic. Ripening or developing fruits accounted for 28.6% (n = 45) of FP detections, which is also consistent with results from individual aerial frames.
Figure 11. Orthomosaic image analysis. (a) Orthomosaic image of Quebec strawberry farm from NID field deployment. (b) Isolated crop row in the field. (c) Isolated crop row. (d) Detected flowers with YOLOv5 NID. (e) Labeled detections from YOLOv5 NID system; yellow for flowers, pink for false positives.
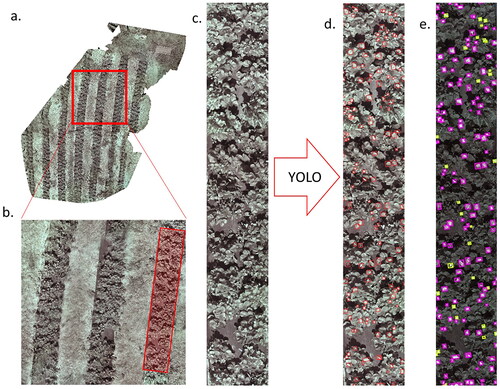
Table 5. Orthomosaic. Algorithm detection vs. ground truth.
Discussion
Farmers, like the ones from our test field, re-plant yearly for the best harvest results. A tool for flower detection would need to be robust to changing varieties and cultivars and provide consistent results. At this specific strawberry farm, farmers had randomly planted the test field with “Seascape” and “Albion” cultivars. Although we included “Seascape” in our initial training dataset, “Albion” was not. Our algorithm detected novel cultivar flowers, indicating that a limited database of strawberry cultivar flowers could be sufficient for developing remote-sensing tools with images captured with NID and would only require finite updating to accommodate new varieties to the market.
As our camera perceives the UV but not the red spectral range, ripening strawberries appear bright white in our frames. When at similar size and circularity, these fruits are mislabeled as flowers by our algorithm (). The remaining FP detections can be attributed to solar reflection on leaves, runners, and flower stocks. These are examples of the complexity of our field setting. Including null images of background foliage in initial training would also increase overall algorithm robustness. However, no FP was attributed to weed species visible within and between crop rows. These included: Fleabane, lambs’ quarter, crabgrass, purslane, and cow vetch. Some of these plants were in flower; however, the algorithm could distinguish between these and strawberry blossoms. We consider this worthy of future exploration.
Field experimentation based on our NID has yielded satisfactory results. However, there are certain limitations that will be addressed in future work. A significant limitation of this research was the aerial resolution of the flowers. Due to the downdraft effects from the rotors, we could not reduce flight altitude beyond 3 m. This leads us to reduce the initial training image resolution significantly to match the drone images. A higher resolution sensor would help detection while maintaining flight altitude and avoiding downdraft effects. Moreover, the drone was manually controlled during field experimentation. In order to optimize detection, it is preferable that the drone to deploy navigation stack generating a flight path that optimize the detection. This would require the integration of a feedback loop within the navigation stack.
Looking ahead, we aim to develop a yield estimation system using our hardware and software, based on flower or stand count. Manual flower counts are labor-intensive and prone to human error (Chen et al. Citation2019). A robotic system must first detect and localize the target flowers to automate counting. Unlike the detection and localization of ripe fruits (Chen et al. Citation2019), flower detection can direct robotic pollination efforts rather than robotic picking. Knowing flower time and location also helps farmers predict harvest time and inform fertilization and watering schedules.
Further, the UV-G-B spectrum can be pivotal in determining the plant’s growth stage. Schaefer et al. (Citation2008) explored the effects of fruit color variation as signals of dietary reward. They found that fruits rich in anthocyanins, a plant antioxidant, are black or UV reflecting and are in higher concentrations in ripe fruits. In strawberry fruits, anthocyanin concentration increases with fruit maturity (da Silva et al. Citation2007; Song et al. Citation2015). Our NID based detection system can be extended to incorporate a plant growth monitoring system.
Our design can be ordered to specification, and the sensor transmission spectra are provided upon request. Lastly, our monochrome sensor design does not allow for the contrast between Chroma channels as RGB sensors or animal eyes do. Future sensor iterations should explore removing only the red color of the Bayer filter. Using our existing camera body design, this would retain the green and blue channels and replace the red with UV. We could perform computer analysis for 3-channel images routinely, as the proportion and placement of the three channels on the sensor diode are unchanged. Thus, several enhancements to this platform can improve the overall performance of the system and can help us make significant contributions to accelerate the research in this area.
Conclusion
This paper describes the development of a cost-effective, lightweight, airborne UV-sensitive camera and its field-testing. We demonstrated its usability with two state-of-the-art object detection algorithms, showing improved results and scalability due to low system costs. Our findings highlight the UV spectrum’s value in identifying crop flowers.
Our current system, using the Spiri Mu drone, records GPS coordinates and ROS topics, paving the way for creating global field maps and directing harvest efforts. Future developments include automatic row cropping methodologies for improved object detection results.
We openly share our datasets and trained algorithms, hoping to contribute to and accelerate research in this domain. Our design, with its linear relationship between percent reflectance and pixel value, shows potential beyond agriculture, offering numerous possibilities.
Acknowledgments
We must thank Spiri Robotics for lending us a platform to conduct our field deployment. Corentin Boucher and Ryan Brown were also essential to the success of prototype adaptation and field deployment. We also thank Pr. Marcel Babin and his team at Takuvik in the University of Laval, Canada, for lending us their spectrophotometer to characterize our sensor.
Disclosure statement
No conflict of interest was reported by the author(s).
Additional information
Funding
References
- Abdulridha, J., Ampatzidis, Y., Roberts, P., and Kakarla, S.C. 2020. “Detecting powdery mildew disease in squash at different stages using UAV-based hyperspectral imaging and artificial intelligence.” Biosystems Engineering, Vol. 197: pp. 1–14. doi:10.1016/j.biosystemseng.2020.07.001.
- Antolίnez Garcίa, A., and Cάceres Campana, J.W. 2023. “Identification of pathogens in corn using near-infrared UAV imagery and deep learning.” Precision Agriculture, Vol. 24: pp. 783–806. doi:10.1007/s11119-022-09951-x.
- Arnold, S., Savolainen, V., and Chittka, L. 2008. “Fred: The floral reflectance spectra database.” Nature Precedings, pp. 1–4. doi:10.1038/npre.2008.1846.1.
- Bandara, A. M. R. R. 2011. A music keyboard with gesture controlled effects based on computer vision. Doctoral dissertation. Nugegoda, Sri Lanka: University of Sri Jayewardenepura.
- Barnard, K., and Funt, B. 2002. “Camera characterization for color research.” Color Research & Application, Vol. 27(No. 3): pp. 152–163.
- Beingessner, N., and Fletcher, A.J. 2020. ““Going local”: Farmers’ perspectives on local food systems in rural Canada.” Agriculture and Human Values, Vol. 37(No. 1): pp. 129–145. doi:10.1007/s10460-019-09975-6.
- Bianco, S., Cadene, R., Celona, L., and Napoletano, P. 2018. “Benchmark analysis of representative deep neural network architectures.” IEEE Access, Vol. 6: pp. 64270–64277. doi:10.1109/ACCESS.2018.2877890.
- Bisong, E. 2019. “Google collaboratory.” In Building Machine Learning and Deep Learning Models on Google Cloud Platform: A Comprehensive Guide for Beginners, pp. 59–64. Berkeley, CA: Apress. doi:10.1007/978-1-48424470-87.
- Briscoe, A.D., and Chittka, L. 2001. “The evolution of color vision in insects.” Annual Review of Entomology, Vol. 46(No. 1): pp. 471–510. doi:10.1146/annurev.ento.46.1.471.
- Burlayenko, O. V., and Lukianchuk, O. V. 2017. “Increasing of optical resolution of photos.” In 2017 IEEE International Young Scientists Forum on Applied Physics and Engineering (YSF), Lviv, Ukraine, pp. 120–122. IEEE, October.
- Chen, Y., Lee, W.S., Gan, H., Peres, N., Fraisse, C., Zhang, Y., and He, Y. 2019. “Strawberry yield prediction based on a deep neural network using high-resolution aerial orthoimages.” Remote Sensing, Vol. 11(No. 13): pp. 1584. doi:10.3390/rs11131584.
- Coliban, R.-M., Marincaş, M., Hatfaludi, C., and Ivanovici, M. 2020. “Linear and non-linear models for remotely-sensed hyperspectral image visualization.” Remote Sensing, Vol. 12(No. 15): pp. 2479. doi:10.3390/rs12152479.
- Corning Inc. 2022. “Corning® Gorilla® Glass Victus® 2.” Corning Gorilla® Glass, last modified March 28, 2023, https://www.corning.com/microsites/csm/gorillaglass/PI_Sheets/Gorilla_Glass_Victus_2_PI_Sheet.pdf.
- da Silva, F.L., Escribano-Bailón, M.T., Pérez Alonso, J.J., Rivas-Gonzalo, J.C., and Santos-Buelga, C. 2007. “Anthocyanin pigments in strawberry.” Lwt—Food Science and Technology, Vol. 40(No. 2): pp. 374–382. doi:10.1016/j.lwt.2005.09.018.
- Davis, J. 2018. “5 innovative industries that are growing fast.” Market Research Blog, last modified April 11, 2023, https://blog.marketresearch.com/5-innovative-industries-that-are-growing-fast.
- DJI. 2023a. “DJI Mavic 3 specs.” https://www.dji.com/ca/mavic-3/specs.
- DJI. 2023b. “DJI Phantom 4 Pro.” https://www.dji.com/ca/phantom-4-pro/info.
- Dyer, A.G., Garcia, J.E., Shrestha, M., and Lunau, K. 2015. “Seeing in colour: A hundred years of studies on bee vision since the work of the Nobel laureate Karl Von Frisch.” Proceedings of the Royal Society of Victoria, Vol. 127(No. 1): pp. 66–72. doi:10.1071/RS15006.
- Dyer, A.G., Muir, L., and Muntz, W. 2004. “A calibrated grayscale for forensic ultraviolet photography.” Journal of Forensic and Sciences, Vol. 49(No. 5): pp. JFS2003410. doi:10.1520/JFS2003410.
- Garcia, J.E., Rohr, D., and Dyer, A.G. 2013. “Trade-off between camouflage and sexual dimorphism revealed by UV digital imaging: The case of australian mallee dragons (Ctenophorus fordi).” Journal of Experimental Biology, Vol. 216: pp. 4290–4298.
- Garcia, J.E., Wilksch, P.A., Spring, G., Philp, P., and Dyer, A. 2014. “Characterization of digital cameras for reflected ultraviolet photography; implications for qualitative and quantitative image analysis during forensic examination.” Journal of Forensic Sciences, Vol. 59(No. 1): pp. 117–122. doi:10.1111/1556-4029.12274.
- Gómez-Candón, D., Virlet, N., Labbé, S., Jolivot, A., and Regnard, J.-L. 2016. “Field phenotyping of water stress at tree scale by UAV-sensed imagery: New insights for thermal acquisition and calibration.” Precision Agriculture, Vol. 17(No. 6): pp. 786–800. doi:10.1007/s11119-016-9449-6.
- Goulson, D. 2012. “Decline of bees forces China’s apple farmers to pollinate by hand.” China Dialogue, 2, 2012. GoPro. (2023), last modified 03-23-23, https://community.gopro.com/s/article/HERO9-Black-Camera-Size-and-Weight?language=en_US.
- Government of Canada. 2022a. “Greenhouse, SOD and nursery industries, 2021.” Statistics Canada, last modified March 28, 2023, https://www150.statcan.gc.ca/n1/daily-quotidien/220426/dq220426e-eng.htm.
- Government of Canada. 2022b. “Statistical overview of the Canadian fruit industry 2021.” https://agriculture.canada.ca/en/sector/horticulture/reports/statistical-overview-canadian-fruit-industry-2021#a1.4.
- Government of Saskatchewan. 2023. “Greenhouses.” Government of Saskatchewan, last modified March 28, 2023, https://www.saskatchewan.ca/business/agriculture-natural-resources-and-industry/agribusiness-farmers-and-ranchers/crops-and-irrigation/horticultural-crops/greenhouses.
- Hunt, E.R., Jr., and Daughtry, C.S. 2018. “What good are unmanned aircraft systems for agricultural remote sensing and precision agriculture?” International Journal of Remote Sensing, Vol. 39(No. 15-16): pp. 5345–5376. (doi:10.1080/01431161.2017.1410300.
- Immaneni, A., and Chang, Y. K. 2022. Real-time counting of strawberry using cost-effective embedded gpu and yolov4-tiny. In 2022 ASABE Annual International Meeting, Houston, Texas, p. 1.
- James, R., and Pitts-Singer, T. L. 2008. Bee Pollination in Agricultural Ecosystems. New York: Oxford University Press. doi:10.1093/acprof:oso/9780195316957.001.0001.
- Jocher, G., Stoken, A., Borovec, J., Changyu, L., and Hogan, A. 2020. “ultralytics/yolov5: v3. 1-bug fixes and performance improvements.” Zenodo. doi:10.5281/zenodo.4154370.
- Kim, J., Kim, S., Ju, C., and Son, H.I. 2019. “Unmanned aerial vehicles in agriculture: A review of perspective of platform, control, and applications.” IEEE Access, Vol. 7: pp. 105100–105115. doi:10.1109/ACCESS.2019.2932119.
- LDP LLC—MAXMAX. 2022a. “IR filters,” last modified March 28, 2023, https://www.maxmax.com/filters.
- LDP LLC—MAXMAX. 2022b. “Maxmax monochrome camera module.” https://maxmax.com/shopper/product/15991-xniteusb8m-m-usb-2-0-8megapixel-monchrome-camera-mod.
- Lin, T.-Y., Maire, M., Belongie, S., Hays, J., Perona, P., Ramanan, D., Dollár, P., and Zitnick, C. L. 2014. “Microsoft COCO: Common objects in context.” In Computer Vision – ECCV 2014. ECCV 2014. Lecture Notes in Computer Science, edited by D. Fleet, T. Pajdla, B. Schiele, T. Tuytelaars, Vol. 8693. Cham: Springer. doi:10.1007/978-3-319-10602-1_48.
- Lopez-Ruiz, N., Granados-Ortega, F., Carvajal, M.A., and Martinez-Olmos, A. 2017. “Portable multispectral imaging system based on Raspberry Pi.” Sensor Review, Vol. 37(No. 3): pp. 322–329. doi:10.1108/SR-12-2016-0276.
- Mahendrakar, T., Ekblad, A., Fischer, N., White, R., Wilde, M., Kish, B., and Silver, I. 2022. Performance study of YOLOV5 and faster r-CNN for autonomous navigation around non-cooperative targets. IEEE Aerospace Conference, Big Sky, MT, USA, pp. 1–12.
- Mulla, D.J. 2013. “Twenty five years of remote sensing in precision agriculture: Key advances and remaining knowledge gaps.” Biosystems Engineering, Vol. 114(No. 4): pp. 358–371. doi:10.1016/j.biosystemseng.2012.08.009.
- Nieto, D., Vara, G., Diez, J.A., O’Connor, G.M., Arines, J., Gómez-Reino, C., and Flores-Arias, M.T. 2012. “Laser-based microstructuring of surfaces using low-cost microlens arrays.” Journal of Micro/Nanolithography, MEMS, and MOEMS, Vol. 11(No. 2): pp. 023014. doi:10.1117/1.JMM.11.2.023014.
- Pallottino, F., Antonucci, F., Costa, C., Bisaglia, C., Figorilli, S., and Menesatti, P. 2019. “Optoelectronic proximal sensing vehicle-mounted technologies in precision agriculture: A review.” Computers and Electronics in Agriculture, Vol. 162: pp. 859–873. doi:10.1016/j.compag.2019.05.034.
- Palum, R. 2001. “Image sampling with the bayer colour filter array.” In PICS, pp. 239–245.
- Pix4D-SA. 2023. “Pix4D.” https://www.pix4d.com/industry/agriculture/.
- Präzisions Glas & Optik. 2023. “Optical transmission* of Schott WG225, WG280, WG295, WG305 and WG320. SCHOTT WG225, WG280, WG295, WG305, WG320, transmission,” last modified March 28, 2023, https://www.pgo-online.com/intl/curves/optical_glassfilters/WG225_WG280_WG295_305_320.html.
- Purcell, C. R. 2000. Remote Sensing Image Performance Metrics: Comparing Ground Sample Distance and the National Imagery Interpretability Rating Scale. Long Beach: California State University.
- Ren, S., He, K., Girshick, R., and Sun, J. 2015. “Faster R-CNN: Towards real-time object detection with region proposal networks.” In Advances in Neural Information Processing Systems, edited by C. Cortes and N. Lawrence and D. Lee and M. Sugiyama and R. Garnett, Vol. 28: p. 28. Curran Associates, Inc.
- Roboflow, Inc. 2022. “Explore the Roboflow Universe. The world’s largest collection of open source computer vision datasets and APIs.” Roboflow, last modified April 12, 2023, https://universe.roboflow.com/.
- Sankaran, S., Khot, L.R., Espinoza, C.Z., Jarolmasjed, S., Sathuvalli, V.R., Vandemark, G.J., Miklas, P.N., et al. 2015. “Low-altitude, high-resolution aerial imaging systems for row and field crop phenotyping: A review.” European Journal of Agronomy, Vol. 70: pp. 112–123. doi:10.1016/j.eja.2015.07.004.
- Schaefer, H.M., McGraw, K., and Catoni, C. 2008. “Birds use fruit colour as honest signal of dietary antioxidant rewards.” Functional Ecology, Vol. 22(No. 2): pp. 303–310. doi:10.1111/j.1365-2435.2007.01363.x.
- Schott AG. 2023. “N-WG280.” https://schott.com/shop/advanced-optics/en/Matt-Filter-Plates/N-WG2N-WG28080/c/glass-N-WG280
- Shakhatreh, H., Sawalmeh, A.H., Al-Fuqaha, A., Dou, Z., Almaita, E., Khalil, I., Othman, N.S., Khreishah, A., and Guizani, M. 2019. “Unmanned aerial vehicles (UAVs): A survey on civil applications and key research challenges.” IEEE Access, Vol. 7: pp. 48572–48634. doi:10.1109/ACCESS.2019.2909530.
- Song, J., Du, L., Li, L., Kalt, W., Palmer, L.C., Fillmore, S., Zhang, Y., Zhang, Z., and Li, X. 2015. “Quantitative changes in proteins responsible for flavonoid and anthocyanin biosynthesis in strawberry fruit at different ripening stages: A targeted quantitative proteomic investigation employing multiple reaction monitoring.” Journal of Proteomics, Vol. 122: pp. 1–10. doi:10.1016/j.jprot.2015.03.017.
- Spiri Robotics LLC. 2023. “Spiri Mu.” https://spirirobotics.com/products/spiri-mu/.
- Sukegawa, S., Tanaka, F., Hara, T., Yoshii, K., Yamashita, K., Nakano, K., Takabatake, K., Kawai, H., Nagatsuka, H., and Furuki, Y. 2022. “Deep learning model for analyzing the relationship between mandibular third molar and inferior alveolar nerve in panoramic radiography.” Scientific Reports, Vol. 12(No. 1): pp. 16925. doi:10.1038/s41598-022-21408-9.
- Statistics Canada. 2022. “Strawberry fields forever?” Government of Canada. https://www.statcan.gc.ca/o1/en/plus/1300-strawberry-fields-forever.
- Strawberry plants LLC. 2022. “Recommended strawberry varieties for Canada.” https://strawberryplants.org/recommended-strawberry-varieties-for-canada/#QC.
- Stuart, M.B., McGonigle, A.J., and Willmott, J.R. 2019. “Hyperspectral imaging in environmental monitoring: A review of recent developments and technological advances in compact field-deployable systems.” Sensors, Vol. 19(No. 14): pp. 3071. doi:10.3390/s19143071.
- Taguchi, H., and Enokido, M. 2017. “Technology of color filter materials for image sensor.” Red, Vol. 10502(No. 8892): pp. 3216.
- Tian, M., and Liao, Z. 2021. “Research on flower image classification method based on YOLOv5.” Journal of Physics: Conference Series, Vol. 2024(No. 1): pp. 012022. doi:10.1088/1742-6596/2024/1/012022.
- Tsouros, D.C., Bibi, S., and Sarigiannidis, P.G. 2019. “A review on uav-based applications for precision agriculture.” Information, Vol. 10(No. 11): pp. 349. doi:10.3390/info10110349.
- Ulizio, M. 2015. “Optical properties of glass: How light and glass interact.” https://www.koppglass.com/blog/optical-properties-glass-how-light-and-glass-interact.
- Vanbrabant, Y., Delalieux, S., Tits, L., Pauly, K., Vandermaesen, J., and Somers, B. 2020. “Pear flower cluster quantification using RGB drone imagery.” Agronomy, Vol. 10(No. 3): pp. 407. doi:10.3390/agronomy10030407.
- Veseys. 2022. Strawberries From Seed. https://www.veseys.com/ca/vegetables/strawberries-from-seed.html
- Wen, B. J. 2016. Reflectance standards. In Encyclopedia of Color Science and Technology, edited by M.R. Luo. New York, NY: Springer. doi:10.1007/978-1-4419-8071-7_360.
- Zhou, Z., Majeed, Y., Naranjo, G.D., and Gambacorta, E.M. 2021. “Assessment for crop water stress with infrared thermal imagery in precision agriculture: A review and future prospects for deep learning applications.” Computers and Electronics in Agriculture, Vol. 182: pp. 106019. doi:10.1016/j.compag.2021.106019.