
 ?Mathematical formulae have been encoded as MathML and are displayed in this HTML version using MathJax in order to improve their display. Uncheck the box to turn MathJax off. This feature requires Javascript. Click on a formula to zoom.
Abstract
Background
Probabilistic graphical modelling (PGM) can be used to predict risk at the individual patient level and show multiple outcomes and exposures in a single model.
Objective
To develop PGM for the prediction of clinical outcome in patients with degenerative cervical myelopathy (DCM) after posterior decompression and to use PGM to identify causal predictors of the outcome.
Methods
We included data from 59 patients who had undergone cervical posterior decompression for DCM. The candidate predictive parameters were age, sex, body mass index, trauma history, symptom duration, preoperative and last Japanese Orthopaedic Association (JOA) scores, gait impairment, claudication, bladder dysfunction, Nurick grade, American Spinal Injury Association (ASIA) grade, smoking, diabetes mellitus, cardiopulmonary disorders, hypertension, stroke, Parkinson’s disease, dementia, psychiatric disorders, arthritis, ossification of the posterior longitudinal ligament, cord signal change, postoperative kyphosis and the cord compression ratio.
Results
In regression analyses, preoperative JOA (PreJOA) score, presence of a psychiatric disorder, and ASIA grade were identified as significant factors associated with the last JOS score. Dementia, sex, PreJOA score and gait impairment were causal factors in the PGM. Sex, dementia and PreJOA score were direct causal factors related to the last follow-up JOA (LastJOA) score. Being female, having dementia, and having a low PreJOA score were significantly related to having a low LastJOA score.
Conclusions
The causal predictors of surgical outcome for DCM were sex, dementia and PreJOA score. Therefore, PGM may be a useful personalized medicine tool for predicting the outcome of patients with DCM.
KEY MESSAGES
Sex, dementia and preoperative neurological status are causal factors contributing to the postoperative outcome of patients with degenerative cervical myelopathy.
The Bayesian network (BN) structure may be useful for predicting the probability for clinical outcomes for each patient who undergoes posterior decompressive surgery.
The BN structure may provide a useful model in the current era of personalized medicine.
Introduction
Degenerative cervical myelopathy (DCM) is a common degenerative spine disorder that can cause spinal cord dysfunction [Citation1]. However, whether decompressive surgery should be performed in patients with mild symptoms related to DCM remains controversial [Citation2,Citation3]. The natural history of DCM shows that the symptoms of myelopathy worsen over time without surgical treatment in 20–60% of patients [Citation4,Citation5]. Some studies have reported that the surgery can arrest the natural history of DCM and disease progression and prevent further neurological decline [Citation6,Citation7].
To address the limitations of surgical decompression, researchers have studied the key factors that predict the surgical outcome of patients with DCM. The independent factors identified as predictors include age, Japanese Orthopaedic Association (JOA) score, Nurick grade, impaired gait, duration of symptoms, diabetes, psychiatric comorbidities, sex, smoking, changes in T1-weighted MRI (T1MRI) images, and the compression ratio of the spinal cord [Citation1,Citation8–12]. It remains unclear which patients will experience meaningful improvement after surgical decompression, and as such, it is a challenge for spine surgeons to predict who is likely to benefit the most from surgical decompression.
To identify statistically meaningful predictive factors from previous studies, multivariate logistic regression analyses have been conducted to strengthen the results of univariate analyses [Citation13]. Although predictive factors may correlate significantly with other factors, logistic regression analyses show only parallel relationships between factors and cannot identify causal interactions [Citation14]. In addition, each outcome of interest should be trained using its individual model [Citation15]. It is difficult to obtain sufficient data for thorough statistical analysis, and the treatment guidelines for some types of diseases are not universally accepted or may change rapidly (e.g. malignant or rare diseases) [Citation15]. Surgeons sometimes ask for expert opinion in difficult cases. It would be helpful to have a prediction tool to overcome obstacles such as incomplete, insufficient or missing data, and to identify causal relationships between factors. Such a prediction tool may help in the treatment of DCM by improving the probability of a successful treatment outcome.
Given the limitations of the regression-based approach, it may not be suitable for risk prediction for individual patients using what-if scenarios and effect-to-cause reasoning in the era of precision and personalized medicine [Citation16]. Using machine learning algorithms, Bayesian networks (BNs) can be used to identify casual relationships between variables and show predictive inference using probabilistic graphical modelling (PGM) [Citation17]. PGM using BNs can be used to predict risk at the individual patient level and show multiple outcomes and exposures in a single model [Citation15]. Several recent articles have described the use of BNs in medical prediction models [Citation15,Citation18].
In this study, we applied BNs to facilitate understanding of the interactions between surgical outcome for DCM and clinical factors associated with the clinical outcome after posterior decompressive surgery. We hoped to show that PGM using BNs provides a way to predict the clinical outcome of DCM after posterior decompression and help the spine surgeon make decisions about the surgical treatment of patients with DCM.
Methods
Data collection
After receiving approval from our Clinical Research Ethics Board (no. 20200330/30-2020-20/043), the medical records of 59 consecutive patients who underwent posterior decompressive surgery (laminectomy or laminoplasty) at our hospital between 2012 and 2016 were reviewed retrospectively. The patients were diagnosed with DCM on the basis of their clinical signs and symptoms of cervical myelopathy and concordant MRI findings of cervical cord compression with or without signal changes because of spondylosis. As posterior decompressive surgery alone is contraindicated for patients with cervical kyphosis and significant anterior cord compression, these patients were excluded. The 59 patients underwent posterior decompressive surgery with a minimum follow-up of 12 months. No patients had demyelinating disease, tumours, previous cervical surgery or intradural pathology. The number of compressed and decompressed levels in the cervical surgery was 3.47 ± 1.16 and 3.51 ± 1.02, respectively. The cervical 3–4–5–6 segment was the most frequently compressed level (28.8%, 17/59), and the cervical 4–5–6 or 3–4–5–6 segment was the most frequently decompressed level in the posterior decompression surgery (22.2%, 13/59).
The following 25 variables were assessed: last follow-up JOA (LastJOA) score, sex, age, body mass index (BMI), cervical trauma history, smoking, diabetes mellitus (DM), hypertension, arthritis, psychiatric disorder, stroke, Parkinson’s disease, dementia, cardiopulmonary disease, ossification of the posterior longitudinal ligament (OPLL), claudication, gait disturbance, bladder dysfunction, symptom duration before surgery, preoperative JOA (PreJOA) score, American Spinal Injury Association (ASIA) grade, Nurick grade, cervical cord signal changes in T1MRI images, postoperative kyphosis (PostKyphosis) identified in a postoperative X-ray, and the cord compression ratio observed in the preoperative cervical MRI scan (CR) [Citation7]. The CR was calculated by dividing the sagittal diameter by the transverse diameter of the spinal cord at the most compressed level [Citation7]. A smaller CR value indicated greater cervical compression. Twenty-three of the 25 variables, excluding LastJOA and PostKyphosis, were evaluated preoperatively. Thirteen of these variables are known as clinical risk factors associated with surgical outcome in patients with DCM: T1MRI, claudication, arthritis, cardiopulmonary disease, psychiatric disorder, symptom duration, gait impairment, bladder function, PostKyphosis, smoking, age, PreJOA and CR [Citation1,Citation10,Citation11,Citation19].
We conducted statistical analysis to identify factors significantly associated with the LastJOA and compared the factors identified in the PGM using BN analysis of the 25 variables for the 59 patients enrolled in the present study.
Statistical analysis
To identify factors associated with the LastJOA, we selected meaningful variables using least absolute shrinkage and selection operator (LASSO) analysis. We then used multivariable logistic regression with backward elimination for the variables with >80% selection rates in the LASSO analysis. All statistical analyses were performed using IBM SPSS Statistics (version 26; IBM Corp., Armonk, NY).
BN analysis
After collecting the clinical data for the 59 enrolled patients, we performed data mining using data discretization, followed by learning the BN structure, and then the parameters. We next enhanced the causality in the last BN using an order-based algorithm, validated the final model to determine how well it fit the data, and then compared the model with the current knowledge and results of the statistical analysis. We describe each step in detail in the following sections.
Data mining
The 25 variables had continuous, discrete or ordinal values. The continuous or discrete numeric values were transformed into z-scores, and the transformed z-values were discretized. Discretized values less than −1 (z < −1), between −1 and 1 (–1 ≤ z ≤ 1), and more than 1 (z > 1) were defined as 0, low expression; 1, normal expression; and 2, high expression, respectively [Citation20]. Age <50, and 50–75, and >75 years were expressed as 0, 1 and 2, respectively. For BMI, the values for less than normal, normal and above normal were expressed as 0, 1 and 2, respectively. The normal ranges of the variables refer to those published and the criteria defined by the U.S. National Institutes of Health (nih.gov) [Citation21]. The nominal categorical variables, such as trauma history, smoking, bladder dysfunction, sex, gait impairment, PostKyphosis, T1MRI, OPLL and variables associated with comorbidity, were transformed into 0 (representing ‘no’ or female) or 1 (representing ‘yes’ or male). To learn the BNs, we used BN inference with Java Objects (BANJO), which is a computational modelling tool based on a data-driven method using BN frameworks to obtain a directed inference network [Citation20].
Learning the BN structure
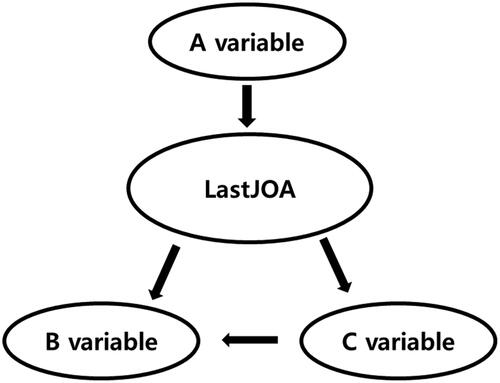
An example BN structure is shown in . The BN structure is represented as a directed acyclic graph comprising nodes and intervening arrows. In this structure, the A variable influences the likelihood of the influence of the LastJOA on the B and C variables. The conditional independence between nodes shows the probability that expression of the B or C variable is not influenced by the A variable given in the LastJOA. The first-degree Markov blanket (MB) of a variable X in the BN (denoted as MB [X]) is defined as the set of variables that are a direct cause (parents) of X and direct effects (children) of X (X itself is excluded from MB [X]). The second-degree MB of X, third-degree MB of X, etc., were defined as MB (MB [X]), MB (MB [MB (X)]), etc., respectively [Citation20]. In , the first-degree MB of B variable, MB (B variable), is the LastJOA and C variable, and the second-degree of MB of B variable is the LastJOA and A and C variables.
Figure 1. An example of the Bayesian network structure. Variable A influences the likelihood of the LastJOA, which influences variables B and C. The conditional independence between nodes shows the probability that the expression of variables B and C is not influenced by variable A given the information for the LastJOA. LastJOA: last follow-up Japanese Orthopaedic Association score.
We ran 12 independent runs to learn the BNs (three independent runs for 3, 6, 12 and 24 h; a total of 135 h) using the dataset D1. From the 12 best log-likelihood structures reported for each run, we selected the network with the highest log-likelihood (denoted as S1; note that S1 includes 25 variables, each of which represents clinical information). In S1, we identified the variables within the second-degree MB of the LastJOA. From dataset D1, we created a new dataset using the variables within the second-degree MB of the LastJOA (denoted as D2).
We again learned BNs using D2 [Citation20]. This second BN learning using D2 was performed in the same way as the BN using D1. Among the 12 best log-likelihood structures reported for each independent run, we selected the network with the highest log-likelihood (denoted as S2). We then selected the variables within the first-degree MB of LastJOA in S2. From dataset D2, we created a new dataset with the variables within the first-degree MB of the bridging bone formation variables (denoted as D3). We again learned BNs using D3. This third BN learning using D3 was performed the same way as that for the BNs using D1 and D2. Among the 12 best log-likelihood structures reported for each independent run, we finally selected the network with the highest log-likelihood (denoted as S3).
Enrichment analysis to identify causal relationships
An alternative way of searching through variable orders in BNs has been suggested when trying to identify the best-fitting BN; for example, if variable A is an indirect cause of variable B, then A is said to be of a higher order than B. We ran an order search, which we denoted as the Order algorithm, by setting the maximum number of parents as five without any prior knowledge given. Setting >99% probable orders for each order, we found >99% probable structures using D3 [Citation22]. We then compared the result with the BN (S3) learned earlier. We ran three independent runs of the Order algorithm (three independent runs at 4, 24 and 48 h; a total of 76 h). The order with the best log-likelihood (denoted as Od) compared a group of structures that included one with the best log-likelihood score. Finally, we chose the structure with the best log-likelihood (denoted as Sod) using a structure code. After comparing the log-likelihood score between S3 and Sod, we chose the final structure (Sf) with the highest log-likelihood score. As the Order algorithm summarized all plausible BNs, it provided better information to realize a mechanistic understanding underlying the interactions between clinical variables in the LastJOA.
Learning Bayesian parameters
From the final highest log-likelihood BNs (the final structure, Sf), we learned parameters (conditional probabilities) using D3. We also investigated the relationships between variables and the influence of the LastJOA on the expression of other variables in the BN structure. The BN graphical network interface (GeNIe; BN Graphical Network Interface; version 2.2.1, BayesFusion, Pittsburgh, PA) was used to learn the parameters.
Validation
We validated the final BN structure by evaluating the accuracy of the final BN using the leave-one-out-cross-validation (LOOCV) method and the area under the curve (AUC).
Results
The average age and follow-up duration of the patients whose data were included were 65 ± 1.7 years and 33 ± 13.8 months, respectively, and 30.5% (n = 18) were women. The mean pre- and postoperative JOA scores were 9 ± 3.4 and 12 ± 3.2, respectively. The surgical treatment seemed to be effective in these patients with DCM. The values for the PreJOA were discretized as <6 (z < −1), 6–12 (–1 ≤ z ≤ 1) and >12 (z > 1), and were defined as 0 (low score), 1 (normal) and 2 (high score), respectively. The LastJOA was defined as 0 (JOA score <9), 1 (9 ≤ JOA score ≤15) and 2 (JOA score >15). Before surgery, 36 (68%) patents had gait disturbance and 17 (28%) had bladder symptoms. ASIA grades D and E were observed in 30 and 6 patients, respectively. Hypertension and OPLL were found in 54% and 52% of all patients, respectively. Fewer than one-third of the 59 patients had a comorbidity such as DM, psychiatric disease, stroke, arthritis cardiopulmonary disease, Parkinson’s disease or dementia ().
Table 1. Patient characteristics.
The LASSO analysis identified selection rates >80% for the PreJOA, ASIA grade and psychiatric disorders as 97.8%, 88.0% and 83.0%, respectively. Therefore, we included these three variables in the multiple linear regression, which showed that all were significantly related to the LastJOA (p < .0001, .0020 and .0291, respectively) ().
Table 2. Multiple linear regression analysis of three factors.
BN analysis
We report the three BN structures (S1, S2 and S3), and Sod, and the final structure (Sf) chosen along with the results of the validation of Sf.
BN with all variables
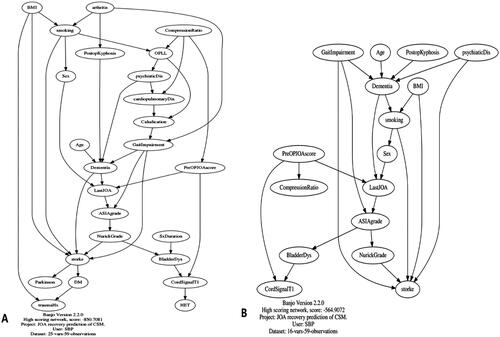
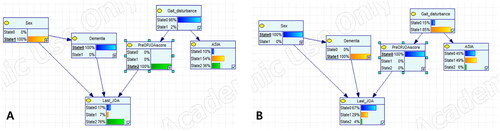
Among the 12 BNs, the one with the best log-likelihood score showed a significantly better data fit than the second-best BN (viz., , where S1 and S’ are the first- and second-best BNs, respectively, with 25 variables, and D1 is the dataset with the same number of variables with 59 patients. In the follow-up BN learning comprising the 12 BNs, one BN (S1) with 25 variables showed a significantly better fit (>99.999%) than the second-best BN. Sex, dementia, psychiatric disorders and the PreJOA were the direct plausible cause (parents) of the LastJOA, and the ASIA grade was the plausible effect of the LastJOA. Gait impairment was the direct cause (coparent node for the LastJOA) for the ASIA grade (). Subsequently, 16 variables within the second-degree MB of the LastJOA in the first BN (S1) were selected in the second BANJO analysis. The second BN (S2) that best fit the datasets with 16 variables and 59 patients is shown in . The parent variables of the LastJOA in the second BN (S2) were the same as those in the first BN (S1) except for psychiatric disease.
Figure 2. First and second Bayesian networks (BNs) relevant to the LastJOA. Panel A shows the first BN with 25 variables. Sex, dementia and PreJOA are the parent variables of the LastJOA, and the ASIA grade is only child variable of the LastJOA. Panel B shows that the second BN comprises 16 variables that are within the second-degree Markov blanket of the LastJOA variable in the first BN. In the second BN, the parent variables of LastJOA are sex, dementia and PreJOA, and the child variable is ASIA grade. The Bayesian network inference with Java Objects (BANJO) scores were –850.7081 and –564.9072 for the first and second BNs, respectively. ASIA: American Spinal Injury Association; BMI: body mass index; BN: Bayesian network; DM: diabetes mellitus; LastJOA: last follow-up Japanese Orthopaedic Association score; PreJOA: preoperative Japanese Orthopaedic Association score; OPLL: ossification of posterior longitudinal ligament.
In the third BANJO analysis, five variables within the first-degree MB of the LastJOA in S2 were selected. The 12 BNs in the third BANJO analysis had the same log-likelihood score (–222.6719) and structure. The final BN (S3) obtained after the third BANJO analysis is shown in . In S3, dementia, sex and the PreJOA score were plausible direct causes (parents) of the LastJOA.
Figure 3. Bayesian network via Bayesian network inference with Java Objects (BANJO) analysis (A) and Order algorithm and structural code (B) with variables relevant to the LastJOA. The connection between variables and the direction of the arrow between them are similar in the two structures. The log-likelihood score in the Order algorithm and structure code was superior to that in the last BANJO analysis (–214.384 vs. –222.6719). ASIA: American Spinal Injury Association; LastJOA: last follow-up Japanese Orthopaedic Association score; PreJOA: preoperative Japanese Orthopaedic Association score.
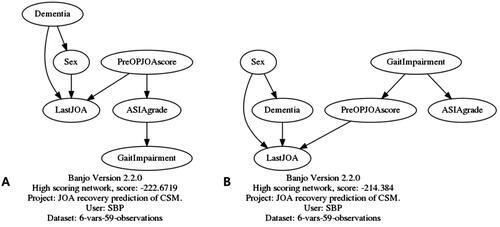
As the Order algorithm summarizes the significantly causal BN structures identified, the most likely summarized structure () shows a similar structure as that for S3. The Order algorithm yielded the following order as the most probable: gait impairment: PreJOA, sex, psychiatric disease, ASIA grade and LastJOA. However, the likelihood score of Sod was superior to that for S3, which suggests that Sod reflected the relationship and causality between LastJOA and other variables in the current data better than S3. Therefore, Sod was selected as the final BN structure (Sf). In Sf (), sex, dementia and PreJOA nodes were direct parents of the LastJOA node. Although gait impairment and ASIA grade correlated with the LastJOA, if the PreJOA was conditioned (‘if we knew the PreJOA of the selected patient’), the information for gait impairment and ASIA grade for the patient did not influence the LastJOA. Sex was a direct parent of both dementia and the LastJOA nodes simultaneously.
Learning causal BN parameters
The parameters (probabilities) of the final BN (Sf) with six variables were learned from a new dataset containing six variables and 59 patients (denoted as D3) that had been extracted from dataset D1 containing the 25 variables from all of the 59 patients included (). Changing the LastJOA conditioned as state 0 to state 2 increased the probabilities of state 2 in the PreJOA of not having dementia and being male (). Sex and the PreJOA were direct parent (causal) variables for the LastJOA. Conditioning the sex variable from state 0 (female) to state 1 (male) decreased the probability of state 0 and increased the probability of state 2 in the LastJOA (). Men with a high PreJOA had a higher probability of a high LastJOA than did women with same preoperative state (74% vs. 2%, respectively). This suggests that men with DCM may have a higher probability of a good outcome after posterior decompressive surgery than women with DCM. Changing the PreJOA from state 0 to 2 increased the probability of state 2 in the LastJOA (). Patients with a high PreJOA had a better outcome after the surgical treatment compared with those with a low PreJOA. Dementia seemed to predict a poor outcome as indicated by the LastJOA (). With dementia conditioned as state 1, a change in PreJOA did not influence the LastJOA (). These findings suggest that a 76% probability of the LastJOA can be expected in men with DCM without dementia and a PreJOA >12 (). By contrast, the probability of state 1 or 2 was estimated as 31% for the LastJOA ().
Figure 4. Final Bayesian network structure and different conditions for the LastJOA obtained using GeNIe. Panel A shows the Bayesian structure learned with the existing dataset using GeNIe. State 0 and 1 in the Gait_disturbance, dementia and sex nodes represent the probability of the occurrence of that comorbidity for the first two variables or male. States 0, 1 and 2 in the other nodes represent the discretized values of 0, 1 and 2, respectively. Panels B and C show that the change in the states in other variables after the LastJOA was conditioned as state 0 or 2. ASIA: American Spinal Injury Association; LastJOA: last follow-up Japanese Orthopaedic Association score; PreJOA: preoperative Japanese Orthopaedic Association score.
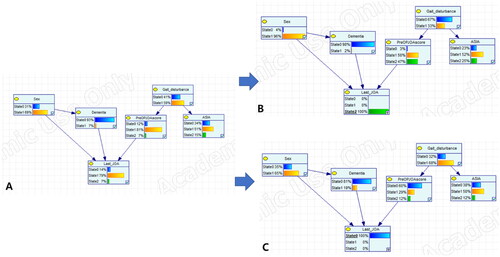
Figure 5. Bayesian network structures according to different conditions of sex and PreJOA. The figure shows the change in probability of the LastJOA in the different conditions according to the probabilities of sex (A, B) and the PreJOA (C, D). ASIA: American Spinal Injury Association; LastJOA: last follow-up Japanese Orthopaedic Association score; PreJOA: preoperative Japanese Orthopaedic Association score.
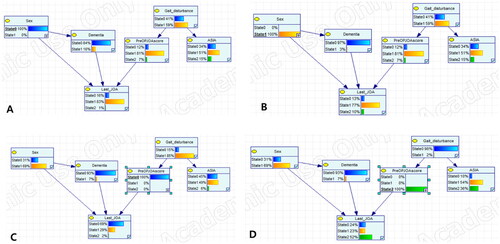
Figure 6. Bayesian network structures according to different conditions for the dementia node formation. Panels A and B show the change in probability of the LastJOA in the different conditions for the probability of dementia. Panels C and D show the change in probability for the LastJOA for the different conditions according to the probabilities of dementia and conditioned dementia, simultaneously. ASIA: American Spinal Injury Association; LastJOA: last follow-up Japanese Orthopaedic Association score; PreJOA: preoperative Japanese Orthopaedic Association score.
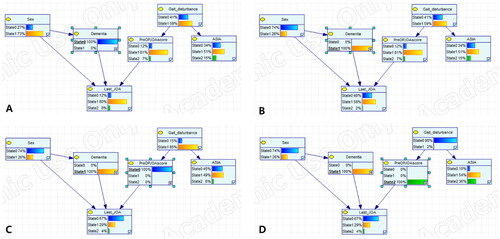
Figure 7. Bayesian network structures under different conditions of sex, dementia and PreJOA, simultaneously. The figure shows the best (A) and worst (B) combinations of parent nodes for the LastJOA node in the Bayesian network structures. ASIA: American Spinal Injury Association; LastJOA: last follow-up Japanese Orthopaedic Association score; PreJOA: preoperative Japanese Orthopaedic Association score.
Validation
We used LOOCV to evaluate the prediction accuracy of the final BN parameterized by D3. This analysis produced a value of 72.6% for correct predictions (257/354 for 6 × 59 cases). Using only direct causes (parents) of the LastJOA in the BN (i.e. 3/6 variables), the prediction accuracy was 81.4% (192/236 correct predictions for 4 × 29 cases). For only the LastJOA, the prediction accuracy was 93.2% (55/59 correct predictions for 1 × 59 cases). The AUCs for predicting state 0, 1 and 2 for the LastJOA were 0.96, 0.85 and 0.79 in the final BN, respectively.
Discussion
The final BN showed that, among the 24 factors used in the analysis, sex, dementia, the PreJOA and gait impairment were causal factors associated with the LastJOA. ASIA grade was related to the LastJOA and was a child node of gait impairment. Although the final BN showed that dementia, sex, the PreJOA, ASIA grade and gait impairment were more strongly related to the LastJOA than the other 19 factors, sex, dementia and the PreJOA were direct causal factors for the LastJOA. In the multivariate analysis, the PreJOA, ASIA grade and psychiatric disorder were significant predictors of the LastJOA. The JOA scores were transformed into z-scores and discretized as 0, 1 and 2 according to z-values as follows: less than −1 (z ≤ −1), between −1 and 1 (–1 ≤ z ≤ 1) and more than 1 (z ≥ 1). The mean values and distribution of JOA scores differed between the pre- and postoperative periods. Therefore, the JOA scores in the two periods were discretized differently.
Having a psychiatric disorder was also a parent node of dementia in S2. Including clinical information about comorbidity in patients with dementia showed that having a psychiatric disorder did not influence the LastJOA (). Therefore, the comorbidity of having a psychiatric disorder was not included as a variable in the final BN analysis. The final BN structure reflected the statistical relationships between the LastJOA and three variables: the PreJOA, ASIA grade, and having a psychiatric disorder.
The patients with low PreJOA and LastJOA scores and the other patients with high PreJOA and LastJOA scores may have had a similar recovery ratio or degree of improvement. However, these patients had different LastJOA scores. Despite the differences in LastJOA scores, the associations between the recovery ratio and factors in patients with these two different conditions suggest that these may be considered as the same condition in the Bayesian analysis. Therefore, we evaluated the associations between the LastJOA score and other factors in the BNs.
Having a psychiatric comorbidity, sex, PreJOA, ASIA grade and gait impairment are significant factors related to surgical outcome [Citation10–12]. Depression and bipolar disorder are significantly associated with the clinical outcome assessed by the JOA score [Citation11]. Although no study has reported statistical associations between dementia and surgical outcomes of patients with DCM, having dementia may influence cervical stenosis [Citation23]. As only four of the 59 patients had dementia in the present study, dementia seemed not to be a significant variable in the statistical analysis. The first and second BN structures considered 25 and 16 variables simultaneously, respectively, and showed that dementia was a direct parent node and having a psychiatric disorder was a parent node only of the LastJOA. In the present study, the final BN structure showed that the LastJOA was significantly related to three direct causal factors: sex, having dementia and the PreJOA (). Sex was a meaningful factor related to the outcome in the present study. Another study reported that gender was a significant predictor of higher spinal cord dynamics and differences in DCM [Citation24]. The higher spinal cord dynamics in men may be a contributor to the outcome of DCM in the present study. As a predictive model, BNs may provide personalized prediction by predicting the probability of the target outcome according to the change in each factor for each patient.
Although the amount of clinical data available is increasing and becoming more complex, data to explain differences in phenotype are incomplete in the medical field, and there will always be uncertainty when analysing data. It is difficult to use only logistic regression analysis to describe correlations because of the inability to identify causal relationships between predictors. Therefore, BN analysis, which is graphic and intuitive to the clinician, may help identify layered and causal correlations between predictors more clearly than a graphical model [Citation13,Citation20]. The BN structure, which can show the entire network between variables, may be helpful for identifying the organic relationships with a target variable, the important factors to focus on, and the best ways to improve the clinical outcome. BNs and their associated methods are especially suited for reasoning with uncertainty [Citation25]. Our model allows one to understand intuitively the causal correlations between the factors in the final BN (Sf) of the present study.
Although the present study showed an advantage of BN over conventional analysis, several limitations should be noted. First, we attempted to identify 24 factors that were as closely related to the LastJOA as possible. However, only 59 patients had no missing data, and the number of patients with a full dataset was too small to create a complete predictive model. Our hospital is a public hospital visited by many patients under Medicaid support. Therefore, among the patients with DCM visiting our hospital, not a few patients with severe DCM visit our emergency room after minor trauma, such as falling out of bed or down the stairs. The present study included patients with DCM after minor trauma. Although none of the patients had spinal instability for fusion surgery after minor trauma, the heterogeneity of the patients enrolled in the present study may be a source of bias. We are planning a future study using multicentre clinical data, including MRI findings, PostJOA scores, and laboratory and other findings.
The second limitation of our study is that we used the ASIA grade as a factor related to outcome. The ASIA grade should be used for patients with traumatic spinal cord injury, and the JOA score for those with DCM without traumatic spinal cord injury. It may not be adequate to evaluate the status of patients with DCM using a simple classifier such as the ASIA grade. We used the ASIA grade to determine whether a simple classifier would be meaningful in our outcome predication model. In the present study, although the ASIA grade may have been statistically related to gait disturbance or the PreJOA score, it may not have been a meaningful factor in the outcome prediction model. Third, although the mean follow-up time was 33 months, the LastJOA was obtained at a different time. In a future study, increasing the number of enrolled patients will allow us to apply the BN model for each year of follow-up.
The fourth limitation is that a previous study reported that impairment related to DCM increases in patients with T2WI hyperintensity and T1WI hypointensity [Citation26]. The imaging status such as severity of the T1 and T2 signal changes in the cervical cord on MRI was not considered in the present study. Adding this imaging variable analysed by convolutional neural networks may help improve the BN model’s predictive ability. Finally, clinicians cannot easily use the graphical models in the real field, so there is a need for future studies to make graphical models that clinicians can use easily in their clinical field.
The predictive model used in the present study may be controversial from the viewpoint of confidence. However, other statistical analyses and predictive models with same number of patients and factors have not provided greater accuracy or better intuitive results than the final BN. By using information such as sex, dementia and the PreJOA, the final BN may be helpful for anticipating the probability of the LastJOA after posterior decompressive surgery for each patient with DCM. Therefore, the prediction of poor status according to the LastJOA score after surgery using the final BN may be helpful for explaining this possibility to patients and their family, and for planning more aggressive postoperative care in terms of rehabilitation after surgery.
Conclusions
Sex, dementia and PreJOA appear to be causal factors for the LastJOA after posterior decompressive surgery for patients with DCM. Although additional information is needed to improve both the learning of the BN structure and the rate of prediction, the BN structure may be useful for predicting the probabilities for clinical outcomes for each patient who undergoes posterior decompressive surgery. Thus, the BN structure may provide a useful model in the current era of personalized medicine.
Ethical approval
This study was exempted from approval by our Institutional Review Board (IRB no. 30-2020-20) because the analysis was performed as a retrospective chart review that involved only minimal risk to human subjects. Therefore, the need for informed consent from the subjects was waived in the present study.
Acknowledgements
SBP and CY designed the study concept. SBP, SO and DAS wrote the original draft and designed the schematic figures and tables. SBP, HJY, SHL and IJ revised the manuscript. All authors contributed to the study design, critically reviewed the first draft, approved the final version and agreed to be accountable for the work.
Disclosure statement
The author(s) declares no competing interests.
Data availability statement
The authors of the included studies should be contacted individually regarding requests to share individual patient data.
Additional information
Funding
References
- Salem HM, Salem KM, Burget F, et al. Cervical spondylotic myelopathy: the prediction of outcome following surgical intervention in 93 patients using T1- and T2-weighted MRI scans. Eur Spine J. 2015;24(12):1–12. doi: 10.1007/s00586-015-4028-5.
- Bond M, McIntosh G, Fisher C, et al. Treatment of mild cervical myelopathy: factors associated with decision for surgical intervention. Spine (Phila Pa 1976). 2019;44(22):1606–1612. doi: 10.1097/BRS.0000000000003124.
- Sharifi B, McIntosh G, Fisher C, et al. Consultation and surgical wait times in cervical spondylotic myelopathy. Can J Neurol Sci. 2019;46(4):430–435. doi: 10.1017/cjn.2019.34.
- Karadimas SK, Erwin WM, Ely CG, et al. Pathophysiology and natural history of cervical spondylotic myelopathy. Spine (Phila Pa 1976). 2013;38(22 Suppl. 1):S21–S36. doi: 10.1097/BRS.0b013e3182a7f2c3.
- Sadasivan KK, Reddy RP, Albright JA. The natural history of cervical spondylotic myelopathy. Yale J Biol Med. 1993;66(3):235–242.
- Fehlings MG, Arvin B. Surgical management of cervical degenerative disease: the evidence related to indications, impact, and outcome. J Neurosurg Spine. 2009;11(2):97–100. doi: 10.3171/2009.5.SPINE09210.
- Nagai T, Takahashi Y, Endo K, et al. Analysis of spastic gait in cervical myelopathy: linking compression ratio to spatiotemporal and pedobarographic parameters. Gait Posture. 2018;59:152–156. doi: 10.1016/j.gaitpost.2017.10.013.
- Son DK, Son DW, Song GS, et al. Effectiveness of the laminoplasty in the elderly patients with cervical spondylotic myelopathy. Korean J Spine. 2014;11(2):39–44. doi: 10.14245/kjs.2014.11.2.39.
- Sun LQ, Li M, Li YM. Predictors for surgical outcome of laminoplasty for cervical spondylotic myelopathy. World Neurosurg. 2016;94:89–96. doi: 10.1016/j.wneu.2016.06.092.
- Tetreault L, Palubiski LM, Kryshtalskyj M, et al. Significant predictors of outcome following surgery for the treatment of degenerative cervical myelopathy: a systematic review of the literature. Neurosurg Clin N Am. 2018;29(1):115–127.e35. doi: 10.1016/j.nec.2017.09.020.
- Tetreault LA, Cote P, Kopjar B, et al. A clinical prediction model to assess surgical outcome in patients with cervical spondylotic myelopathy: internal and external validations using the prospective multicenter AOSpine North American and International Datasets of 743 patients. Spine J. 2015;15(3):388–397. doi: 10.1016/j.spinee.2014.12.145.
- Shen C, Xu H, Xu B, et al. Value of conventional MRI and diffusion tensor imaging parameters in predicting surgical outcome in patients with degenerative cervical myelopathy. J Back Musculoskelet Rehabil. 2018;31(3):525–532. doi: 10.3233/BMR-170972.
- Takenaka S, Aono H. Prediction of postoperative clinical recovery of drop foot attributable to lumbar degenerative diseases, via a Bayesian network. Clin Orthop Relat Res. 2017;475(3):872–880. doi: 10.1007/s11999-016-5180-x.
- Harrell FEJr., Lee KL, Mark DB. Multivariable prognostic models: issues in developing models, evaluating assumptions and adequacy, and measuring and reducing errors. Stat Med. 1996;15(4):361–387. doi: 10.1002/(SICI)1097-0258(19960229)15:4<361::AID-SIM168>3.0.CO;2-4.
- Arora P, Boyne D, Slater JJ, et al. Bayesian networks for risk prediction using real-world data: a tool for precision medicine. Value Health. 2019;22(4):439–445. doi: 10.1016/j.jval.2019.01.006.
- Onisko A, Druzdzel MJ, Austin RM. How to interpret the results of medical time series data analysis: classical statistical approaches versus dynamic Bayesian network modeling. J Pathol Inform. 2016;7:50. doi: 10.4103/2153-3539.197191.
- Yoo C, Ramirez L, Liuzzi J. Big data analysis using modern statistical and machine learning methods in medicine. Int Neurourol J. 2014;18(2):50–57. doi: 10.5213/inj.2014.18.2.50.
- Suzuki T, Shimoda T, Takahashi N, et al. Factors affecting bone mineral density among snowy region residents in Japan: analysis using multiple linear regression and Bayesian network model. Interact J Med Res. 2018;7(1):e10. doi: 10.2196/ijmr.8555.
- Tetreault L, Wilson JR, Kotter MR, et al. Predicting the minimum clinically important difference in patients undergoing surgery for the treatment of degenerative cervical myelopathy. Neurosurg Focus. 2016;40(6):E14. doi: 10.3171/2016.3.FOCUS1665.
- Park SB, Chung CK, Gonzalez E, et al. Causal inference network of genes related with bone metastasis of breast cancer and osteoblasts using causal Bayesian networks. J Bone Metab. 2018;25(4):251–266. doi: 10.11005/jbm.2018.25.4.251.
- Pumberger M, Schmidt H, Putzier M. Spinal deformity surgery: a critical review of alignment and balance. Asian Spine J. 2018;12(4):775–783. doi: 10.31616/asj.2018.12.4.775.
- Agostinho NB, Machado KS, Werhli AV. Inference of regulatory networks with a convergence improved MCMC sampler. BMC Bioinformatics. 2015;16:306. doi: 10.1186/s12859-015-0734-6.
- Khachatryan T, Robinson JS. The possible impact of cervical stenosis on cephalad neuronal dysfunction. Med Hypotheses. 2018;118:13–18. doi: 10.1016/j.mehy.2018.06.008.
- Wolf K, Reisert M, Beltrán SF, et al. Spinal cord motion in degenerative cervical myelopathy: the level of the stenotic segment and gender cause altered pathodynamics. J Clin Med. 2021;10(17):3788. doi: 10.3390/jcm10173788.
- Yang S, Nguyen ND, Center JR, et al. Association between hypertension and fragility fracture: a longitudinal study. Osteoporos Int. 2014;25(1):97–103. doi: 10.1007/s00198-013-2457-8.
- Nouri A, Martin AR, Kato S, et al. The relationship between MRI signal intensity changes, clinical presentation, and surgical outcome in degenerative cervical myelopathy: analysis of a global cohort. Spine (Phila Pa 1976). 2017;42(24):1851–1858. doi: 10.1097/BRS.0000000000002234.