
 ?Mathematical formulae have been encoded as MathML and are displayed in this HTML version using MathJax in order to improve their display. Uncheck the box to turn MathJax off. This feature requires Javascript. Click on a formula to zoom.
ABSTRACT
As one of the most serious hazards in the world, more than 80% of traffic accidents are caused by driver misconduct. The detection of abnormal behavior of drivers is important to improve safety in public transportation. The anomaly measurement is not only determined by objective rules such as laws, but also distinguished due to the biological characteristics. The same driving behavior may present completely opposite judgment results for different categories of drivers. In this paper, we propose a novel detection method that measures the preference path length of drivers for various driving operations via pheromones, and identifies abnormal driving behavior by calculating the cumulative conversion probability of operation switching. An improved ant colony algorithm based on fixed point simplicial theory is proposed to improve the convergence efficiency by optimizing the initial population state. Experimental results show that the proposed method can effectively detect abnormal driving behavior and significantly reduce false alarms.
Introduction
Drivers still play an important role in driving safety despite the presence of driverless vehicles, driving behavior detection during driving is crucial (Chen and Chen Citation2020). With the innovation of onboard sensors and the application of 5 G communication networks in the transportation industry, multi-source data reflecting the status of vehicles and other vehicles in complex driving environments can be collected and transmitted. More information sharing brings more opportunities and challenges to the study of driving behavior. Existing studies mainly focus on trajectory data, video data, physiological information data, and vehicle motion state data.
Studies based on trajectory data recover driving track over a period of time by using motion data, e.g., longitude, latitude, and time collected by satellite positioning devices (Chen and Chen Citation2021). From the macro level, the road traffic state is predicted and evaluated by the changes in the traffic flow trends within the region, such as abnormal congestion, vehicle demand change, and abnormal track detection. Research based on video data can be divided into driver state detection and driving environment detection. Cameras that are installed in the main driving position are used to collect images of the driver’s face, hands and body movements (Yao et al. Citation2022), whereas, the camera and radar outside the vehicle are used to collect images of objects affecting vehicle running in the real world (Kumar, Kant, and Pal Citation2022), such as lane lines, side vehicles, and weather. According to a large amount of sample data, image features are extracted by deep learning or machine learning techniques to build a detection model to recognize the driver state and the vehicle driving environment (Hu, Zhang, and Maybank Citation2020). Trajectory data and image data mainly reflect the driving state of the vehicle, however, as a biological feature, driving behavior is closely related to the psychological and physiological states (Meneghetti et al. Citation2018). The video data which collect the face and body movements are only the external display after the spiritual activity of the driver, and it can hardly be used to identify the physiological abnormal symptoms beforehand. Currently, electroencephalogram (EEG) is the main method used in a study based on physiological information, which not only accurately reflects the driver’s spiritual activity, but also has obvious differences in various traffic environments (Peng et al. Citation2022). Compared with other kinds of driving data, EEG shows two advantages in identifying driving behaviors: 1) EEG data have higher temporal resolution and allowing real-time classification based on it (Yang et al. Citation2020), 2) EEG data can provide additional information (physiological and emotional) beyond the vehicle of motion (Li et al. Citation2020). However, the high price of such devices and intrusive data collection approaches have hindered their wider application. The research based on vehicle motion state mainly uses time series data as the carrier to monitor kinematics and dynamics characteristics, including speed, acceleration, throttle and brake (Abusitta et al. Citation2023). Such type of research is wildly popular due to the advantages of low difficulty in obtaining data and low storage requirements, as well as better accuracy and quality of data than other types (Ryan, Murphy, and Mullins Citation2021).
Motion data reflecting the state of the vehicle contains multiple dimensions, such as movement data in the horizontal/vertical direction, running data for each component, as well as the interaction information between the vehicle and other vehicles or roads (Ryan, Murphy, and Mullins Citation2020). Thus, the detection of abnormal driving behavior requires the selection of data dimensions that can reflect driving habits and the determination of anomaly measures by classifying drivers.
Singh et al. (Singh and Kathuria Citation2021) used an embedded system based on the concept of the Internet of Things to extract vehicle operating parameters from on-board Diagnostics (OBD) to established an objective evaluation model of driving style, based on which the styles are categorized as: safety, economy, and comfort. Based on the theory of rigid body kinematics (Liu, Wang, and Qiu Citation2020), developed a specific physical model to reveal the variation rule of vehicle motion data which are collected by nine-axis motion sensors. Due to feature extraction, a classifier is built to recognize driving behaviors such as braking, acceleration, lane change, and swerve (Vlakveld, Doumen, and van der Kint Citation2021). combined hidden Markov model with long short-term memory network model based on the attention mechanism. The combined model is able to identify and predict aggressive driving behavior with an average accuracy of 80% (Xu et al. Citation2022). developed a method to identify the driving behaviors like going straight, left turn, right turn, and interrupt through acceleration and angular velocity data collected by smartphones sensors. To improve its robustness, a technique combining recurrent and convolutional neural networks with attention units was designed to remove the gravity effect on the sensors. Based on motion state estimation and passenger subjective feeling score (Xiang et al. Citation2021), proposed a prediction model composed of cloud model and Elman neural network, which is more intuitive in sensing potential dangerous driving behavior.
In such studies, as a biological property, the driving behavior of any two drivers cannot be exactly the same, and even drivers of the same type may have significantly different operating patterns (Habibifar and Salmanzadeh Citation2022). The same pattern may even present opposite judgment results for different drivers, so it is impossible to construct an anomaly pattern detection criterion that is applicable to all drivers in advance.
In this paper, we proposed an abnormal driving behavior detection method to fit the boundaries of different driving patterns with pheromone concentration, and measure the conversion probability between driving patterns based on an improved ant colony algorithm. Under the condition of incomplete sample labels, according to the motion data, the method can adaptively determine data bounds for various driving patterns and judgment criteria for abnormal driving behavior.
The Contribution of the Proposed Method Includes
Novel detection method: The proposed method introduces a novel approach to detecting abnormal driving behavior by measuring the preference path length of drivers for various driving operations via pheromones and calculating the cumulative conversion probability of operation switching.
Improved convergence efficiency: The use of an improved ant colony algorithm based on fixed point simplicial theory optimizes the initial population state and improves convergence efficiency, reducing false alarms and increasing accuracy.
Effective detection of abnormal behavior: The experimental results show that the proposed method effectively detects abnormal driving behavior, which can improve safety in public transportation and reduce traffic accidents caused by driver misconduct.
Overall, the proposed method offers a unique and effective approach to detecting abnormal driving behavior and improving safety in public transportation. By utilizing pheromones and an improved ant colony algorithm, the method offers improved accuracy and efficiency, reducing false alarms and increasing detection rates.
The article is organized into several sections, each of which describes a different aspect of the proposed method for detecting abnormal driving behavior using pheromones and an improved ant colony algorithm. The main sections of the article are:
Fixed point theory: This section describes the mathematical background of fixed point theory, which is used in the algorithm design.
Anomaly detection framework: This section presents the overall framework for detecting abnormal driving behavior using pheromones and an improved ant colony algorithm. It describes the key components of the framework, including the feature extraction process and the decision-making algorithm.
Algorithm design: This section provides a detailed description of the algorithm used for detecting abnormal driving behavior. It includes a discussion of the fixed point simplicial theory and the ant colony optimization algorithm, as well as the specific steps used to calculate the preference path length and cumulative conversion probability of operation switching.
Experiment and analysis: This section presents the experimental results of testing the proposed method on a dataset of driving data. It includes a discussion of the evaluation metrics used, as well as a comparison with other existing methods for detecting abnormal driving behavior.
Conclusion: This section summarizes the main contributions of the proposed method and discusses future directions for research in this area.
Fixed Point Theory
Related Definition
Definition 1
For a nonempty set X, f is its self-mapping, if there is a x*∈X which satisfying f(x*) =x*, x* will be considered as a precise fixed point of the mapping f.
Definition 2
For a Euclidean space Rn, existing such a polyhedron: the first coordinate of its first vertex descends, the second coordinate of its second vertex descends, … , and the n-th coordinate of the n-th vertex descends, but all the coordinates of the n+1-th vertex remain unchanged. Such a polyhedron is a complete simplex, the vertexes can be regarded as fixed points.
Definition 3
For a Euclidean space Rn, its basis vectors consist of an unit matrix u with n orders: u=u1+ … +un=(1, … ,1). Suppose that is an integral point set (a set of points whose coordinate components are all integers) of Rn. If point y0∈
, k1(y0,π) can be used to denote the n-dimensional simplex σ=<y0, y1, … , yn>. For yi=yi-1+uπ (i), i∈N, N=(1,2, … ,n), π=n! consist the substitution of N.
Simplicial Algorithm
As a method of connecting computational mathematics with topology, due to its strong local searching ability, simplicial algorithm (SA) can be used to narrow the searching space and reduce the iterative evolutionary algebra in the optimization problems (Ren et al. Citation2020). The process of SA is consisting of search space division, simplicial subdivision, and vertex labeling approach, as shown in .
Figure 1. The process of simplicial algorithm.
(1) Searching space division
For a Euclidean space Rn, line set xi=mhi (i = 1,2, …,n) is used to divide the searching space into uniform polyhedra, where m is the parameter of precision control. According to the requirement of the optimization problem, based on the value of searching space, all dimensions of the optimization variable can divide into various step size from one-hundredth to one ten-thousandth. If the optimization problem requiring high precision.
(2) K1 simplicial subdivision
According to Definition 2 and 3, due to the various form of substitution π, it can find n! n-dimensional simplexes from the positive side of each integer point y0. All the simplexes will be treated as a K1 simplicial subdivision of Rn. The detailed of K1 simplicial subdivision can be found in(Huang, Han, & Hu).
(3) Labelling approach of simplex vertex
After K1 simplicial subdivision, the fixed points can be identified by searching complete simplexes based on labeling rules. There are two approaches: integer labeling and vector labeling.
Vector labeling method. For a self-mapping f, the function can be built as l(x)=f(x)-x, then the n+1 orders matrix Lσ according to Equation 1 is the labeling matrix of an n-dimensional simplex σ=<y0, y1, … ,yn >. For the liner equation w=v, v=(1,2, … ,0)T, w ≥0, if the solution is existed, the simplex can be treated as a complete simplex, and x*=
is a fixed point.
Integer label method. For a self-mapping f, the function can be built as F(X)= f(x)-x, each vertex of the simplex is labeled according to Equation 2. The simplex will be treated as a complete simplex if its labeling sequence is Lσ=(0,1,2 … n), each vertex of the simplex can be treated as a fixed point.
The integer labeling method is advantage in a single loop, while the vector labeling method is advantage in the number of iterations. For complex functions, the number of iterations must be as few as possible, vector labeling method is better than integer labeling method. If the complexity of the function is low and easy to calculation, the integer labeling method can save more computation.
Anomaly Detection Framework
Data Collection
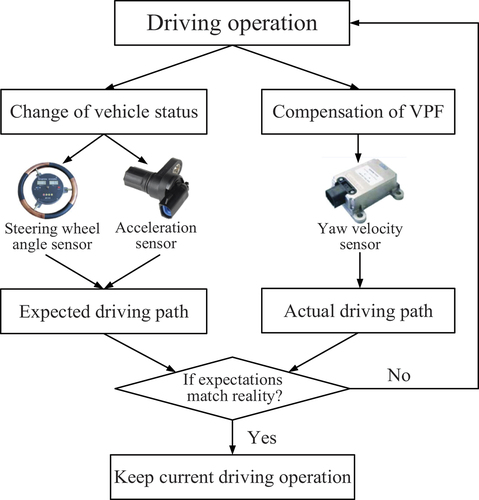
In the process of vehicle running, driving operations will trigger the compensation of the Vehicle Power Feedback System (VPF) based on preset rules (Sethuraman et al. Citation2023), such as the Electronic Stability Program (ESP), Anti-lock Braking System (ABS), advanced driver assistance system (ADAS), etc. The pattern of driving behavior is consisted of a series of driving operations. As shown in , the sequential data reflecting the behavior characteristics of different drivers are fit by taking yaw velocity of the vehicle after compensation as the output, taking the wheel steering and expected speed (realized through deceleration or acceleration) collected by the sensor is taken as the input.
Figure 2. The fitting process of driving behavior.
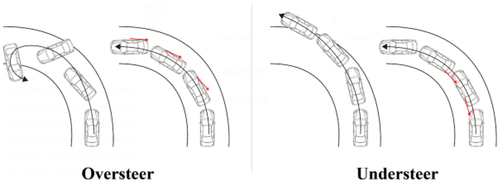
For each driving operation, the VPF system will predict and compensate according to the pre-set rule base. However, due to the different behavior characteristic of each driver, the compensation may deviate from the actual expectations of the driver. Drivers who fail to achieve the expected objective continue to adjust driving operations, and the VPF system compensates based on the driver’s re-operation until the two expectations reach a consensus. As shown in , when the vehicle is oversteer, the feedback system modifies the yaw velocity by adjusting the velocity of the outer wheel to keep the actual trajectory consistent with the expectation. Otherwise, it will modify the yaw rate by adjusting the internal wheel speed when the vehicle is understeer.
Figure 3. Trajectory correction based on yaw velocity.
According to the receipts collected by the vehicle sensors, a discrete data series reflecting the characteristics of driving behavior of different drivers can be fitted by polynomial equation: Sv=(<B1, T1>,<B2, T2>, … ,<Bk, Tk> …). Time attribute T is used to record the time point at which data is collected by vehicle sensor when the driver carries out driving operation. Behavior attribute B is which measured by Equation 3.
f represents the function relation between the feedback system and driver operations. Parameter θ represents the steering wheel angle, Parameter w represents the expected speed, and Yaw is the vehicle yaw velocity compensated by the feedback system.
According to EquationEquation 4(4)
(4) , the yaw velocity can be calculated by the speed discrepancy between the inner and outer wheels. The speed sensors are usually installed on driving wheels.
Parameter wr1 represents the outer wheel speed, wr2 is the inner wheel speed, l is the wheel pitch, and α is the wheel Angle.
Assumption
Assumption 1
The behavior attributes of data in the sequence Sv are all legal operations.
The proposed method aims to identify abnormal driving patterns that may be caused by fatigue, vehicle failure, and other causes that are obvious different from the normal driving states, but excludes subjective conscious abnormal operations such as speeding, illegal lane changes, etc.
Assumption 2
The data generated by a single driving operation in the sequence Sv is normal by itself.
Any type of driver is likely to perform some of the same driving operations, such as braking, rapid acceleration. Thus, the anomaly is not measured on the basis of a single operation, but refers to an abnormal driving pattern consisted of a series of operations.
Assumption 3
All operations employed by drivers are regarded as a finite discrete list, and each driving pattern consists of a finite number of operations.
In the experiment, the driving operations were classified refer to the variation amplitude of steering wheel and expected velocity.
Assumption 4
The data that constitutes the abnormal driving pattern is a tiny fraction of the sequence Sv.
Anomaly Measurement
Based on the above assumptions, any single driving operation is considered normal in the sequence Sv, but there are significant differences in the combination of operations and conversion rules employed by different types of drivers. For example, conservative drivers typically do not take a rapid acceleration operation after steering, while aggressive drivers do not engage in braking maneuvers when slowing down. Therefore, in this paper, we propose an anomaly detection method based on the measurement of the cumulative conversion probability between different driving operations.
Anomaly is measured as follows: within a certain interval, if the cumulative conversion probability of continuously varying driving operations falls below the threshold value, these operations will be identified as abnormal driving patterns. Otherwise, they will be judged to be normal driving behavior.
Detection Model
In order to improve the efficiency in detecting abnormal driving patterns, as shown in , the model is divided into an offline fitting stage and an online detection stage.
Figure 4. The process of detection model.
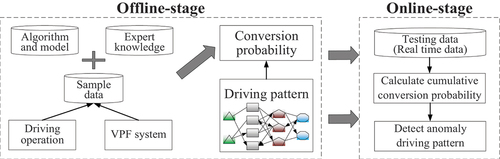
In the offline stage: First, the driving pattern is segmented based on the sample dataset. In the sequence, the time point when the vehicle state changes (yaw velocity changes) due to the new driving operation will be set as the starting point, and the time point when the state reaches stability after compensation by the VPF system (yaw velocity does not change) will be set as the end point, then the subsequence between starting points and end points is regarded as an initial driving pattern. Second, driver behavior characteristics are measured based on the preferred path. Each driving pattern can be viewed as a path for the driver to achieve the driving purpose, and different types of driving operations are treated as nodes on the path. The conversion probabilities between different driving operations are calculated using the pheromone theory of ant colony algorithm. The higher the concentration of pheromone, the shorter the preferred path, which means the greater the conversion probability between the operations.
In the online stage: Firstly, calculating the cumulative conversion probability for the test dataset. Then, the normal and abnormal driving patterns can be distinguished depending on the threshold of the probability.
Algorithm Design
The algorithm involved in the proposed method consists mainly of the following three parts: the calculation of conversion probability between driving operations, the calculation of cumulative conversion probability, and an improved ant colony algorithm based on fixed point theory.
Conversion Probability Calculation
Each driving pattern corresponds to a preferred path that reflects the behavioral characteristics of different drivers. Due to the virtual existence of preferred path, this paper adopts the pheromone concentration theory in ant colony algorithm (Yi et al. Citation2020) to measure preferred path distance, which is detailed as follows:
Each driving operation in the process of vehicle running is regarded as a “node”, and the number is denoted as N.
There is no actual physical path between nodes, and the distance of physical paths is regarded as zero.
A series of driving operations taken by the driver to realize the driving purpose can be regarded as a movement track of the ant, and the pheromone concentration between the two nodes in the list is τij, i, j∈N.
Each ant saves a list tabu() to record the sequence of nodes visited so far, that is, to record all the driving operations that may occur after the current operation.
5) Update the pheromone concentration in the tabu() based on real-time driving operation conversion. The distance of preferred path between the current driving operation and the possible next driving operation is measured in terms of the pheromone concentration between the two nodes.
The conversion probability between driving operations is determined by two factors: one is the distance of the preferred path between two nodes, the other is the average residence time at the current node (the duration of not taking a new operation). The calculation is carried out as follows.
(1) In the time interval T, if m ants were recorded crawling through, the concentration of volatilization of pheromone between any two nodes was calculated according to EquationEquation 5.(5)
(5) Parameter ρ is the volatilization coefficient of pheromone, 0<ρ < 1.
(2) According to EquationEquation 6(6)
(6) , the preferred path between nodes is measured by the conversion probability. The higher the concentration of pheromone, the shorter the preferred path, which means that the conversion probability between the two driving operations is larger.
(3) Recording the residence time of the driver at each node: t=ηi,i∈N. Within a time interval T, if k ants crawl through node i, the average value of the residence time at that node is computed according to EquationEquation 7.(7)
(7) The maximum value max(ηi) and minimum value min(ηi) of the residence time are also recorded.
(4) The attenuation factor ω of the average residence time is set at each node, 0<ω < 1. The estimated residence time at current node is calculated using Equation 8.
(5) The conversion probability from the current operation to the next one is calculated using EquationEq.9(9)
(9) . Parameters α and β represent the calculated weight ratio of the distance of the preferred path and the average residence time, α+β = 1. When the estimated residence time exceeds the maximum or minimum range, a large weight is assigned to the residence time: α1>α2, β1<β2.
(6) After each ant movement, the following information is updated: list tabu(), pheromone concentration and residence time.
Cumulative Conversion Probability
The cumulative conversion probability is calculated using EquationEquation 10(10)
(10) , parameter γ represents the decreasing weight. If the value of cumulative conversion probability is lower than the threshold, these driving operations will be identified as abnormal driving patterns.
Improved Ant Colony Algorithm
Aiming at the loss of computational efficiency caused by the probabilistic movement of individual ants in traditional algorithms, an improved ant colony algorithm based on the fixed point theory (Fixed point- ant colony optimization algorithm, FP-ACO) was proposed to improve the iterative efficiency by optimizing the quality of initial population.
The FP-ACO algorithm is divided into three steps. First, the extreme value solution problem for the objective function of the Ant Colony algorithm (ACO) is transformed into the fixed point equation solution problem. Second, the set of fixed points obtained by the simplicial algorithm (SA) is used as the initial population for the ACO algorithm. Finally, the max-min strategy is used to update the pheromone to enhance the global search capability, since the fixed points are almost distributed at the edges of the local extrema.
The Construction of Fixed Point Equation
The extreme value solution problem for the objective function of the ACO algorithm can be described in EquationEquation 11.(11)
(11) Parameter X is the variable of n dimension, f(X) is the objective function, gi(X) represents constraint functions.
If the objective function is differentiable everywhere in the domain, the optimal solution must occur at the position satisfying the derivative function f’(X) = 0. Otherwise, the point may be inflection points, but the optimal solution must be included. The search space of the ACO algorithm can be greatly reduced by taking these points as the initial population. The specific steps are as follows:
The derivative function fʹ(X) = 0 can be constructed as an equation of fixed point: F(X)=X- fʹ(X). According to Definition 1, if the function F(X) have a fixed point, it must satisfy F(x*)=x*- fʹ(x*)=x*, then fʹ(x*) = 0.
According to EquationEquation12
(12)
Initial Population Based on Fixed Point
The fixed point equation can be solved by the simplicial algorithm, and the fixed points on the complete simplex are used as the initial population for the ACO algorithm. The specific steps are as follows:
The searching space [-ximax: ximax] of fixed point equation is divided due to the predefined step size.
K1 simplicial subdivision is performed on the divided searching space.
The simplexes obtained by the K1 subdivision is labeled according to the vector labeling method or the integer labeling method. The complete simplexes can be found according to the judgment rule of each method.
The initial population of the ACO algorithm is set as the sequence of complete simplex σ=(σ1, σ2, … , σj).
Max-Min Ant Strategy
The maximum and minimum ant strategy is used to avoid the “stagnation” phenomenon that all ants converge to the same path because the pheromone concentration on the path is much higher than that on others. Limit the upper and lower values of pheromone concentration values[τmin: τmax], and the concentration on all branches are initialized to the maximum τmax. Only the best performing ant is allowed to update the pheromones along the path at each iteration of the algorithm. The ant updates pheromone concentration after each cycle according to EquationEquation13(13)
(13) , f(sbest) represents the global optimal solution with the best fitness.
Contrast Test
Testing Function
In this section, five functions are chosen to test the effectiveness of the FP-ACO algorithm, including two unimodal functions: Sphere, Rosenbrock, and three multimodal functions: Ackley, Griewanks, Rastrigin. The details of the functions are listed in .
Table 1. The details of the five testing functions.
To test the adaptability of the algorithm in the complex setting, the orthogonal matrix is generated by applying Salomon’s algorithm to the rotation of three multimodal functions according to EquationEquation 14.(14)
(14) X=[x1, x2, … , xn] is the independent variable of the non-rotating functions, Y is the independent variable after rotation, and the rotation function is denoted as f*(x). After rotation, the local extrema of the functions increase sharply.
Testing Result and Analysis
The dimensionality of all test functions is set to n = 30. The FP-ACO and conventional ACO algorithms were independently run 50 times on the test functions. The termination condition of non-rotation function algorithm is 2 × 10⁵ function evaluation, and the termination condition of rotation function algorithm is 4 × 10⁵ function evaluation. As shown in , the mean and standard deviation of the 50 testing results is recorded, and all results are kept to two decimal places.
Table 2. The testing result of the two algorithm.
From the testing results, it is obvious that the FP-ACO algorithm achieves better average convergence rate and solution accuracy than the conventional ACO algorithm for both non-rotating and rotating detection functions.
In terms of convergence rate, the excellent state of the initial population allows the FP-ACO algorithm to find high-quality solutions with fast convergence rates by drastically reducing the searching space and the number of redundant iteration steps. The FP-ACO algorithm shows significantly better running stability than the conventional ACO algorithm, and the standard deviation still retains an obvious advantage even when dealing with complex rotation functions. It is further demonstrated that the FP-ACO algorithm has better applicability and stability when dealing with complex problems.
In terms of solution accuracy, the fixed points are distributed almost at the edges of the extreme values of the function. Thus, the set of max-min strategies is correspondingly better suited for global search, the ability of the algorithm to jump out of the local optimal solution is enhanced, and the search process exhibits continuous optimization. In particular, for the multimodal functions of Ackley, Griewanks, and Rastrigin with a large number of local optima, the search procedure hardly gets stuck in the local optima.
Robust Analysis
The robustness of the algorithm is verified by analyzing whether the same function runs stably under different conditions (rotation and non-rotation). Multimodal functions Ackley, Griewanks, and Rastrigin were selected for experiments, and the rate of successful convergence (SR) and the mean value of the function evaluation times (FEs) required for successful convergence are recorded for the two algorithms in 50 independent experiments.
Successful convergence means that the optimal solution found by the algorithm reaches the threshold (or the optimal solution of the test function) within the maximum iterative number. The testing result is shown in .
Table 3. The value of SR and the mean of FEs of 50 independent experiments.
In the non-rotating case, the SR of the FP-ACO algorithm is much higher than that of the conventional ACO algorithm for all three test functions. In the case of the rotation function, the SR of the conventional ACO algorithm is significantly reduced. However, in the same case, although the FP-ACO algorithm uses more function evaluations, the SR is basically stable, which can demonstrate the robustness of the proposed algorithm.
Experiment and Analysis
A testbed environment for evaluating the proposed method for detecting abnormal driving behavior using pheromones and an improved ant colony algorithm would ideally consist of the following technical components:
Data collection system: A system for collecting driving data from various vehicles in a controlled and standardized manner. This system should include sensors for measuring vehicle speed, acceleration, braking, steering angle, and other relevant parameters, as well as a mechanism for storing and managing the collected data.
Feature extraction and preprocessing system: A system for extracting relevant features from the collected driving data and preprocessing them for further analysis. This system should include algorithms for segmenting the data into individual driving operations, calculating the preference path length of drivers for each operation via pheromones, and converting the data into a format suitable for analysis by the anomaly detection framework.
Anomaly detection framework: A software framework for implementing the proposed method for detecting abnormal driving behavior. This framework should include algorithms for calculating the cumulative conversion probability of operation switching, as well as a decision-making algorithm for determining whether a given driving behavior is abnormal or not. The framework should also include mechanisms for training and testing the algorithm on different datasets, as well as for evaluating its performance using various metrics.
Hardware and software infrastructure: A high-performance computing infrastructure capable of running the feature extraction, preprocessing, and anomaly detection algorithms in a timely and efficient manner. This infrastructure should include powerful computing resources such as multi-core processors, GPUs, and high-speed storage, as well as software tools for managing and monitoring the computing resources.
Evaluation and visualization tools: Tools for evaluating the performance of the proposed method on different datasets using various metrics, as well as for visualizing the results in a meaningful and informative way. These tools should include mechanisms for generating ROC curves, confusion matrices, and other relevant metrics, as well as for visualizing the driving data and the detected anomalies.
Overall, the testbed environment should provide a comprehensive and standardized way for evaluating the proposed method for detecting abnormal driving behavior, and should include all the necessary components for collecting, processing, and analyzing driving data in a consistent and reproducible manner.
Experimental Data
Combined with expert knowledge, the driving operation of the experimental dataset is divided into 20 categories. First, wheel steering is divided into left and right turns, and the turns are divided into five types of operation based on the steering angle. Second, acceleration and deceleration are classified into five types of operations based on the expected driving speed. Finally, for yaw velocity, when Yaw < 5, the car can be regarded as the stability, when Yaw > 30, the car will roll over, which belongs to improper operation. The yaw velocity is divided into 5 levels according to the range of Yaw∈[5:30]. For the convenience of subsequent expressions, the information of the various operations is shown in .
Table 4. The specific information of each kind of driving operation.
The dataset provided by AXAFootnote1 platform contains 547,200 driving trajectory data of 2736 anonymized drivers. As shown in , steering wheel angle (SWA) and expected driving speed (EDS) were taken as input and yaw velocity as output to calibrate these two driving behaviors. The color change from blue to red indicates an increase in driver aggression.
Figure 5. The details of the experiment dataset.
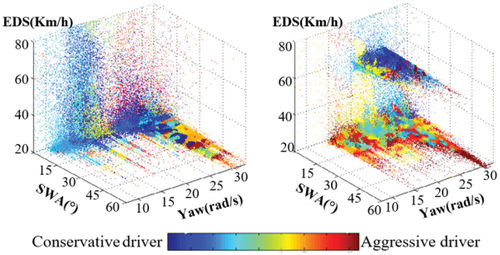
Based on assumption 4, which suggests that anomalies are only a very small fraction of the entire dataset, we decided to include a relatively small number of aggressive driver data points in the testing dataset, as we anticipate that anomalies will be rare.
After screening, there were 56,300 driving data representing conservative drivers and 87,200 driving data representing aggressive drivers. 20, 000 data representing conservative drivers were randomly selected as the sample dataset. According to Assumption 4, the anomaly is only a very small fraction of the entire dataset. Therefore, 2,600 randomly selected data representing aggressive drivers were split into eight sequences and mixed with the remaining 36,300 conservative driver data to form the testing dataset.
Data augmentation is used in machine learning to increase dataset size and diversity. The technique involves creating new examples from existing data to improve the model’s generalization ability by exposing it to more diverse and representative examples. There are various data augmentation techniques depending on the data type and problem being addressed. In our proposed method for detecting abnormal driving behavior using pheromones and an improved ant colony algorithm, we utilized data augmentation techniques to increase dataset diversity and improve the generalization ability of our method. We generated additional driving data points by applying slight variations to existing driving data points, such as adjusting the vehicle’s speed, acceleration, or direction. This helped to create a more diverse set of examples for the method to learn from, which ultimately enhanced its performance on new and unseen datasets.
Overall, data augmentation is a powerful technique that can improve the generalization ability of machine learning models across various contexts by creating more diverse and representative datasets.
Normal Driving Behavior Fitting
For the sample dataset, driving behaviors are first classified according to , and then the FP-ACO algorithm is used to calculate the conversion probability between different kinds of driving operations according to EquationEquation 3(3)
(3) –Equation7
(7)
(7) . The results are listed in , where all results are kept to two decimal places. The greater the conversion probability, the greater the probability of these two types of operations occur sequentially in the driving pattern of the conservative driver. Blank means that there is no preferred path between driving operations, which implies that the driver will not take both types of driving operations consecutively.
Table 5. The conversion probability between different driving operations.
Anomaly Detection
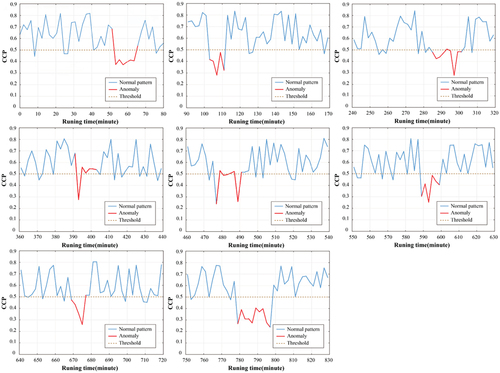
According to the conversion probability in , the average conversion probability of the sample dataset is approximately equal to 0.513, then the threshold is set as Φ = 0.5. In the testing dataset, sequences with cumulative conversion probability of driving operations below 0.5 will be identified as abnormal driving patterns. The experimental results are shown in , where the proposed method is able to successfully identify eight randomly inserted data sequences representing the driving patterns of aggressive drivers.
Figure 6. The result of anomaly detection.
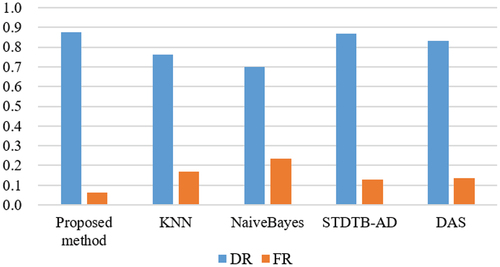
To further demonstrate the meliority of the proposed method, a comparison experiment was conducted with several current mainstream detection methods, such as STDTB-AD (Yu and Huang Citation2022), NaiveBayes (Odiathevar, Seah, and Frean Citation2022), KNN (Ma et al. Citation2023), and dynamic basic activity sequence matching (DAS) (Nguyen et al. Citation2020). The experiment is conducted on the same sample and testing dataset, the detection rate (DR) and the false alarm rate (FR) is shown in . Due to the experimental results, the proposed method is consistent with the mainstream algorithms in terms of detection rate and has a small advantage, but it has a significant advantage in terms of false alarm rate.
Figure 7. The result of comparison experiment.
Experiment Analysis
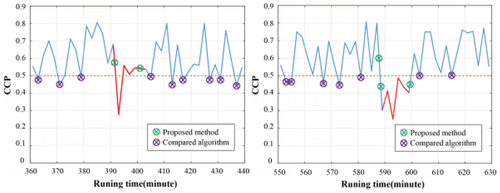
By comparing the detection results with the data labels of the testing dataset, although the proposed method successfully detected all abnormal patterns representing aggressive drivers, it failed to identify all the 2600 abnormal data that had been calibrated in advance. The detection rate (DR) is 87.56%, and the false alarm rate (FR) is 6.35%, the false alarm and unrecognized parts are mainly at the beginning and end of the sequence that characterizes the abnormal driving pattern.
As shown in , in contrast to other algorithms, we do not identify individual behaviors below the threshold as anomalies. However, due to certain similarities between the driving patterns of conservative drivers and aggressive drivers, the start and end points of abnormal patterns are often inaccurate.
Figure 8. The result of following experiment.
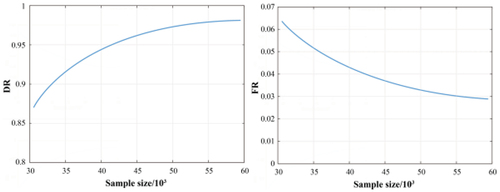
In the following experiment, we expand the size of sample dataset (by copying the data of conservative drivers) to improve the detection accuracy by fitting a more accurate conversion probability. The experimental results are shown in , where the accuracy and false positive rate of the detection method show a trend of continuous optimization as the size of the sample dataset increases.
Figure 9. The detection result after improvement.
It must be noted that the generalization ability of any machine learning method is an important factor in determining its usefulness in real-world applications. In the case of the proposed method for detecting abnormal driving behavior using pheromones and an improved ant colony algorithm, there are several factors that may impact its generalization ability.
One of the main parameters that can affect the efficiency of the method is the decision threshold used to identify abnormal driving behavior. If the threshold is set too low, the method may identify too many false positives, leading to a high rate of false alarms. On the other hand, if the threshold is set too high, the method may miss many instances of abnormal driving behavior, leading to a high rate of false negatives. Therefore, it is important to carefully select an appropriate decision threshold based on the characteristics of the dataset being used.
Another parameter that can impact the generalization ability of the method is the choice of features used to represent the driving behavior data. The method described in the paper uses pheromones to measure the preference path length of drivers, but other features may be more relevant for detecting abnormal driving behavior in different datasets. Therefore, it may be necessary to adapt the feature selection process to each new dataset being used.
Additionally, the choice of dataset used to train and test the method can also impact its generalization ability. The authors describe a specific dataset in their paper, but the method may not perform as well on other datasets with different characteristics. It may be necessary to collect additional data or fine-tune the method for each new dataset.
In summary, the generalization ability of the proposed method for detecting abnormal driving behavior using pheromones and an improved ant colony algorithm may be impacted by several factors, including the decision threshold, feature selection, and choice of dataset. Therefore, it is important to carefully consider these factors and adapt the method as necessary when applying it to new datasets.
Conclusion
As a biological property, the behavioral characteristics of any two drivers cannot be exactly the same. Even the driving patterns of drivers in the same class can be quite different, making it difficult to construct universal criteria for abnormal judgment.
To address this issue, in this paper, we propose an abnormal driving behavior detection method by fitting behavioral characteristics of different drivers. The proposed method consists of three parts: First, based on the vehicle power feedback system, the data sequence which can reflect the driver behavior characteristics is formed with the steering wheel angle and expected speed as independent variables and the vehicle yaw velocity as dependent variables. Second, the cumulative conversion probabilities of the driver switching between different kinds of driving operations is calculated based on the pheromone concentration, and sequences of driving actions below a certain threshold in the test dataset are identified as abnormal driving behaviors. Finally, an improved ant colony algorithm based on simplicial algorithm is proposed, where the set of fixed points is used as the initial population to optimize the iterative process of the colony algorithm.
The results of the algorithmic tests show that the FP-ACO algorithm outperforms the conventional ACO algorithm in terms of convergence speed and convergence accuracy, especially when dealing with complex functions. Experimental results on driving data show obvious advantages of the proposed method in terms of accuracy and false alarm rate compared to the current algorithms. In addition, further experiment indicates that the detection effect shows a trend of improvement as the size of the sample dataset is enlarged.
Potential sources of overhead are based on the general characteristics of the method.
One potential source of overhead is the feature extraction process used to calculate the preference path length of drivers for various driving operations via pheromones. This process may require significant computational resources, especially if the dataset is large or complex. Additionally, using pheromones to represent driver preferences may require additional hardware or sensors to be installed in the vehicle, which could increase the cost and complexity of implementing the method.
Another potential source of overhead is using the ant colony optimization algorithm to optimize the initial population state. This algorithm may require significant computational resources, especially if the dataset is large or the convergence efficiency needs to be improved. Additionally, using fixed point simplicial theory may require additional mathematical computations, which could increase the computational overhead of the algorithm.
The method requires some degree of computational overhead due to the use of complex algorithms and feature extraction processes. Nevertheless, the method’s potential benefits in improving safety in public transportation may outweigh the overhead costs, especially if the method is optimized and scaled appropriately.
Disclosure Statement
No potential conflict of interest was reported by the author(s).
Data Availability Statement
Data will be provided upon request to the authors.
Additional information
Funding
Notes
References
- Abusitta, A., G. H. de Carvalho, O. A. Wahab, T. Halabi, B. C. Fung, and S. Al Mamoori. 2023. Deep learning-enabled anomaly detection for IoT systems. Internet of Things 21:100656. doi:10.1016/j.iot.2022.100656.
- Chen, L.-W., and H.-M. Chen. 2020. Driver behavior monitoring and warning with dangerous driving detection based on the internet of vehicles. IEEE Transactions on Intelligent Transportation Systems 22 (11):7232–1806. doi:10.1109/TITS.2020.3004655.
- Chen, L.-W., and H.-M. Chen. 2021. Driver behavior monitoring and warning with dangerous driving detection based on the internet of vehicles. IEEE Transactions on Intelligent Transportation Systems 22 (11):7232–41. doi:10.1109/tits.2020.3004655.
- Habibifar, N., and H. Salmanzadeh. 2022. Relationship between driving styles and biological behavior of drivers in negative emotional state. Transportation Research, Part F, Traffic Psychology and Behaviour 85:245–58. doi:10.1016/j.trf.2022.01.010.
- Hu, J., X. Zhang, and S. Maybank. 2020. Abnormal driving detection with normalized driving behavior data: A deep learning approach. IEEE Transactions on Vehicular Technology 69 (7):6943–51. doi:10.1109/TVT.2020.2993247.
- Kumar, P. P., K. Kant, and A. Pal (2022). C-FAR: A Compositional Framework for Anomaly Resolution in Intelligent Transportation Systems. IEEE Transactions on Intelligent Transportation Systems. doi:10.1109/TITS.2022.3196548.
- Li, G., W. Lai, X. Sui, X. Li, X. Qu, T. Zhang, and Y. Li. 2020. Influence of traffic congestion on driver behavior in post-congestion driving. Accident Analysis & Prevention 141:105508. doi:10.1016/j.aap.2020.105508.
- Liu, L., Z. Wang, and S. Qiu. 2020. Driving behavior tracking and recognition based on multisensors data fusion. IEEE Sensors Journal 20 (18):10811–23. doi:10.1109/JSEN.2020.2995401.
- Ma, Y., Z. Xie, S. Chen, F. Qiao, and Z. Li. 2023. Real-time detection of abnormal driving behavior based on long short-term memory network and regression residuals. Transportation Research Part C: Emerging Technologies 146:103983. doi:10.1016/j.trc.2022.103983.
- Meneghetti, L., M. Terzi, S. Del Favero, G. A. Susto, and C. Cobelli. 2018. Data-driven anomaly recognition for unsupervised model-free fault detection in artificial pancreas. IEEE Transactions on Control Systems Technology 28 (1):33–47. doi:10.1109/TCST.2018.2885963.
- Nguyen, T.-H., D.-N. Lu, D.-N. Nguyen, and H.-N. Nguyen. 2020. Dynamic basic activity sequence matching method in abnormal driving pattern detection using smartphone sensors. Electronics 9 (2):217. doi:10.3390/electronics9020217.
- Odiathevar, M., W. K. Seah, and M. Frean. 2022. A Bayesian approach to distributed anomaly detection in edge AI networks. IEEE Transactions on Parallel and Distributed Systems 33 (12):3306–20. doi:10.1109/TPDS.2022.3151853.
- Peng, Y., Q. Xu, S. Lin, X. Wang, G. Xiang, S. Huang, and H. Zhang, C. Fan. 2022. The application of electroencephalogram in driving safety: Current status and future prospects. Frontiers in Psychology 13:13. doi:10.3389/fpsyg.2022.919695.
- Ren, M. L., X. D. Huang, X. X. Zhu, and L. J. Shao. 2020. Optimized PSO algorithm based on the simplicial algorithm of fixed point theory. Applied Intelligence 50 (7):2009–24. doi:10.1007/s10489-020-01630-6.
- Ryan, C., F. Murphy, and M. Mullins. 2020. End-to-end autonomous driving risk analysis: A behavioural anomaly detection approach. IEEE Transactions on Intelligent Transportation Systems 22 (3):1650–62. doi:10.1109/TITS.2020.2975043.
- Ryan, C., F. Murphy, and M. Mullins. 2021. End-to-end autonomous driving risk analysis: A behavioural anomaly detection approach. IEEE Transactions on Intelligent Transportation Systems 22 (3):1650–62. doi:10.1109/tits.2020.2975043.
- Sethuraman, R., S. Sellappan, J. Shunmugiah, N. Subbiah, V. Govindarajan, and S. Neelagandan. 2023. An optimized AdaBoost Multi-class support vector machine for driver behavior monitoring in the advanced driver assistance systems. Expert Systems with Applications 212:118618. doi:10.1016/j.eswa.2022.118618.
- Singh, H., and A. Kathuria. 2021. Analyzing driver behavior under naturalistic driving conditions: A review. Accident Analysis & Prevention 150:105908.
- Vlakveld, W., M. Doumen, and S. van der Kint. 2021. Driving and gaze behavior while texting when the smartphone is placed in a mount: A simulator study. Transportation Research, Part F, Traffic Psychology and Behaviour 76:26–37. doi:10.1016/j.trf.2020.10.014.
- Xiang, H., J. Zhu, G. Liang, and Y. Shen. 2021. Prediction of dangerous driving behavior based on vehicle motion state and passenger feeling using cloud model and Elman neural network. Frontiers in Neurorobotics 15:641007.
- Xu, W., J. Wang, T. Fu, H. Gong, and A. Sobhani. 2022. Aggressive driving behavior prediction considering driver’s intention based on multivariate-temporal feature data. Accident Analysis & Prevention 164:106477. doi:10.1016/j.aap.2021.106477.
- Yang, Y., Y. Chen, C. Wu, S. M. Easa, W. Lin, and X. Zheng. 2020. Effect of highway directional signs on driver mental workload and behavior using eye movement and brain wave. Accident Analysis & Prevention 146:105705. doi:10.1016/j.aap.2020.105705.
- Yao, Y., X. Wang, M. Xu, Z. Pu, Y. Wang, E. Atkins, and D. J. Crandall. 2022. DoTA: Unsupervised detection of traffic anomaly in driving videos. IEEE Transactions on Pattern Analysis & Machine Intelligence 45 (1):444–59. doi:10.1109/TPAMI.2022.3150763.
- Yi, N., J. Xu, L. Yan, and L. Huang. 2020. Task optimization and scheduling of distributed cyber–physical system based on improved ant colony algorithm. Future Generation Computer Systems 109:134–48. doi:10.1016/j.future.2020.03.051.
- Yu, W., and Q. Huang. 2022. A deep encoder-decoder network for anomaly detection in driving trajectory behavior under spatio-temporal context. International Journal of Applied Earth Observation and Geoinformation 115:103115. doi:10.1016/j.jag.2022.103115.