
ABSTRACT
Dentists judge that the quality of dental treatment for each patient is very time-consuming and inefficient, lacks quantitative evaluation criteria, and is easy to cause errors. At the same time, the traditional method of extracting tooth and root canal image features based on experience is difficult to accurately extract the tooth area and root canal filling area, resulting in low accuracy of tooth and root canal segmentation, which in turn affects the accuracy of tooth treatment quality evaluation. In this paper, a deep learning convolutional neural network is used to segment the root canal filling area, tooth boundary, and the boundary between tooth and soft tissue for the real patient ‘s root canal treatment and filling image. Finally, the segmented image is quantitatively evaluated according to the multi-evaluation index of professional doctors. The experimental results show that the intelligent evaluation method of dental treatment quality combined with deep learning and multi-index decomposition proposed in this paper not only unifies the evaluation criteria of dental treatment quality but also the therapeutic effect of quantitative scoring can effectively improve the work efficiency of doctors, which has reference significance for the application of artificial intelligence in the medical field.
Introduction
With the rapid development of 3D digital imaging technology in recent years, digital oral technology has attracted more and more attention. Its convenience and efficiency also affect the oral medical industry. Common treatment methods in the oral dental treatment industry include root canal therapy, filling teeth, dental correction, dental implant, and so on. Modern root canal therapy is an effective therapy for the treatment of pulp periapical disease. The evaluation of root canal therapy is to judge the quality of root canal therapy.
At present, there are few research results in this field at home and abroad, and there is no better automated and standardized evaluation method. In Zhou et al. (Citation2019), the Cochrane system evaluation method was used to compare the efficacy of root canal therapy for chronic periapical periodontitis, in order to guide the clinical application of root canal therapy for chronic periapical periodontitis to make effective and safe decisions. Wang Xiaqin et al. mentioned in Wang and Zhang (Citation2019) that the root canal filling quality evaluation criteria include root canal filling length and root canal filling density, but did not give a specific quantitative evaluation. The current evaluation methods of root canal therapy mostly rely on the doctor ‘s experience judgment, lack of quantitative standards, and can easily cause errors. At the same time, dentists often need to evaluate the effect of filling teeth to control the quality of filling teeth. In the existing technology, the quality of filling teeth is evaluated by manually consulting the filling teeth images. Dentists need to score the tooth status of each patient before, during and after operation, so as to judge the effect of filling teeth. However, with the increasing number of patients and the increasing number of medical images faced by doctors, the problems exposed by manual analysis have become increasingly prominent. The following disadvantages exist: (1) Large amount of image information data, low efficiency; (2) Due to visual fatigue, doctors inevitably make wrong judgments; (3) Doctors mainly make judgments based on experience, which is highly subjective and lacks quantitative standards Peng et al. (Citation2020). Therefore, it is necessary to propose an accurate, efficient, and repeatable intelligent evaluation method for dental treatment quality to reduce manual participation in medical image processing analysis.
In recent years, deep learning has achieved great success in object detection and image segmentation in the field of computer vision Singh and Raza (Citation2022); Ling, Zeng, and Dhaliwal (Citation2023); Arunachalam and Sethumathavan (Citation2022). For example, U-Net Ronneberger, Fischer, and Brox (Citation2015), which is popular in medical image semantic segmentation, its U-shaped structure and jump connection have inspired a large number of researchers to think about the way the network is integrated Rong, Wang, and Sun (Citation2021). Medical image segmentation is not a research direction that has only appeared in recent years. As early as before the emergence of deep learning, it has been a hot field of research in the industry. However, with the application of related technologies of deep learning, the research in this direction has made great progress in accuracy and robustness Jin, Liu, and Chen (Citation2022). Compared with traditional images, the performance of medical images is more complex, with the characteristics of blurred target boundaries and poor contrast Liu et al. (Citation2023). Moreover, in biomedical tasks, it is usually impossible to obtain enough training samples to complete deep learning, resulting in insufficient data samples and large sample differences. U-Net provides new ideas for solving these problems Li and Zhao (Citation2015). The U-Net network is used in Ronneberger, Fischer, and Brox (Citation2015). The algorithm uses jump connection to segment medical images, and connects the up-sampling results in the expansion path with the output of the sub-module with the same resolution in the contraction path as the input of the next sub-module in the expansion path. The deep features of the target are learned and combined with the subsequent layer features to retain the high-resolution features Shan et al. (Citation2018); Huang et al. (Citation2017), but the segmentation difficulties caused by boundary blurring, extreme imbalance of data categories and small ROI cannot be completely overcome Yang, Lai, and Yu (Citation2020).
In this paper, the CenterNet Duan et al. (Citation2019) is used to detect the target area of the root canal treatment and filling image of the actual patient, and then the U-Net full convolutional neural network is used to segment the root canal filling area, the tooth boundary, and the boundary between the tooth and the soft tissue according to the detection results. Finally, according to the multi-evaluation index of the professional doctor, the segmented image is quantitatively evaluated for the root canal treatment effect and the filling effect. In the process of quantitative evaluation, several scoring items were selected to evaluate the quality of root canal treatment and the image quality of filling teeth. Both the quality of the photos and the quality of the treatment were evaluated. It can better judge whether the doctor ‘s operation process meets the requirements and whether the operation effect is good. Our main contributions are as follows:
For real patient images of root canal therapy and filling, a deep learning convolutional neural network is used to segment the root canal filling area, tooth boundary, and tooth and soft tissue boundary.
The segmented images were quantitatively evaluated according to the multiple evaluation indexes of professional doctors.
The method in this paper unifies the evaluation criteria of dental treatment quality, which can better complete the scoring of dental treatment quality of patients, effectively improve the work efficiency of doctors, and has reference significance for the application of artificial intelligence in the medical field.
Technical Route
The basic process of the dental treatment quality evaluation method combining deep learning and multi-index decomposition designed in this paper is shown in .
Figure 1. Dental treatment quality evaluation process.
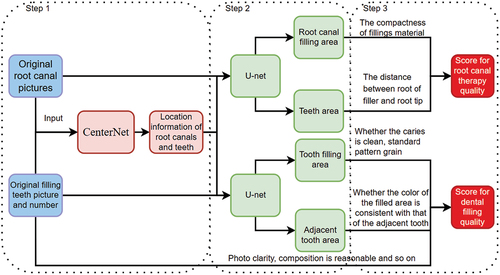
Step 1. Input the original tooth treatment image into the trained deep learning target detection network CenterNet to obtain the rectangular box position information of each root canal and tooth in the image;
Step 2. The original input image is cropped according to these position rectangles and then input into the corresponding trained deep learning segmentation network U-net to obtain the root canal filling area and its tooth area and the filled tooth area and its adjacent tooth area.
Step 3. According to the professional doctor’s multiple evaluation index of the quality of dental treatment were evaluated (including root canal treatment quality and filling teeth quality).
Tooth Target Detection Based on CenterNet
The core of the dental treatment quality evaluation method proposed in this paper is how to accurately segment the root canal filling area and the filled tooth area, so as to realize the evaluation of the dental treatment effect. However, the original image usually contains multiple teeth. If the original image is segmented directly, a large number of untreated areas will affect the segmentation results. Therefore, before the region segmentation of the original image, we need to detect the target of the original input image, that is, to find the position of the treated tooth in the whole image Liu, Peng, and Yan (Citation2022). This article uses the CenterNet to perform object detection on the original image.
CenterNet is a target detector without Anchor, which avoids manual design parameters and improves target detection accuracy while ensuring speed. CenterNet solves the problem of target detection from the perspective of semantic segmentation. Usually, the center point of the target contains rich target features, which is the most obvious response area on the feature map. Therefore, CenterNet uses the center point to describe the target, which is the center point of the object boundary box. The detector finds the center point by estimating the key points, and then obtains other object properties of the object by regression method. The CenterNet network includes three parts, namely encoder network, decoder network, and detection sub-network, as shown in . Encoding networks are commonly used backbone networks, such as ResNet He et al. (Citation2016), Hourglass Newell, Yang, and Deng (Citation2016), etc. The decoding network is an up-sampling network, which consists of multiple deconvolution layers. The network feature map samples one-fourth of the input image resolution from the 1/32 input image resolution output by the coding network. Since the detection is carried out on a large feature map, CenterNet does not adopt the strategy of multi-scale detection, but only detects directly on the feature map of the decoded network output. The detection sub-network after decoding network includes three parallel branches, which are used to output different predicted values. Among them, the center prediction sub-network outputs the thermal map of the target center point, the border prediction sub-network outputs the width and height of the corresponding center point, and the offset prediction sub-network outputs the offset of the center point.
Figure 2. CenterNet network structure.
The tooth target detection process based on CenterNet is as follows:
Step 1. Collection and annotation of tooth target detection data set. After collecting and sorting out the required tooth data, LabelImg labeling tool is used to label the root canal picture. Finally, the txt file containing the address of the labeled picture, the position information and type of the tooth rectangular box in the picture is generated by the program.
Step 2. Training tooth target detection model. The labeled data set obtained in step 1 is trained to obtain a neural network model for tooth target detection.
Step 3. Invoke network model prediction results. Call the tooth target detection convolutional neural network model obtained in step 2, enter the picture, and get the prediction result.
Dental Image Segmentation Method Based on U-Net
Dental target region segmentation is a key link in the quality evaluation of dental treatment, because the errors at this stage will spread to the subsequent processing stage, which will affect the evaluation of the effect of this dental treatment. This paper mainly uses the U-Net fully convolutional neural network to segment the root canal treatment image and the filling image, and obtains the root canal filling area and the corresponding tooth area and the filling in the root canal treatment image.
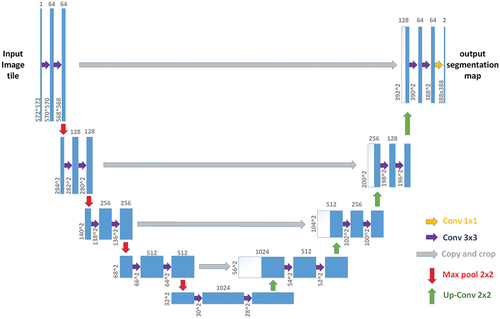
The U-net model is an improved FCN (full convolutional neural network, full convolutional neural network) structure proposed by Olaf Ronneberger et al. in 2015. Its structure is shown in . It is composed of the compression channel on the left side and the expansion channel on the right side, which is named because of its clear and elegant U-shaped structure Xu (Citation2018). The purpose of the compression channel is to obtain the characteristics of the input image, and its structure is repeated four times with two convolution layers and one max-pooling layer. The purpose of the extended channel is to gradually restore the image size to achieve the purpose of semantic segmentation Kuang and Wu (Citation2019). The structure is repeated four times by using two convolution layers and adding an Up-Conv (up-sampling-convolution combination) layer. Finally, two convolution layers are added as the output layer to reduce the dimension of the feature map to two dimensions. U-net not only restores the image position information but also stitches the low-level feature map and repeated convolutions, so that the model can easily obtain more accurate output feature map. The structure of the U-net network is also clearer and more intuitive. The number of layers can be freely deepened according to the data set. For example, when the input image is more complex, a more ideal model can be obtained by deepening the number of layers.
Figure 3. U-net network structure.
The tooth image segmentation process based on U-net is as follows (Here is an example of root canal therapy is taken as an example image is similar):
Step 1. Collect data and mark. The ROI (region of interest) was obtained by intercepting the image based on the position information of the tooth rectangular box. The labelme software was used to label the root canal image, and the contour of the root canal filling area and the tooth profile where it was located were labeled, respectively. Then, according to the json format file saved after labeling, the program was used to generate 8-bit color label map.
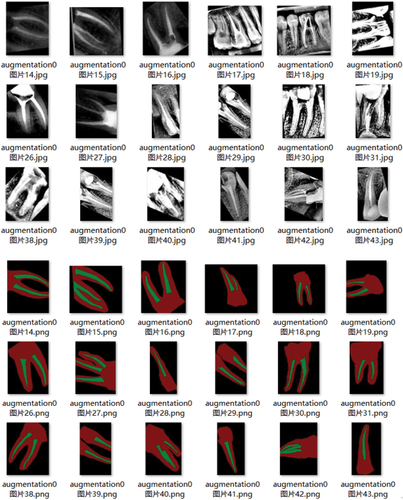
Step 2. Training root canal segmentation model. The ROI images obtained in the first step and the generated 8-bit color label images are enhanced. Some training samples are shown in . Finally, the U-net convolutional neural network is trained by the enhanced training image data, and the convolutional neural network model of tooth segmentation is obtained.
Figure 4. Root canal data set after data augmentation.
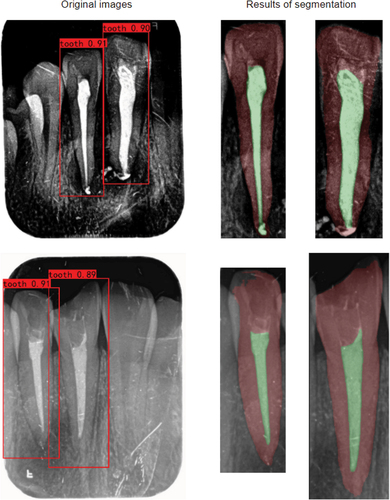
Step 3. Call the network model to predict the results. By calling the prediction results of the trained root canal segmentation convolution neural network model, the background of each pixel in the root canal image to be segmented, the segmentation mask of teeth and root canal filling area can be obtained. The gray value is the floating-point data with the value range of 0 to 1. Then according to each pixel each category mask gray value size, determine the pixel belongs to the type. The classification results were visualized on the root canal images to be segmented to complete the preliminary segmentation of root canal filling area and its teeth. The final segmentation effect is shown in .
Figure 5. Result of root canal image segmentation.
Design of Evaluation Rules
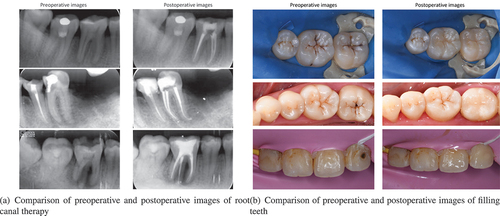
The dental treatment quality evaluation method designed in this paper mainly evaluates the quality of root canal treatment and the quality of filling teeth. The preoperative and postoperative images of root canal treatment and filling teeth are shown in .
Figure 6. Comparison of preoperative and postoperative images of root canal therapy and filling teeth.
At present, there is still a lack of unified evaluation criteria for the quality of dental treatment. Based on the references Gao and Dong (Citation2014); Peng et al. (Citation2020) and the long-term clinical recommendations of dentists in a dental clinic (Hubei Eya Medical Investment Management Co., Ltd.), several scoring items were selected, including two dimensions of photo quality and treatment quality, as shown in . The scoring items of the quality of the photos include the clarity of the photos, whether the composition is reasonable, whether it contains the teeth and the adjacent teeth; the scoring items of the quality of the treatment include whether the dental caries are clean, whether the area of the teeth is consistent with the color of the teeth, whether the area of the teeth is consistent with the color of the adjacent teeth, and whether there is standard grain. In practice, this evaluation system has been recognized by dental patients and has become the basis for KPI.
Figure 7. Scoring index graph of filling teeth.
Photo Quality
Photo quality score is used to evaluate the tooth picture itself, which does not involve the effect of filling teeth. High-quality photos are the basis to ensure the accuracy of the quality evaluation of the teeth, mainly including three scoring items: whether the photo contains key elements, whether the composition is reasonable and clear. Whether the photo contains the key element is that there should be a control tooth on both sides of the tooth. If the teeth are on the outermost side, the number of control teeth should not be less than 1. By judging whether there is a control tooth. Then, the adjacent teeth of the affected teeth were obtained, and the score of the index was calculated accordingly. Photo composition is reasonable refers to whether the filling teeth are in the center of the picture, whether the proportion of the filling teeth and adjacent teeth in the whole picture is 40–70%, and whether the angle of the teeth in the intraoperative and postoperative photos is consistent with the preoperative shooting. Photo definition mainly includes three requirements: file format, photo scale, and photo resolution. Read the photos in turn, get the file format, proportion, resolution, and other information, finally calculate the scores and count the total score.
Quality of Treatment
Whether the Caries Is Clean
Caries are cleaned up refers to whether the dental caries are cleaned up, the ideal situation is no caries area. If this area exists, it is evaluated from the depth and size of the caries area. First, the image of a single tooth is converted from the RGB color space to the gray space (representing the gray level with 8-bit binary numbers). Then, we find the pixels whose gray value is lower than a certain threshold (that is, suspected caries area) and count their number to represent the size of caries area. In addition, the lowest gray value in the region is obtained. Finally, the difference between the set threshold and the lowest gray value (expressed by decimal number) is calculated to represent the depth of the caries area.
Whether the Color of the Filled Area Is Consistent with That of the Tooth
Whether the color of the tooth is consistent with that of the tooth mainly refers to whether the color of the filling area in the postoperative picture is similar to that of the surrounding area? First of all, the area of the repaired tooth that has been segmented in the intraoperative image is scaled to the repaired tooth in the same proportion, and then the peripheral area of the repaired area is obtained by morphological expansion. Then, the mean values of their H and S in the HSV color space are calculated, respectively. Because the smaller the mean difference, the smaller the color difference, the index is scored according to the mean difference.
Whether the Color of the Filled Area Is Consistent with That of the Adjacent Tooth
Whether the color of the teeth is consistent with that of the adjacent teeth is to determine whether the color of the patch area in the postoperative picture is consistent with that of the adjacent teeth. Firstly, the regions of the segmented teeth were scaled to the teeth and adjacent teeth in the same proportion, and then the mean values of the H and S of the two regions were calculated, respectively, in the HSV color space. Then, the index was scored according to the mean difference.
Whether There Is a Standard Pattern Grain
Whether there is standard grain refers to whether the teeth in the postoperative picture have obvious standard gully lines (calculate the matching degree with the groove lines of the template teeth). First, the color image of a single tooth is divided and converted into a gray image. Then, an edge detection method based on Canny operator is used to obtain the grain characteristics of the tooth. Finally, the matching degree between the feature and the groove pattern of the template teeth is calculated, and then the index is scored according to the calculated matching degree.
Experimental Results and Analysis
Model Training
In this paper, the GPU server of Tesla T4 is used for training, and the specific experimental environment is shown in .
Table 1. The server environment used in the experiment.
In this paper, we use the Tensorflow framework for training. In order to accelerate the convergence of the network and reduce the training cost, we first pre-train the backbone feature extraction network of the model on ImageNet, then we import the weight of pre-training, and then use the 5733 images in the produced root canal segmentation data set for training, including 5160 training sets and 573 validation sets. During training, in order to avoid destroying the weight of pre-training, the backbone feature extraction network parameters are frozen first, and 30 epochs are trained with an initial learning rate of 0.001, and then the training after thawing is performed with an initial learning rate of 0.0001 to obtain the final detection model. Based on the configuration of the hardware environment, the batch size during the training process is set to 8, and the maximum number of iterations is 200. The learning rate is reduced: if the validation set loss of three consecutive epochs does not decrease, the learning rate is reduced to one-half of the original. After training for 135 epochs, the loss of the verification set no longer decreases, and the F1-score no longer increases. At this time, the mean Average Precision (mAP) can reach 94.0%, the mean Intersection over Union (mIOU) can reach 89.4%, and the F1-score can reach 94.59%.
Selection of Main Feature Extraction Network
In this paper, the scoring criteria of dental treatment are analyzed, and it is concluded that the scoring needs to detect and segment the root canal filling area, tooth area, adjacent tooth area, and so on. In order to improve the accuracy of root canal target detection, three kinds of backbone feature extraction networks commonly used in CenterNet network are tested and compared, and then the best backbone feature extraction network is selected to detect the related targets. In this paper, ResNet-50, ResNet-101, and Hourglass are selected as the backbone feature extraction networks of the model for training, and three network models are obtained. Then, the mean average precision (mAP) and the number of frames per second (FPS) of these three models were tested, respectively. The test set pictures were 132 untrained root canal pictures in the tooth target detection data set. The test results are shown in .
Table 2. Comparison of three main feature extraction networks.
As can be seen from the above table data, CenterNet-ResNet50 performs better than the other two models in terms of mAP and FPS. Finally, ResNet-50 is selected as the backbone feature extraction network of the model.
Comparison of Segmentation Effects
This paper uses U-net network to segment the dental images. The input image size of the U-net model in this paper is 128 × 128, and its structure adopts the form of convolution-pooling unit repeated four times, that is, there are a total of 23 convolutional layers (convolution kernel 3 × 3), 4 layers of max-pooling and 4 layers of UpSamping.
The final segmentation effect is shown in and compared with the marked watershed algorithm Guo et al. (Citation2022). The marked watershed algorithm is a traditional image segmentation method. You can clearly see the U-net network segmentation effect is better than the marker watershed. Specifically, there are two cases: [(1)]
Figure 8. The comparison of segmentation effect between marked watershed and U-net.
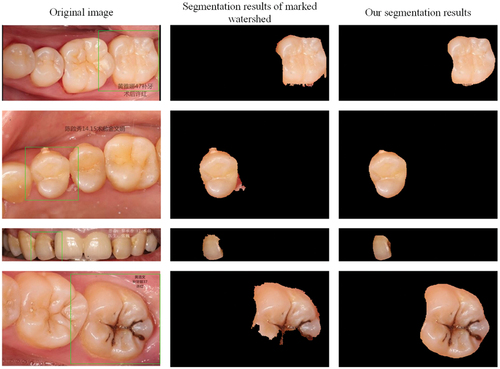
The contour obtained by U-net segmentation is smoother than the marker watershed and can more accurately segment the boundary between two teeth and the boundary between teeth and soft tissue, as shown in the first and second examples in the figure.
Marked watershed cannot segment the caries part of the patient ‘s filled teeth or cannot completely segment the filled teeth due to large-area caries, so it is difficult to obtain an ideal mask for the filled teeth area, while U-net is ideal for the segmentation of caries, as shown in the third and fourth examples in the figure.
The quality evaluation of dental treatment has higher requirements for the effect of tooth segmentation, and more attention is paid to whether the caries part can be accurately obtained. Therefore, in order to obtain a more ideal segmentation effect, this paper uses U-net deep learning network to segment the images of the filled teeth.
Construction of Dental Treatment Evaluation System
After completing the data analysis and obtaining a better prediction model, this paper further developed a dental treatment effect evaluation system through PyQt5. The system has a visual human-computer interaction interface, which is simple and intuitive to use, and has no threshold. The doctor only needs to upload the picture of the tooth to be evaluated, and the evaluation of the treatment effect of the tooth can be obtained immediately, as shown in .
Figure 9. Software scoring interface display.
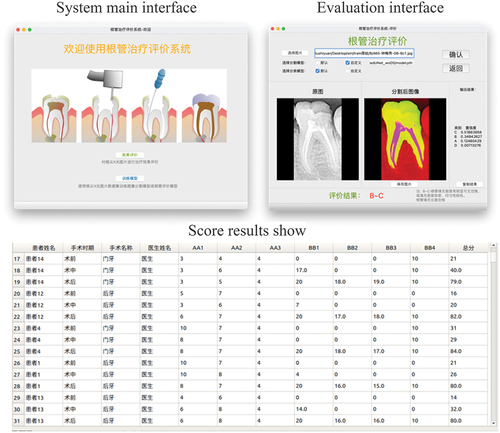
In the process of evaluating the quality of dental treatment, first of all, the user needs to select the folder to be evaluated, which contains one or more patient files. Each patient file has three photos (preoperative, intraoperative, and postoperative teeth) and a coordinate file (storing the position information of the filled teeth in the first three pictures). Then, click the Run button to start the dental treatment evaluation process. The program first determines whether the selected folder meets the requirements. If not satisfied (e.g., missing coordinate file), then print the error message. If satisfied, the dental treatment quality is evaluated, and the results are saved in a file. After traversing all patient images, the GUI reads the result file and displays it in a table.
This application can evaluate the patient ‘s dental treatment effect simply and quickly. We hope that this application can help more doctors to judge whether the dental treatment process meets the requirements in time and whether the treatment effect is good. On the other hand, doctors can also use the assistance of this application to develop the next treatment plan for patients.
Analysis of Evaluation Results
In order to verify the reliability of the method proposed in this paper, the scoring results of the algorithm for root canal therapy and filling teeth quality are compared with the scoring results of three professional doctors. We have done 300 sets of comparative experiments, and some results are shown in .
Table 3. Comparison of root canal treatment quality evaluation results.
Table 4. Comparison of dental filling quality evaluation results.
Table 5. Average time-consuming comparison of each picture.
According to the professional doctor’s advice, we divide the quality of root canal therapy into A, B, C three grades, the final total score above 90 points for A, 60 to 90 points for B, and less than 60 points for C, where A and B are qualified, and C is unqualified. In all the root canal images of the tested patients, the evaluation results of the algorithm were completely consistent with those of the three doctors (46.7% of the results were qualified or unqualified). Since professional doctors also mainly rely on experience to judge the root canal treatment effect, and the subjectivity is strong, the evaluation results of the three doctors are also different. Therefore, the evaluation results of the algorithm are consistent with the evaluation results of at least two doctors. It can be considered that the evaluation results of the algorithm are consistent with the artificial evaluation results. The final statistical algorithm and professional doctors on the root canal treatment quality evaluation coincidence rate reached 83.3%.
For the evaluation results of the quality of filling teeth, we divided them into three grades: A, B, and C according to the suggestions of professional doctors. The final total score was A above 90 points, B between 80 and 90 points, and C below 80 points. A and B are qualified, C is unqualified. According to the statistical evaluation results, the evaluation results of the algorithm in this paper are completely consistent with the evaluation results of three doctors (all qualified or unqualified), accounting for 39.3%, and 87.8% are consistent with the evaluation results of at least two doctors, that is, the coincidence rate between the evaluation of the quality of the teeth by the algorithm in this paper and the evaluation of the professional doctors is 87.8%.
According to the statistics of the test results, we found that when using this method, the average evaluation time of each picture is about 0.147 s, while the average evaluation time of each picture of the three professional doctors is 21.1 s. This method can save 20.9 s per image on average, that is, the evaluation efficiency is increased by nearly 144 times, which greatly improves the work efficiency of doctors.
Conclusion
This paper proposes a dental treatment quality evaluation method combining deep learning and multi-index decomposition, which can accurately evaluate the quality of root canal therapy and dental filling. In this paper, the CenterNet algorithm is used to detect the root canal and tooth area of the original input image for the real patient ‘s root canal treatment and filling image. Then, according to the detection results, the U-Net full convolutional neural network is used to segment the root canal filling area, tooth boundary, and the boundary between tooth and soft tissue. Compared with the traditional image segmentation method, it can more accurately segment the root canal contour and tooth contour, so as to improve the coincidence rate of evaluation. Finally, the effects of root canal therapy and dental filling were quantitatively evaluated according to the proposed professional evaluation indicators. In the process of quantitative evaluation, several scoring items were selected to evaluate the quality of root canal treatment and the image quality of filling teeth, both the quality of photos and the quality of treatment. The quality of treatment includes several scoring items such as the compactness of fillings material, the distance between the root of the filler and the root tip, whether the caries is clean, whether the filled tooth area is consistent with the color of the native tooth and the adjacent tooth, and whether there is a standard grain. It can better judge whether the tooth treatment process meets the requirements and whether the treatment effect is good. In this way, the evaluation standard of dental treatment quality is unified, and the effect of dental treatment can be quantitatively scored. The therapeutic effect of quantitative scoring can effectively improve the working efficiency of doctors and provide a good demonstration for “artificial intelligence + medical treatment.”
Availability of Data and Material
The datasets generated during and analyzed during the current study are not publicly available, but are available from the corresponding author on reasonable request.
Ethical Approval
Ethical approval declaration is not applicable to this work.
uaai_a_2351714_sm1335.bbl
Download (9.3 KB)uaai_a_2351714_sm1334.cls
Download (43.5 KB)Acknowledgements
Portions of this work were presented at the China Automation Congress in 2022, 22811192. (Liu J, Peng G, Yan S. An Intelligent Evaluation Method of Root Canal Therapy Quality Based on Deep Learning[C]//2022 China Automation Congress (CAC). IEEE, 2022: 6254-6259.)
Disclosure Statement
The authors declare that they have no known competing financial interests or personal relationships that could have appeared to influence the work reported in this paper.
Additional information
Funding
References
- Arunachalam, S., and G. Sethumathavan. 2022. An effective tumor detection in mr brain images based on deep cnn approach: I-yolov5. Applied Artificial Intelligence 36 (1):2151180. doi:10.1080/08839514.2022.2151180
- Duan, K., S. Bai, L. Xie, H. Qi, Q. Huang, and Q. Tian. 2019. Centernet: Keypoint triplets for object detection. Proceedings of the IEEE/CVF International Conference On Computer Vision, Seoul, South Korea, 6569–20.
- Gao, X., and Y. Dong. 2014. Technical guidelines for root canal therapy. Chinese Journal of Stomatology 49:272–74.
- Guo, Q., Y. Wang, S. Yang, and Z. Xiang. 2022. A method of blasted rock image segmentation based on improved watershed algorithm. Scientific Reports 12 (1):1–21. doi:10.1038/s41598-022-11351-0
- He, K., X. Zhang, S. Ren, and J. Sun. 2016. Deep residual learning for image recognition. Proceedings of the IEEE conference on computer vision and pattern recognition, Las Vegas, NV, USA, 770–78.
- Huang, G., Z. Liu, L. Van Der Maaten, K. Q. Weinberger, 2017. Densely connected convolutional networks. Proceedings of the IEEE conference on computer vision and pattern recognition, Honolulu, HI, USA, 4700–08.
- Jin, G., C. Liu, and X. Chen. 2022. An efficient deep neural network framework for COVID-19 lung infection segmentation. Information Sciences 612:745–58. doi:10.1016/j.ins.2022.08.059
- Kuang, H., and J. Wu. 2019. Overview of image semantic segmentation technology based on deep learning. Computer Engineering and Applications 55:12–21.
- Ling, C. J., T. Zeng, and V. S. Dhaliwal. 2023. Machine learning-based segmentation of images to diagnose the orthopedic diseases and to guide the orthopedic surgeries. Soft Computing 1–12. doi:10.1007/s00500-023-08503-3
- Liu, H., G. Huo, Q. Li, X. Guan, and M. L. Tseng. 2023. Multiscale lightweight 3d segmentation algorithm with attention mechanism: Brain tumor image segmentation. Expert Systems with Applications 214:119166. doi:10.1016/j.eswa.2022.119166
- Liu, J., G. Peng, and S. Yan. 2022. An intelligent evaluation method of root canal therapy quality based on deep learning. 2022 China Automation Congress (CAC), Xiamen, 6254–59. IEEE.
- Li, F., and X. Zhao. 2015. Nasal cavity and paranasal sinuses tumor segmentation algorithm based on d-unet neural network. 234–41.
- Newell, A., K. Yang, and J. Deng. 2016. Stacked hourglass networks for human pose estimation. European conference on computer vision, Amsterdam, the Netherlands, 483–99. Springer.
- Peng, G., F. Yan, H. Wang. 2020. The quality assessment method and device of filling teeth.
- Rong, M., C. Wang, and Z. Sun. 2021. Automatic segmentation of liver and tumor ct images based on window optimization technology. Application Research of Computers/Jisuanji Yingyong Yanjiu 38 (7):2220–2224+2230.
- Ronneberger, O., P. Fischer, and T. Brox. 2015. U-net: Convolutional networks for biomedical image segmentation. International Conference on Medical image computing and computer-assisted intervention, Munich, Germany, 234–41. Springer.
- Shan, H., Y. Zhang, Q. Yang, U. Kruger, M. K. Kalra, L. Sun, W. Cong, and G. Wang. 2018. 3-d convolutional encoder-decoder network for low-dose ct via transfer learning from a 2-d trained network. IEEE Transactions on Medical Imaging 37 (6):1522–34. doi:10.1109/TMI.2018.2832217
- Singh, N. K., and K. Raza. 2022. Progress in deep learning-based dental and maxillofacial image analysis: A systematic review. Expert Systems with Applications 199:116968. doi:10.1016/j.eswa.2022.116968
- Wang, X., and L. Zhang. 2019. Evaluation of CBCT image system in root canal therapy. China Foreign Medical Treatment 38 (20):186–188.
- Xu, H., 2018. Method research of high resolution remote sensing imagery classification based on U-Net model of deep learning. Ph.D. thesis. Chendu: Southwest Jiaotong University.
- Yang, G., Z. Lai, and D. Yu. 2020. An improved unet++ network for detecting melanoma skin lesions. Chinese Journal of Medical Imaging Technology 36:1877–81.
- Zhou, X., J. Yan, S. Xie. 2019. Systematic review of one-visit and multiple-visit root canal therapy for chronic periapical periodontitis. Chinese Journal of Geriatric Dentistry 17:75–79.