
 ?Mathematical formulae have been encoded as MathML and are displayed in this HTML version using MathJax in order to improve their display. Uncheck the box to turn MathJax off. This feature requires Javascript. Click on a formula to zoom.
Abstract
Smart manufacturing (SM) processes exhibit rapidly increasing complexity, nonlinear patterns in hyperdimensional spaces, high volumes of data, transient sources of variations, reduced lifetime, ultrahigh conformance, and non-Gaussian pseudo-chaotic behaviors. Standard quality control techniques and paradigms are not up to handling all these dynamics. Therefore, quality engineers went stagnant, with little innovation to offer to the manufacturing industry. Artificial intelligence (AI), particularly machine learning (ML) and deep learning (DL) have been applied to solve complex engineering problems and drive innovation. This new era where computer science principles are applied to quality control is called Quality 4.0 (Q4.0). However, the Six Sigma five-step problem-solving strategy (define, measure, analyze, improve, and control) does not fit the full ML cycle. The limitations of the Six Sigma techniques and paradigms in driving manufacturing innovation are discussed. A case study where a 3D quality pattern that can be easily detected by an MLA is not detected by traditional process monitoring methods. Early results motivate the development of the new era of Q4.0 without the limitations of Six Sigma and the potential of AI.
1. Introduction
The technologies of the fourth industrial revolution (I4.0), such as artificial intelligence (AI), industrial Internet of things (IIoT), and cloud storage and computing propel the new era of manufacturing: smart manufacturing (SM). The processes of SM exhibit rapidly increasing complexity, hyper-dimensional feature spaces, high volumes of data, transient sources of variation, reduced lifetimes, ultrahigh conformance, and non-Gaussian pseudo-chaotic behaviors. Unfortunately, traditional quality control techniques and paradigms do not handle all these dynamics Wuest, Irgens, and Thoben (Citation2013). Therefore, for the last decade, quality engineers went stagnant with little innovation to offer to the manufacturing industry (Zonnenshain and Kenett Citation2020), giving up leadership and strategic positions to data scientists.
Six Sigma methodologies have very high-quality standards in manufacturing. Most mature organizations have implemented statistical methods such as process monitoring charts to create high-conformance production environments. However, although processes only generate a few defects per million opportunities (DPMOs) in state-of-the-art manufacturing science, in reality, the process capability index benchmark across many industries is set at four sigma (Sharma, Rao, and Babu Citation2018; Sreenivasulu, Sunil, and G.V Citation2021). This sigma level generates 6,210 DPMOs (Deniz and Imen Citation2018; Fursule, Bansod, and Fursule Citation2012). Preventing or detecting these defects is one of the primary intellectual challenges posed to AI (Escobar, Arinez et al. Citation2020; Powell et al. Citation2022). Thus, developing an effective technical strategy enables manufacturing science to move to the next sigma level.
The industrialization of AI is currently a megatrend that dominates the business landscape. According to Goasduff (Citation2020) and NewVantage Partners (Citation2019), 92% of surveyed leaders are increasing their investments in big data (BD) and AI. Furthermore, according to an executive report from the IBM Institute for Business Value, quality control is the most cited priority for the application of this technology; that is, 66% of the surveyed executives expressed their interest in developing AI systems to improve product quality (IBM Citation2018).
Although manufacturing companies are rapidly adopting the technologies and paradigms of the I4.0 to create smart quality systems to preserve their competitiveness, their adoption has not “crossed the chasm” and moved beyond the early adopters. For example, two-thirds of the respondents of recent surveys believe that Q4.0 will significantly affect their operations within five years, whereas only 16% have started to implement a Q4.0 initiative; 20% of these respondents have begun planning for implementation; whereas 63% have not even reached the planning stage yet. Meanwhile, none of the respondents have yet done a full implementation (Küpper et al. Citation2019). This may be because leaders universally cite difficulties in developing a vision for AI (Ortega (Citation2018). In this context, the first successful end-to-end application of Q4.0 was reported a little later (Escobar, Macias et al. Citation2022).
Most senior quality engineers are not trained explicitly in AI at school and are not even recently graduated engineers. According to Forbes, the lack of powerful people is one of the biggest challenges facing these technologies in business (Marr Citation2017). Meanwhile, a Deloitte study found that 79% of young professionals have received training outside of formal school to acquire the necessary skills for I4.0 (Armstrong et al. Citation2018).
Therefore, successfully deploying Q4.0 requires much more than just accessing the new technologies. For example, the successful deployment rate of ML models across industries lies between 13% and 20% (Research 2018; Staff Citation2019). However, the current benchmarks of quality, conformance, innovation, and productivity in manufacturing set an even higher bar for new technologies (Prem Citation2019; Sharma, Rao, and Babu Citation2018; Venkatesh and Sumangala Citation2018) as the manufacturing industry has been innovating, advancing, and evolving since the beginning of the first industrial revolution.
According to Boston Consulting Group, companies must develop a portfolio of prioritized cases that align with the business imperative challenges, define a clear vision and roadmap, establish technology and data enablers, and close skills gaps (Küpper et al. Citation2019). Also, manufacturing companies can competitively position themselves among the most advanced and influential companies by successfully implementing Q4.0 practices, especially as SM projects a market worth $446.24 billion by 2029 (Redding Citation2022). The Q4.0 implementation process offers the opportunity for quality engineers to retake leadership positions. However, to successfully implement Q4.0 and realize its full potential, it is recommended that engineers, managers, and directors be AI trained. From a professional development perspective, once quality engineers have acquired the necessary skills, they must differentiate themselves from Six Sigma green/black belts to Q4.0 green/black belts (Escobar, Chakraborty et al. Citation2021). This distinction, along with their new skills, will help them move to more innovative roles.
The rest of this article is organized as follows: section 2 describes the AI effect on manufacturing innovation. Section 3 reviews Six Sigma. Then, section 4 reviews Q4.0 and presents an initiative supported by an evolved problem-solving strategy that guides its implementation. Section 5 contrasts both philosophies and highlights the advantages of the founding techniques of Q4.0 in manufacturing innovation. A virtual case study that supports this discussion is presented in section 6. Finally, section 7 concludes this research. summarizes the used acronyms.
Table 1. Acronym definitions.
2. Artificial intelligence innovation in manufacturing
Manufacturing is a key industry of the global economy, accounting for 10%–30% of the GDP in main industrialized countries (West and Lansang Citation2018). Innovation, which refers to changes in the production function and represents the driving force of economic development, is crucial to the manufacturing industry. Meanwhile, AI and ML are the driving forces of SM with the introduction of I4.0. SM needs innovative solutions to increase the quality and optimization of manufacturing activities, and AI-driven technologies are ready to promote and exploit new paradigms.
The importance of innovation and digitalization in products, services, and processes continues to grow. As AI and ML can handle high-dimensional problems and BD from all scientific sectors, they can help transform the economy and society. In manufacturing, computer science and engineering principles are merged to accomplish greater innovation, process and resource optimization, and quality improvement.
From a practical perspective, the United States, Europe, Japan, and China have produced results in AI and created advantages in their applications in various manufacturing sectors. These results are the consequence of initiatives and strategic plans at the national level. Thus, AI has become one of the main strategic directions for emerging internet technology companies, specifically in SM and innovation.
With digitalization, innovation is no longer a delimited phenomenon with a central locus of agency that is bound by space and time. Because of technological development and increasing computational power, AI has continually progressed from solving small tasks and well-specified objectives toward bigger tasks and more ambiguous or multi- faceted ends in social interaction, design, arts, science, or creativity and innovation.
AI forces innovation processes to challenge the foundations of existing products and services and shapes how research and development (R&D) works are organized (Cockburn, Henderson, and Stern Citation2018). The modular nature of digital technologies enables innovations by recombining existing elements. An AI solution to collecting and processing in one area can be used in a seemingly unrelated product/service. This has changed the mode of innovation and R&D into a more distributed and open process.
Access to information is a characteristic of innovation, where actions are continuously monitored/tracked, thereby increasing the speed and observability of the innovation process (Bogers et al. Citation2021). AI allows the sourcing, analysis, and recombination of information about process performance, product usage, and customer needs in novel ways.
The modes in which AI is implemented in R&D depend on the technological mindsets and skills among innovation employees, as what changing collective understandings about what innovation entails. A key factor that determines how AI influences socioeconomic growth is how the former affects innovation and the creation of knowledge.
AI is the use of ML, deep learning (DL), computer vision, and other technologies to imitate human skills through algorithmic processing. AI can thus learn, reason, perceive, and make decisions independently (Liu et al. Citation2020).
Coccia (Citation2017) defined technological innovation as a set of activities – one activity or several, simultaneously or temporally – that leads to new technology that increases productivity and produces exceptional added values when compared with other technology. Technological innovation is not independent; it depends on other innovations and coevolves through interaction with other innovation activities.
AI can impact the process of knowledge creation, spillovers, and the capability of learning and absorption of knowledge. The consequent effect on technological innovation is produced mainly through (1) expediting knowledge creation, (2) accelerating the spillover of knowledge/technology, (3) improving the capability of learning/absorption; and (4) increasing investments in R&D and talents (Liu et al. Citation2020).
There is a rise in AI-enabled approaches to improve prediction, design, and manufacturing control capabilities that take advantage of the recent trend in the digitalization of manufacturing and large-scale data acquisition platforms. There are cross-disciplinary research attempts to address critical manufacturing challenges with the potential to drastically alter the capabilities of these industries, including technological innovation. In this regard, AI methods provide an exciting alternative to many conventional computational methods in manufacturing (Mozaffar et al. Citation2022). Some examples of AI-based applications are described as references.
Additive manufacturing drives major innovations. For instance, recent advances in the field have enabled the 3D printing of biocompatible materials, cells, and supporting components in complex functional living tissues. 3D bioprinting involves additional complexities and technical challenges related to the sensitivity of living cells and tissue construction. Therefore, addressing these complexities requires the integration of technologies from various fields, including AI. 3D bioprinting has already been used for the generation and transplantation of various tissues, including multilayer skin, bone, vascular grafts, tracheal splints, cardiac tissue, and cartilaginous structures (Murphy and Atala Citation2014).
The deep integration of the application of new models, means, and forms ultimately forms ecosystems of intelligent manufacturing (IM) (Li et al. Citation2017; Li, Zhang, and Chai Citation2014): new models (internet-based, service-oriented, collaborative, customizable, flexible, and socialized IM system) + new means (human–machine integrated SM systems) + new forms: (IM ecology, ubiquitous interconnection, data-drivenness, cross-border integration, autonomous intelligence, and mass innovation).
With the current push for SM and I4.0, ML for manufacturing is experiencing unprecedented levels of interest. ML-based natural language processing techniques are employed to rapidly identify key areas of research and application. The current focus areas in ML applications are related to the manufacturing industry, with particular emphasis on cross-domain knowledge utilization (Sharp, Ak, and Hedberg Citation2018).
From sensory data to manufacturing intelligence, DL has attracted much attention as a breakthrough in computational intelligence. By mining knowledge from aggregated data, DL approaches play a key role in automatically learning from data, identifying patterns, and making decisions. Different levels of data analytics can be produced, including descriptive analytics, diagnostic analytics, predictive analytics, and prescriptive analytics (J. Wang et al. Citation2018).
3. Six Sigma
Six Sigma was developed in the 1980s by Motorola, one of the world’s leading manufacturers of electronics, and it became part of the company’s DNA. In 1988, Motorola won the first Malcolm Baldrige National Quality Award. In 1995, General Electric (GE), under Jack Welch (the former chief executive officer of GE), adopted Six Sigma from Motorola, and it became a corporate doctrine. The company invested more than one billion dollars to train thousands of employees, and the system was adopted by every GE business unit. In early 2000, GE surpassed Microsoft to become the world’s most valuable company (Stanley Citation2019).
One of the most important factors of the success of Six Sigma is the connection of each project to the bottom line (Chua and Janssen Citation2001). Six Sigma follows the define, measure, analyze, improve, and control (DMAIC) problem-solving strategy proposed by B. Smith, the “father” of Six Sigma (De Mast and Lokkerbol Citation2012), to solve quality problems. The DMAIC strategy is an effective continuous improvement cycle aimed at finding and reducing the hidden causes of variations in processes, studying root causes, identifying the most advantageous ways to remove variations, and testing and replicating solutions to similar problems. A Six Sigma conformance process generates 3.4 DPMO (Tennant Citation2017). However, as it has been discussed in Introduction, even today, many processes operate at a much higher defect rate.
A belt color convention that finds its roots in karate is used to describe a level of mastery of Six Sigma. A belt is obtained through a certification process, the most common levels are green, black, and master black belts (Stamatis Citation2019). Certified professionals become problem-solving experts, and they learn how to apply the DMAIC steps.
Six Sigma is founded on established quality-management tools, process improvement basic tools, and statistical methods (American Society of Quality Citation2022a; Basem Citation2008; George et al. Citation2004), such as the following:
Overall, they are great tools for deriving knowledge and solving problems asynchronously.
This means formulating the problem, generating data, applying the right tools, analyzing results, deriving knowledge, and generating a corrective action at different points in time. The DMAIC approach requires a lot of human involvement at every step of its implementation. Therefore, it is often biased by the quality engineer conducting the studies.
Some advantages of Six Sigma are: quality is improved, defects are reduced, only data analysis is needed, the revenue of the business is increased, strategy of the business processes could be motivated, and customer satisfaction is improved. However, Six Sigma has plateau, to achieve the next sigma level (5σ, 233 DPMOs) it is necessary to generate and integrate data from the whole value adding process and after-sales service into the Quality Control approaches, this was recognized early in Töpfer (Citation2008). A decade later, according to the IBM Institute for Business Value (IBM Citation2018), 66% of the surveyed executives expressed their interest in developing AI systems having the capacity to analyze data from the whole value adding process and after-sales service to identify causal factors that led to quality problems.
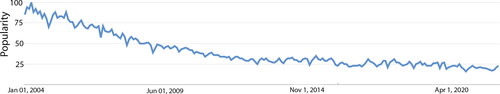
Today, Six Sigma is embedded with lean management (DeCarlo Citation2007), supply chain (Christopher and Rutherford Citation2004), and design (Basem Citation2008) to achieve synergized benefits. However, the abilities of the founding tools and Six Sigma paradigms have shown limitations in dealing with the challenges posed by SM, such as rapidly increasing complexity, hyperdimensional feature spaces, high volumes of data, transient sources of variations, reduced lifetime, ultrahigh conformance, and non-Gaussian pseudo-chaotic behaviors. Therefore, for the last decade, quality engineers went stagnant, with little innovation to offer to the manufacturing industry (Zonnenshain and Kenett Citation2020), as reflected in Google Trends ().
Figure 1. Google Trends, interest of Six Sigma from 2004 to 2022. Interest over time. The numbers represent the search interest relative to the highest point on the chart for the given region and time.
4. Quality 4.0
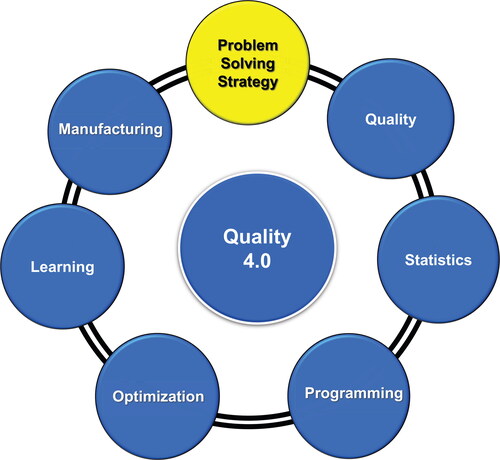
Q4.0 represents the fourth wave in the modern quality movement, considering (1) statistical quality control (SQC), (2) total quality management (TQM), (3) Six SigmaFootnote1, and (4) Quality 4.0. This quality philosophy is based on the statistical and managerial fundamentals of the previous philosophies, leveraging industrial big data (IBD), IIoT, and AI to solve completely new sets of complex engineering problems. The concept of Q4.0 is the next step for quality standards the “…pursuit for performance excellence” with digital transformation. Smart decisions are enabled through empirical learning, empirical knowledge discovery, and real-time data generation, collection, and analysis. As shown in , Q4.0 is founded on six areas of knowledge and an evolved problem-solving strategy (Escobar, Chakraborty et al. Citation2021).
Figure 2. Areas of knowledge of Q4.0.
Manufacturing generates more data than those of any other sector of the economy (Hartmann, King, and Narayanan Citation2015). This massive amount of observational data enables the creation of intelligent quality systems that can monitor and detect anomalies, defects, and faulty operating conditions in real time. Audio, video, imaging, and sensors are the most common devices used to obtain supporting data; collected data based on what is observed, not generated to find true cause-and-effect relationships (Montgomery Citation2017). In fact, disruptive technologies and machinery upgrades are not the creators of value in I4.0 (Wee et al. Citation2015), but instead the cognitive capabilities that are enabled by the combination of model-based definition and AI technologies.
Intense modeling is the foundation of Q4.0. Classification, clustering regression, or techniques (Murphy Citation2012) are applied to observational data generated by manufacturing processes to develop empirical models and derive empirical knowledge (Escobar, Abell et al. Citation2018; Escobar and Morales-Menendez Citation2018; Escobar, Arinez et al. Citation2022).
Real-time data generation, collection, analysis, and data analytics is one of the founding paradigms of Q4.0. According to Goncalves et al. (Citation2014), monitoring equipment and environmental conditions in a manufacture floor allows for diagnosis and analysis of the processes. The same equipment can be arranged in a network for monitoring process and performance, creating an identifiable and easy detection of problems in real-time (Oxford Analytica Citation2019). The business value of implementing real-time processing is the ability for instantaneous streaming of information (L′heureux et al. Citation2017), and this value has to prevail for a company to keep investing and developing new products and services.
The main research focus areas of Q4.0 are as follows (American Society of Quality (Citation2022b; Escobar, Morales-Menendez, Macias Citation2020; Radziwill Citation2018):
Detecting rare quality events
Predicting quality issues
Eliminating visual and manual inspections
Augmenting human intelligence
Increasing the speed and quality of decision making
Improving transparency, traceability, and auditability
Developing new business models
Whereas Six Sigma has made significant contributions in most of these research focus areas, eliminating manual and vision inspection using DL is one of the most important contributions of Q4.0 not studied by Six Sigma. The following subsection presents a Quality 4.0 initiative (binary classification) and an evolved problem solving strategy that guides its implementation.
4.1. Binary classification of quality – a Quality 4.0 initiative
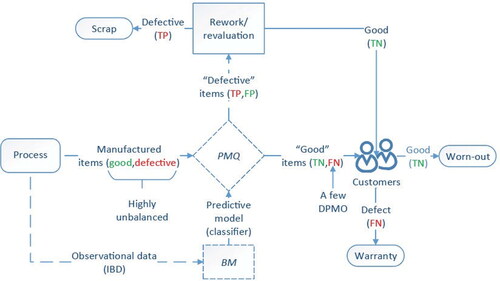
Although most processes generate only a few dozens or hundreds of DPMO in today’s manufacturing standards, customers expect perfect quality. A few warranty events can make the difference between profit and loss. This section describes one of the most relevant initiatives of Q4.0: Process Monitoring for Quality (PMQ). It is a blend of real-time process monitoring and quality control (Abell et al. Citation2017). Among its main objectives is rare quality event detection. Defect detection is formulated as a binary classification problem (good versus defective quality):
(1)
(1)
In this formulation, a positive quality label refers to a defective manufactured item, which is negative otherwise. The confusion matrix summarizes the predictive ability of a classifier ().
Table 2. Confusion matrix.
A classifier can commit FP (type-I, α) and FN (type-II, β) errors (Devore Citation2015). In the context of the binary classification of quality, FP occurs when a classifier assigns a good quality label to a defective item, whereas FN occurs when a defective item is labeled as good.
shows a state-of-the-art process controlled PMQ. In this application, observational (i.e. empirical) data are used to train a classifier following the big models (BM) learning paradigm (Escobar, Abell et al. Citation2018). A set of ad-hoc techniques that addresses the most relevant challenges posed by IBD was applied for quality control. Although both errors are significant, FNs are predominantly more important as failing to detect them results in a warranty event, whereas FPs can be reevaluated at an inspection station at a minimum cost and can continue in the value-adding process. However, too many FPs generate hidden factory effects (e.g. inefficiencies) (Miller and Vollmann Citation1985).
Figure 3. PMQ scheme.
4.2. A problem solving strategy for Quality 4.0
PMQ uses an evolved problem-solving strategy: Identify, Acsensorize, Discover, Learn, Predict, Redesign, and RelearnFootnote2 (Escobar, McGovern, Morales-Menendez Citation2021). These seven steps guide the implementation of and increase its likelihood of success ():
Figure 4. PMQ problem solving strategy (Escobar, Macias et al. Citation2022).
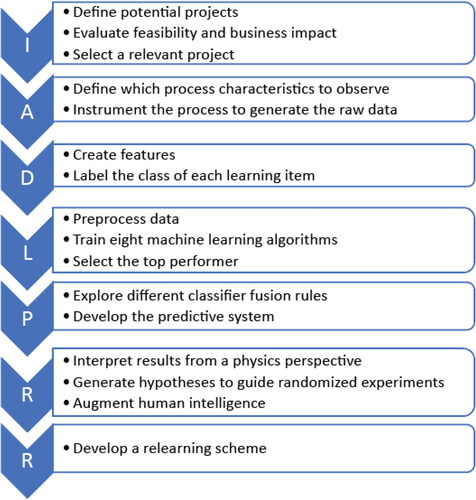
Identify: where each of the potential projects is evaluated to select high-value complex engineering problems. Each project is assessed using 18 questions, and a weighted project decision matrix is applied to identify the best projects (Escobar, McGovern, Morales-Menendez Citation2021). After the first filter, potential projects are assessed on the basis of data availability, business value, and chances of success. Finally, once a project has been selected, the learning targets are defined according to the α and β errors. These metrics define the feasibility of a solution.
Acsensorize: observe the process to generate raw empirical data to monitor the system using cameras or sensors (Abell et al. Citation2017; Oxford Analytica Citation2019).
Discover: create learning data by creating features and labels from raw empirical data (Boubchir, Daachi, and Pangracious Citation2017; Huan and Motoda Citation1998).
Learn: apply ML to develop several classifiers (Murphy Citation2012).
Predict: develop multiple classifier systems to optimize the prediction (Escobar, Macias, and Morales-Menendez Citation2021).
Redesign: derive engineering knowledge from the data mining results. This information is used to generate useful hypotheses about possible connections between the features and the quality of the product. Statistical analyses can be designed to establish causality, supplement and identify root-cause analyses, and identify optimal parameters to redesign the process (Escobar, McGovern, and Morales-Menendez Citation2021).
Relearn: develop a relearning strategy for the classifier to learn the new statistical distributions of classes. In ML, this is known as the concept of drift (H. Wang and Abraham Citation2015; Webb et al. Citation2017). This step specifies how retraining data are generated and how frequently the classifier is retrained. Typically, the plant dynamics are considered when developing a relearning strategy (Escobar, Abell et al. Citation2018).
As quality inspections are still widely used across manufacturing processes (less than 10% are automated; Belfiore Citation2016), are based on the real-time processing of data to control and monitor processes automatically. The primary objective of this application is to learn repetitive and simple concepts (currently made by visual inspectors) to accept/reject an item based on certain characteristics. A full description of the applications can be found in (Escobar, Wincek et al. Citation2018). The initiative focuses on detecting all DPMOs in a process not detected by traditional SPC/SQC systems to enable the creation of virtually defect-free processes through perfect detection (Escobar, Arinez, Morales-Menendez Citation2020).
4.3. Leading the implementation
The quality movement is in the middle of a paradigmatic transformation that requires full management attention. However, management is not prepared to lead this initiative. According to Brookings, only 17% of senior decision-makers in the United States are familiar with AI (West and Allen Citation2018). This is expected since when current senior executives went to school, a data scientist, ML, or AI degree rarely exists; they were areas of science particular to a specific discipline. Moreover, these areas are advancing very fast; only in 2021, about 150,000 research papers on AI were published in the United States, and 138,000 in China (Zandt Citation2022). Because of these dynamics, closing the gap between the state of the art of AI and the competencies of senior executives is a significant challenge.
The good news is that quality professionals do not need to learn all the AI techniques or be 100% up to date with the new MLAs to successfully implement a Q4.0 initiative. A basic understanding of the AI theory enable us to know when and how to apply the MLAs and, more importantly, when we should not. The following three subsections describe the implementation from strategic planning, training, and team development perspectives. They are based on references, empirical evidence, and the author’s experience leading the implementation of Q4.0 across different companies.
4.3.1. The strategy
Since quality control is the most cited priority for applying AI in manufacturing (IBM Citation2018), Q4.0 should be at the core the company’s AI strategic planning. Successfully implementing Q4.0 requires much more than just accessing new technologies, generating data, and fitting a model. It is necessary to understand and address many managerial and practical challenges (Armstrong et al. Citation2018; Escobar, McGovern, and Morales-Menendez Citation2021; Küpper et al. Citation2019; Lee Citation2020). The following steps are critical for the successful implementation of Q4.0:
Develop a vision and road map.
Train quality professionals in the new technologies.
Allocate budget for new technologies.
Learn how to identify winning projects.
Define a strategy for digitization and data generation.
Understand the limitations of AI.
Consider if outsourcing would save money and complete projects quickly while in-house expertise is developed.
The Q4.0 strategic planning should address the business imperatives in the short, mid, and long terms. In a short term, it is essential to find “quick-win” projects to build trust and obtain support from C-levels. We consider that the successful deployment rate of ML models across industries lies between 13% and 20% (Research 2018; Staff Citation2019). In this context, projects are not independent of each other; the funding and support of future projects highly depend upon the value generated by the previous ones. Therefore, mid- to long-term projects can be more complex and innovative (game changers) as they have a higher risk. Training the quality professionals in the new technologies and creating teams with the required knowledge addresses most of the critical steps for successful implementation of Q4.0.
4.3.2. The certifications
Quality professionals do not need to go to school to obtain a master’s or Ph.D. to learn new technologies. We have good analytical skills that allow us to discover and learn the latest technologies promptly. Q4.0 certifications are a good option for engineers to skill up while working full time and swiftly be able to take leadership in innovation. shows the recommended curricula (Escobar, Chakraborty et al. Citation2021; Quality Institute Citation2023) for learning binary classification of quality, the Q4.0 initiative described in this article.
Table 3. Quality 4.0 certifications curricula.
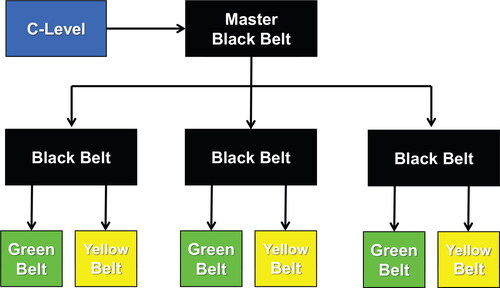
The level of competencies in Q4.0 is defined following the color convention of Karate. The higher the belt, the more strategic and technical knowledge is acquired. The recommended curriculum starts with a yellow belt; this belt covers many topics from a review perspective. More advanced belts include more complicated technical issues.
The Yellow Belt curriculum helps quality professionals to understand the new paradigms, definitions, and building blocks of smart manufacturing and Q4.0. It provides an overview of the difference between traditional and Q4.0 methods. Green Belt includes basic machine learning theory, specific applications of binary classification of quality, and the 7-steps of the Q4.0 problem-solving strategy that guides its implementation (Section 4.2). The Black Belt curriculum includes more technical and advanced theory. The competencies in this certification allow the Black Belts to address real data challenges, such as missing entries, identify and remove irrelevant and redundant features, and determine the driving features of the system. Finally, the Master Black Belt program develops a tech-savvy professional with strong business acumen. This training program includes deep learning, which allows the Master Black Belt to lead or develop solutions aimed at eliminating visual tasks. This is one of the essential innovations in Q4.0.
Each Q4.0 certified professional has a role in the solution development process. The Yellow Belt helps to generate the samples and annotate the classes. The Green Belt solves simple ML problems guided by the Black Belt. The Black Belt, who has more advanced competencies: (1) mentors Yellow and Green Belts; (2) develops a list of projects with high potential business value and the likelihood of success; (3) optimizes the prediction ability of the classifiers; and (4) answers science questions, such as how many records are needed to train a model and how often the model needs to be retrained (develop a relearning strategy). Finally, the Master Black Belt: (1) mentors Black Belts; (2) is the liaison between the C-level and the Q4.0 teams; (3) prioritizes projects by defining what is needed by the business and what can be done with the leading-edge technology; (4) evaluates and recommends outsourcing options; and (5) identifies and guides technological investments around Q4.0. describes the Q4.0 hierarchy by belts.
Figure 5. Hierarchy by Q4.0 belts.
4.3.3. The team
Whereas the Black Belts and Master Black Belts take the lead in selecting and solving the correct problems, Q4.0 initiatives include many areas of knowledge () which are out of the scope of a quality professional. Therefore, it is essential to have the right set of skills within the Q4.0 team to deploy the initiative successfully. This section describes the critical team members and their contributions.
Master Black Belt, a manager that connects the business vision with the Q4.0 initiative.
Black Belt, the engineer that solves the technical aspect of each project (e.g. training the classifier).
Domain expert, an engineer with the first principle knowledge of the manufacturing process (e.g. welding process). This knowledge ensures that relevant data (e.g. signals) is created. Validates the models from an engineering perspective. This knowledge is also used to connect data-driven discoveries with engineering to redesign the process.
Digital signal engineer, take real-world signals such as video, voice, pressure, audio, or temperature digitized and then mathematically manipulate them to create the features needed by the MLA.
Data engineer, prepare and organize the data in databases and other formats. They make data available to the black belts by developing, testing, and maintaining data pipelines and data architectures. Thus, the black belt can focus on the core of the innovation, solving the problem.
Machine Learning Operations (MLOps), work on automating and deploying the ML solution across geographically dispersed plants.
Whereas there is not a universal best team, and the required competencies may vary by project, based on our experience, these six team members’ competencies would help develop a Q4.0 winning team.
5. Six Sigma versus Quality 4.0
Six Sigma is founded on statistics and experimental data, whereas Q4.0 is founded on ML and observational data. The former draws population inferences from a sample, whereas the latter finds generalized predictive patterns (Bzdok, Altman, and Krzywinski Citation2018). Comparative analyses between the two sciences, including their paradigms and how models are developed and validated, are presented in Stewart (Citation2019); Van Calster et al. (Citation2019); Shmueli et al. (Citation2017). The amount of data going into a Six Sigma problem is relatively small and highly relies on the first principle knowledge. The variables (features) are understood, patterns visualized, and cause–effect defined. If this leads to a physics-based solution that sustains over time, the Six Sigma approach is the best. However, if patterns exist in the hyperdimensional space, they cannot be seen and are often understood. If systems are constantly exposed to transient sources of variation, continuously learning the new patterns generated by these new sources would be a never-ending, inefficient task. Moreover, because of the time-to-market innovation pressure, there is sometimes no time to keep conducting studies to understand everything, so long as the process is under control (Escobar, Wincek et al. Citation2018). In the latter situation, writing a ML solution that automatically learns the transient patterns is the recommended option to monitor and control the quality of the process.
Traditional statistical methods for process monitoring are computationally intractable when dealing with BD (Qin (Citation2012). In light of these challenges, data-driven methods based on ML are better; they can automatically and adaptively learn new and complex patterns from BD with minimum human involvement (Said, Ben Abdellafou, and Taouali Citation2019; Tao et al. Citation2018). Moreover, ML can efficiently learn nonlinear patterns in hyperdimensional spaces. summarizes these differences. The following bullets deep-dive into five of the most relevant limitations and differences of the founding techniques and paradigms of Six Sigma concerning Q4.0Footnote3:
Table 4. Six Sigma versus Quality 4.0.
Artificial Neural Networks (ANN). This MLA has shown better predictive modeling and optimization performance than that of RSM (Ebrahimpour et al. Citation2008; Kaur et al. Citation2020). According to the universal approximation theorem, a feedforward ANN with a hidden layer containing sufficient neurons can approximate any continuous function to a reasonable accuracy level (Auer, Burgsteiner, and Maass Citation2008; Demuth et al. Citation2014). This provides an advantage over the limitations of the quadratic or cubic models used by RSM. Therefore, MLAs are better at learning complicated nonlinear relationships.
Curse of dimensionality.Footnote4 Traditional statistical modeling was designed for data with a few dozen input variables and sample sizes that would be considered small or moderate by current standards (Bzdok, Altman, and Krzywinski Citation2018). High-dimensional data (James et al. Citation2013) can highly affect these methods. Conversely, several MLAs can efficiently learn from high-dimensional data (Chen and Guestrin Citation2016; Darst, Malecki, and Engelman Citation2018; Ng Citation2004; Qi (Citation2012).
Computation time. There are two computational barriers to BD analysis: the data can be too big for a computer’s memory, and the computing task can take too long to generate results (C. Wang et al. Citation2016). Most traditional statistical methods were not developed considering these challenges. However, modern statistical methods have been created because of these challenges (C. Wang et al. Citation2016). Moreover, MLA have embedded computational efficiency concepts to enable computational feasibility when learning from BD, such as stochastic gradient descent (Demuth et al. Citation2014) and eXtreme Gradient Boosting (Chen and Guestrin Citation2016).
Vision systems. Shortly after DLN achieved superhuman performance on image and object recognition (He et al. Citation2016; Pak and Kim Citation2017), a survey conducted in 2016 showed that almost half of the respondents claimed that their inspections were mostly manual (Belfiore Citation2016). This was expected because DLN was not part of the quality tools and had not achieved proper recognition performance when the traditional quality philosophies were developed. Manual inspections are often subject to inherent operator biases (80% accuracy) (See Citation2015). Today, the development and application of vision systems for Quality Control is one of the most relevant research topics in hyper-automation (He et al. Citation2021; Silva et al. Citation2018; Villalba-Diez et al. Citation2019).
Control charts. These charts support the fault detection and diagnosis of industrial processes and production results. However, univariate control charts (Nelson Citation1984) cannot detect patterns in hyperdimensional spaces. Meanwhile, multivariate control charts, such as Hotelling’s T2 statistic and the Q-statistic, are calculated based on a model using the PCA, making it difficult for this method to identify the process variables that lead to quality problems (Qin Citation2012). In this regard, MLA can effectively learn patterns in hyperdimensional spaces and identify the driving variables of the process (Chandrashekar and Sahin Citation2014).
Problem solving strategy. The Six Sigma DMAIC methodology does not cover all the steps required to develop an ML-based solution. No step ensures a relearning strategy has been implemented to learn new patterns or transient sources of variation automatically. This is a big limitation as manufacturing systems are constantly changing. Therefore, solutions or models often do not sustain over time, and the Black Belt must keep addressing these changes. Therefore, a solution that can automatically learn new patterns is required to mitigate this situation (an adaptable system).
5.1. Prediction ability versus causal explanation
Q4.0 boosts the quality movement from a technological perspective, but it is important to understand one of the main limitations; since most ML applications are developed based on observational data, causation cannot be proved (Bathaee Citation2017; Domingos Citation2012). In this context, one of the most important tradeoffs quality engineers must be aware of, is posed by the prediction ability (accuracy) of a model versus its causal explanation (Shmueli Citation2010). This aspect should be considered from the beginning of the project, as it guides the solution process. For example, classification trees or logistic regression models are highly explainable, enabling causation efforts (Schneider, Hommel, and Blettner Citation2010; Thomas et al. Citation2008). But, classification trees are largely unstable and the logistic regression algorithm is limited to model linear relationships or linearly separable patterns, limiting their prediction ability.
Today, most prediction problems are solved using more advanced MLAs with the capacity to learn non-linear relationships that exist in hyper-dimensional spaces. The Kaggle winners chart is a good example of which MLAs have been the most successful solving real complex problems, and . summarizes the percentage of mentions in winner posts from 2011 to 2016, displays this information by yearFootnote5.
Figure 6. Kaggle winners.
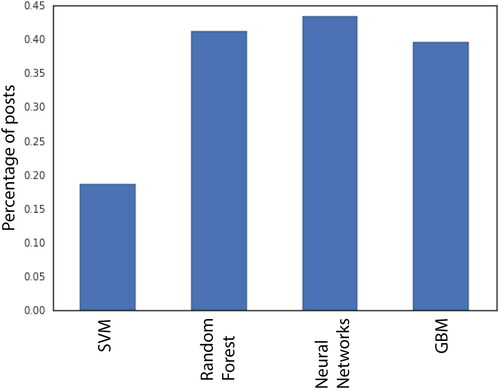
Figure 7. Kaggle winners.
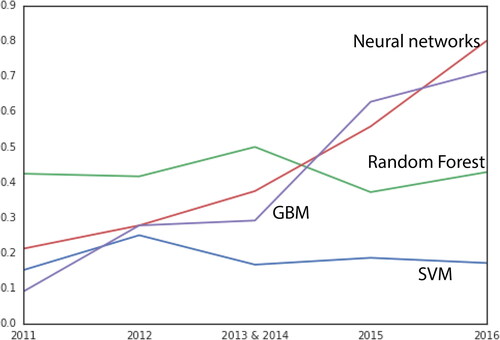
The SVM, random forest, neural networks, gradient boosting machines (GBM) are the most successful MLAs. In particular, the XGBoost algorithm is the best at solving structured problems using tabular data sets. Deep neural network architectures are the best for learning temporal and spatial patterns in unstructured data (e.g., images, signals) (Balas et al. Citation2019). Although these four MLAs can effectively learn complex nonlinear patterns, they do have one thing in common, they have little to no explainability. They are considered black boxes. In the context of Kaggle competitions, most of the solutions are evaluated based on their prediction ability.
In general, explainability is a desirable characteristic, as it increases model trust, enables causal analyses, and facilitate engineering approvals. However, Q4.0 applications have different explainability requirements. For example, there are projects in which the only goal is to replace a visual inspection aimed at determining if a critical component is present or not. In this application, a deep neural network architecture is trained based on images to replace the human inspection. Here, as long as the prediction is accurate, the model is deployed and no further engineering work is required to understand what is going on inside the network (by the way, this is not a core research area of Q4.0). On the other hand, there are projects in which – in addition of prediction – engineering knowledge discovery and root-cause analyses are important aspects of the solution. In these situations, it is important to start with simple algorithms, such as the logistic regression to see if the model meets the prediction criteria. However, if prediction is low, that means that the MLA cannot learn the underlying patterns and it should not be further used for any purpose. More advanced MLAs are recommended here to improve prediction.
Although the more advanced MLAs such as the random forest or XGBoost have low explainability, not everything is lost. During the learning process they keep track of the individual contribution of each feature in minimizing/maximizing the loss/fitness function (Chen and Guestrin Citation2016; Qi Citation2012). Therefore, at the end of the learning process, the most relevant features are identified. Again this information also enables causation efforts, (Montgomery Citation2017), even if it is derived from a black-box algorithm. Feature selection methods have been widely studied (Chandrashekar and Sahin Citation2014), and some of them are applied before the MLA (Escobar, Arinez et al. Citation2022).
5.1.1. Causation efforts supported by ML
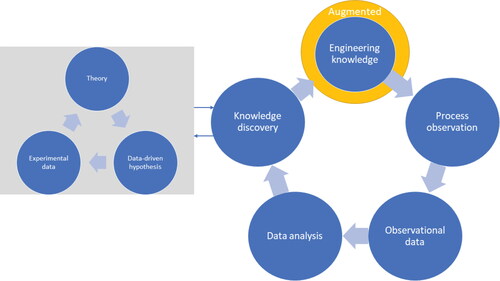
To put the above discussion into context and explain how ML supports the causation analyses of traditional methods, is presented. In the context of binary classification of quality, a ML data-driven solution is developed. First, engineering knowledge is used to install the devices that may generate the observational data needed to solve the problem. In the data analysis circle, ML methods are applied to develop the classifier, uncover hidden patterns, unknown correlations, and identify the driving features of the process. Then, the knowledge discovery circle connects the data-driven findings with traditional methods. Here, data-driven hypotheses are developed and tested us- ing experimental data. Results are used to generate theory, which is used to augment engineering knowledge and reach strong causation conclusions.
Figure 8. Data driven and ML methods supporting engineering knowledge discovery.
5.2. Trends
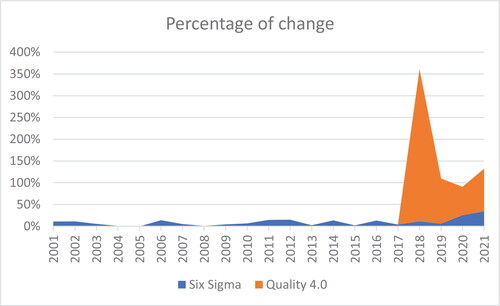
Over the last decade, the application of ML for quality control has attracted many researchers. Five years ago, the term Q4.0 was coined to describe the new era of quality in I4.0. Immediately thereafter, the number of published papers has significantly increased. shows the percentage of change in publications year over yearFootnote6. On another note, an increasing trend of Six Sigma papers in 2019–2021 has also been observed. Many of these papers focus on incorporating new technologies into Six Sigma.
Figure 9. Year-over-year percentage of change in publications by quality philosophy.
6. Case study
A virtual case studyFootnote7 is presented to illustrate how SPC charts, in some situations, may not detect patterns that exist in hyper-dimensional areas. In this respect, a defective pattern that exists in a 3D space is developed; three virtual features of sample size ten are created (including four defective items). They represent three continuous attributes observed to monitor the manufacturing process. The virtual feature values () are used to project each manufactured item into a 3D space to exhibit the quality pattern ().
Figure 10. 3D quality pattern. Green triangles denote good quality, and red circles denote a defective item.
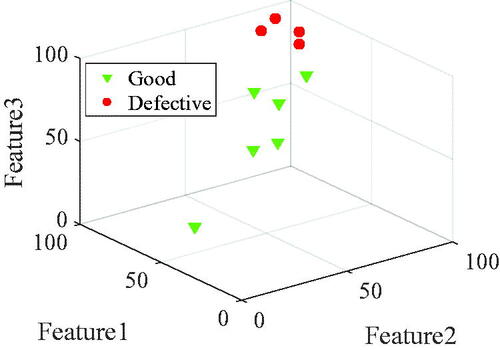
Table 5. Virtual feature values and the associated quality status of each sample.
For a better context, let us pretend that a welding process is monitored using univariate and multivariate control charts. In this context, the weld quality is defined by the tensile strengthFootnote8. Using engineering knowledge, three features are created from signals. Feature 1 is the maximum recorded welding temperature. Feature 2 represents the welding machine’s elapsed time, and Feature 3 is the summation of the acoustic signalFootnote9. The three virtual features are derived from each weld. The defective quality status is defined according to four warranty events as any control charts detected the quality pattern. In this context, the final product may be a battery. Here the batteries, including the defective welds, were returned. In the postmortem analysis, it was determined that the weld tensile strength was non-conforming. This information (i.e., quality status) was matched with the historical process information to generate the quality status ().
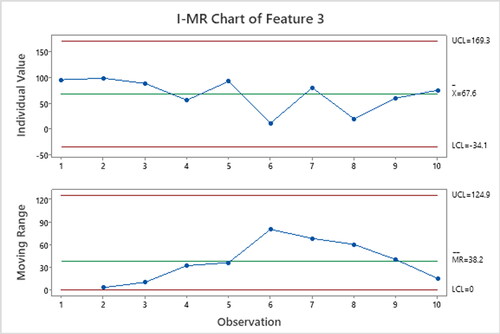
To compare how traditional quality control charts struggle to detect existing patterns, a comparison is made between control charts and using a simple MLA, in this case, SVM. shows the Minitab decision tree for selecting univariate control charts, depending on the data at hand. show the I-MR univariate control charts generated to monitor the process. These charts independently monitor each feature’s mean and variation (moving range). No chart exhibited a point out of control.
Figure 11. Decision tree for choosing a control chart (Minitab).
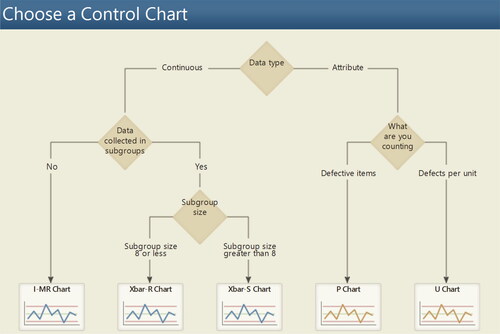
Figure 12. Control charts: I-MR univariate control chart – Feature 1.
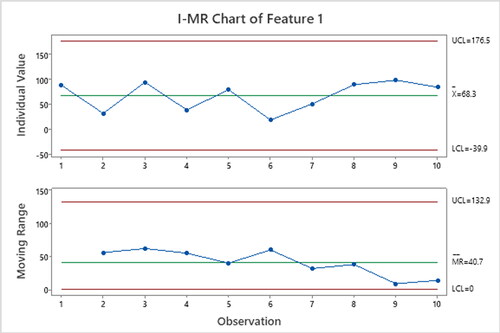
Figure 13. Control charts: I-MR univariate control chart – Feature 2.
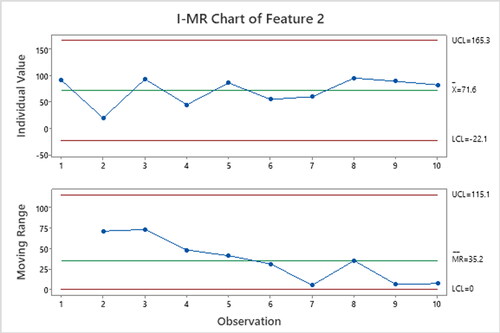
Figure 14. Control charts: I-MR univariate control chart – Feature 3.
Because the Six Sigma Black Belt was also interested in studying the combined effect of the three features, multivariate control charts were also generated. and show the multivariate Hotelling’s T2 and generalized variance control charts. They simultaneously monitored distances from the general mean and the process variability using the three features. The former method flagged item 6 and the latter item 2. Because the weld quality is evaluated based on a destructive test, both false positives were scrapped. Since the four defective welds, items 1, 3, 5, and 10 (from ), were never detected, they continued in the value-adding process, were sold, and finally became warranty events.
Figure 15. Control charts: Multivariate Hotelling’s T2 – Features 1–3.
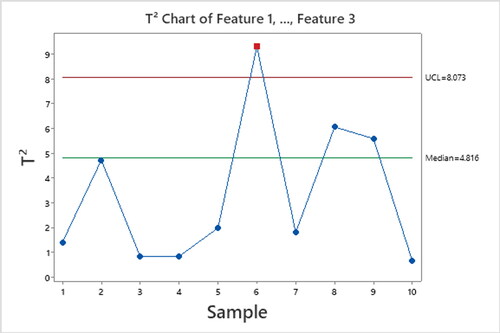
Figure 16. Control charts: Multivariate generalized variance control charts – Feature 1–3.
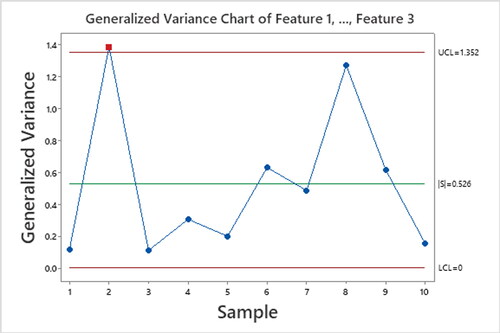
Although the 3D defective quality pattern is observed in , the control charts did not detect any defective items. Instead, the multidimensional charts created two false positives; two good-quality items were flagged as defectives during the manufacturing process.
This virtual case study, demonstrated how widely used traditional quality control methods, failed to detect all four defective items and generated two false positives. In summary, the quality control method generated four warranty events and two scraps. This could have been avoided, as this linearly separable pattern can be easily learned by a MLA, such as the SVM. Footnote10 shows the separating hyperplane learned by the SVM using a linear kernelFootnote11.
Figure 17. Linear separation scheme based on the support vector machine.
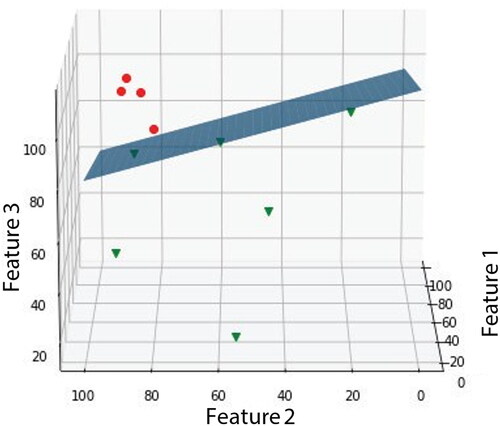
Using the same color convention of , the six good quality items projected into the 3D space are located below the hyperplane, whereas the defective items are above. Therefore, no FPs or FNs are committed. shows the confusion matrix. The classifier does not generate scraps or warranty events.
Table 6. Confusion matrix for this case study using SVM.
This is a straightforward numerical example for comparison, but accurate life quality monitoring involves high-dimensional data, more samples, and even missing data. As the data’s complexity increases, the need for new processes monitoring methods to control quality is needed. In this case study, the superiority of a MLA over traditional quality control methods is demonstrated.
7. Conclusions
Innovation projects in SM are driven by AI. Quality control is the most cited priority for applying this technology in manufacturing. A new term, Q4.0, has recently been coined to address the application of AI, one of the key technologies of I4.0. The first manufacturing companies to successfully deploy Q4.0 will competitively position themselves among the most advanced and influential companies in the world.
Although applying Six Sigma across manufacturing processes has led us to the high-conformance manufacturing era, its innovation capacity has already plateaued. Six Sigma’s founding techniques and paradigms are not up to the task of handling BD and the challenges posed by SM dynamics. Therefore, in the last decade, the quality profession went stagnant, with little innovation to offer to the manufacturing industry. Quality engineers can retake the lead because of their problem-solving abilities, business acumen, and strong quantitative reasoning. However, before this occurs, they must learn the basic theory of new areas of knowledge such as ML, computer science and programming principles, databases, and optimization. In this regard, certification programs and online courses are good starting points.
As demonstrated in the virtual case study, Q4.0 techniques and paradigms are more appropriate for driving innovation, solving complex problems, and modeling nonlinear patterns in hyper-dimensional spaces. Moreover, Q4.0 does not require a complete understanding of the underlying physics of the process to develop a quality control method. This feature alleviates the constant time-to-market pressures posed by innovation.
The digital transformation in manufacturing enables breakthrough innovations and the solution of engineering intractable problems. Q4.0 is the new era of quality that studies the application of the fourth industrial revolution technologies for quality control and improvement. One the most promising research focus areas of Q4.0 is the elimination of visual and manual inspection using DL. The leading-edge technology is ready, now is our turn to apply it and develop innovative solutions in manufacturing.
Q4.0 does not replace Six Sigma. Instead, it boosts the quality movement and sets a higher knowledge bar. Quality engineers should not need to choose between Six Sigma and Q4.0. They need to understand the nature of the problem at hand and the capabilities of each philosophy to find the most suitable approach and avoid over- complexity. The two concepts should work together cohesively, passing insights and wisdom back and forth.
We believe that the research community should be free from Six Sigma and should stop trying to fit the ML cycle into the DMAIC problem-solving strategy. The same situation happened with Six Sigma and TQM, where each philosophy stands alone with different agenda. Today, a new quality era has just begun, and it is up to us to shape it with new paradigms, problem-solving strategies, and tools without preconceived notions.
Additional information
Notes on contributors
Carlos A. Escobar
Carlos A Escobar is has a Ph.D. in Engineering Sciences at Tecnológico de Monterrey. He was a researcher and developer at General Motors Technical Center, Warren, MI, for over six years. He is a Research Scientist at Amazon Flex, Headquarters, Seattle, WA.
Daniela Macias-Arregoyta
Daniela Macias is pursuing a Master of Science in Manufacturing Systems at Tecnológico de Monterrey.
Ruben Morales-Menendez
Ruben Morales-Menendez has a Ph.D. in Artificial Intelligence. He is Dean of Graduate Studies at the School of Engineering and Sciences at Tecnológico de Monterrey. He belongs to the National Research System (Level II) and is a Mexican Academy of Sciences and Engineering member.
Notes
1 The design for Six Sigma and lean Six Sigma fall within the umbrella of Six Sigma and its problem-solving strategy.
2 If the task focuses at replacing a visual inspection using images and DL, only Identify, Acsensorize, and Learn are the steps required to develop the solution.
3 Authors recognize that significant modern advances in ML techniques were developed by the statistical community; therefore, this analysis is limited only to comparing the current state of AI techniques, such as DL and ML, with the founding techniques of the traditional quality philosophies (Basem Citation2008; Evans and Lindsay Citation2013; Stamatis (Citation2019).
4 The curse of dimensionality is the problem caused by the exponential increase in volume associated with adding extra dimensions to a Euclidean space. The error increases with the increase in the number of features. Patterns are harder to learn in high dimensions and often have exponential running time in the dimensions (Verleysen and Francois Citation2005).
6 Data was collected from Google Scholar. For example, the term Q4.0 was searched, and only papers with this specific term in the context of I4.0 were considered.
7 Whereas the virtual case study is inspired by a real situation that describes how historical process data is mapped to warranty events to train a classifier to detect these patterns, the three-dimensional pattern was developed by the authors to demonstrate the inability of control charts to detect simple patterns in hyper-dimensional spaces.
8 Tensile testing is a destructive method. It is a crucial step in process monitoring to evaluate weld performance and ensure that a finished weld is as strong or stronger than the base metal.
9 In actual applications, these features are not used to monitor the quality of a welding process. In this case study, they are just used to illustrate the concept.
10 The angle of this image is slightly different from to appreciate the SVM separating hyperplane.
References
- Abell, J., D. Chakraborty, C. Escobar, K. Im, D. Wegner, and M. Wincek. 2017. Big data driven manufacturing – process-monitoring-for-quality philosophy. ASME J of Manufacturing Science and Eng on Data Science-Enhanced Manufacturing 139 (10):1–12.
- American Society of Quality. 2022a. The seven basic quality tools for process improvement. //asq.org/quality-resources/seven-basic-quality-tools (accessed January 11, 2022).
- American Society of Quality. 2022b. Quality 4-0. //asq.org/quality-resources/quality-4-0 (accessed January 11, 2022).
- Armstrong, K., L. Parmelee, S. Santifort, J. Burley, and J. Van Fleet. 2018. Preparing tomorrow’s workforce for the 4th industrial revolution for business: A framework for action. London: Deloitte Touche Tohmatsu.
- Auer, P., H. Burgsteiner, and W. Maass. 2008. A learning rule for very simple universal approximators consisting of a single layer of perceptrons. Neural Networks: The Official Journal of the International Neural Network Society 21 (5):786–95. doi:10.1016/j.neunet.2007.12.036.
- Balas, V. E., S. S. Roy, D. Sharma, and P. Samui. 2019. Handbook of deep learning applications. Vol. 136. Edinburgh, Scotland: Springer, Cham.
- Basem, E.-H. 2008. Design for six sigma: A roadmap for product development. New York, NY, USA: McGraw-Hill Publishing.
- Bathaee, Y. 2017. The artificial intelligence black box and the failure of intent and causation. Harvard Journal of Law & Technology 31:889.
- Belfiore, M. 2016. Automation opportunities abound for quality inspections. Automation World. www.automationworld.com/products/software/article/13315584/automation-opportunities-abound-for-quality-inspections (accessed October 20, 2021).
- Bogers, M., R. Garud, L. Thomas, P. Tuertscher, and Y. Yoo. 2021. Digital innovation: Transforming research and practice. Innovation 24449:1–9.
- Boubchir, L., B. Daachi, and V. Pangracious. 2017. A review of feature extraction for EEG epileptic seizure detection and classification. Paper presented at 40th International Conference on Telecommunications and Signal Processing, Barcelona, Spain, 456–60. IEEE.
- Bzdok, D., N. Altman, and M. Krzywinski. 2018. Points of significance: Statistics versus machine learning. Nature Methods 15:233–34.
- Chandrashekar, G., and F. Sahin. 2014. A survey on feature selection methods. Computers & Electrical Engineering 40 (1):16–28. doi:10.1016/j.compeleceng.2013.11.024.
- Chen, T., and C. Guestrin. 2016. XGboost: A scalable tree boosting system. Paper presented at Proceedings of the 22nd International Conference on Knowledge Discovery and Data Mining, San Francisco, California, USA, August 13–17, 785–94.
- Christopher, M., and C. Rutherford. 2004. Creating supply chain resilience through agile Six Sigma. Critical Eye 7 (1):24–8.
- Chua, R., and A. Janssen. 2001. Six Sigma a pursuit of bottom-line results. European Quality 8 (3):12–15.
- Coccia, M. 2017. Theorem of not independence of any technological innovation – Philosophical and theoretical foundations of the evolution of technology. USA: Arizona State University, 29–35. https://ssrn.com/abstract=2971691
- Cockburn, I., R. Henderson, and S. Stern. 2018. The impact of artificial intelligence on innovation. National Bureau of Economic Research Working Paper Series 24449.
- Darst, B., K. Malecki, and C. Engelman. 2018. Using recursive feature elimination in random forest to account for correlated variables in high dimensional data. BMC Genetics 19 (Suppl 1):1–6. doi:10.1186/s12863-018-0633-8.
- De Mast, J., and J. Lokkerbol. 2012. An analysis of the Six Sigma DMAIC method from the perspective of problem solving. International Journal of Production Economics 139 (2):604–14. doi:10.1016/j.ijpe.2012.05.035.
- DeCarlo, N. 2007. The complete idiot’s guide to lean Six Sigma: Get the tools you need to build a lean, mean business machine. New York, USA: Penguin.
- Demuth, H., M. Beale, O. De Jess, and M. Hagan. 2014. Neural network design. Oklahoma, US: Martin Hagan.
- Deniz, S., and M. C. Imen. 2018. Barriers of Six Sigma in healthcare organizations. Management Science Letters 8 (9):885–90. doi:10.5267/j.msl.2018.6.009.
- Devore, J. 2015. Probability and statistics for engineering and the sciences. Boston, MA: Cengage Learning.
- Domingos, P. 2012. A few useful things to know about machine learning. Communications of the ACM 55 (10):78–87. doi:10.1145/2347736.2347755.
- Ebrahimpour, A., R. N. Z. R. A. Rahman, D. H. Ean Ch’ng, M. Basri, and A. B. Salleh. 2008. A modeling study by response surface methodology and artificial neural network on culture parameters optimization for thermostable lipase production from a newly isolated thermophilic Geobacillus sp. strain ARM. BMC Biotechnology 8 (1):1–15. doi:10.1186/1472-6750-8-96.
- Escobar, C., and R. Morales-Menendez. 2018. Process-monitoring-for-quality – A model selection criterion. Manufacturing Letters 15 (Part A):55–8. doi:10.1016/j.mfglet.2018.01.001.
- Escobar, C., J. Abell, M. Hern’andez-de-Menéndez, and R. Morales-Menendez. 2018. Process- monitoring-for-quality – Big models. Procedia Manufacturing 26:1167–79. doi:10.1016/j.promfg.2018.07.153.
- Escobar, C., M. Wincek, D. Chakraborty, and R. Morales-Menendez. 2018. Process-monitoring-for- quality – Applications. Manufacturing Letters 16:14–17. doi:10.1016/j.mfglet.2018.02.004.
- Escobar, C., J. Arinez, and R. Morales-Menendez. 2020. Process-monitoring-for-quality – A step forward in the zero defects vision. SAE Technical Paper 2020-01-1302. doi:10.4271/2020-01-1302.
- Escobar, C., R. Morales-Menendez, and D. Macias. 2020. Process-monitoring-for-quality – A machine learning-based modeling for rare event detection. Array 7:100034. doi:10.1016/j.array.2020.100034.
- Escobar, C., D. Chakraborty, M. McGovern, D. Macias, and R. Morales-Menendez. 2021. Quality 4.0 – Green, black and master black belt curricula. Procedia Manufacturing 53:748–59. doi:10.1016/j.promfg.2021.06.085.
- Escobar, C., D. Macias, and R. Morales-Menendez. 2021. Process monitoring for quality – A multiple classifier system for highly unbalanced data. Heliyon 7 (10):e08123. doi:10.1016/j.heliyon.2021.e08123.
- Escobar, C., M. McGovern, and R. Morales-Menendez. 2021. Quality – Challenges posed by big data in manufacturing. Journal of Intelligent Manufacturing 32:1–16.
- Escobar, C., J. Arinez, D. Macías Arregoyta, and R. Morales-Menendez. 2022. Process monitoring for quality – A feature selection method for highly unbalanced binary data. International Journal on Interactive Design and Manufacturing 16:1–16.
- Escobar, C., D. Macias, M. Mcgovern, M. Hernandez de Menendez, and R. Morales-Menendez. 2022. Quality 4.0 – An evolution of Six Sigma DMAIC. International Journal of Lean Six Sigma 5:1200–38.
- Evans, J., and W. Lindsay. 2013. Managing for quality and performance excellence. Mason, Ohio: Cengage Learning.
- Fursule, N. V., S. V. Bansod, and S. N. Fursule. 2012. Understanding the benefits and limitations of six sigma methodology. International Journal of Scientific and Research Publications 2 (1):1–9.
- George, M. L., J. Maxey, D. T. Rowlands, and M. Upton. 2004. Lean Six Sigma pocket toolbook. US: McGraw-Hill Professional Publishing.
- Goasduff, L. 2020. 2 Megatrends dominate the Gartner hype cycle for artificial intelligence. Gartner. www.gartner.com/smarterwithgartner/ (accessed February 15, 2021).
- Goncalves, G., J. Reis, R. Pinto, M. Alves, and J. Correia. 2014. A Step Forward on Intelligent Factories: A Smart Sensor-Oriented Approach. Paper presented at Proceedings of the 2014 IEEE Emerging Technology and Factory Automation (ETFA), Barcelona, Spain, September 16–19, 1–8.
- Hartmann, B., W. King, and S. Narayanan. 2015. Digital manufacturing: The revolution will be virtualized. McKinsey and Company. www.mckinsey.com/business-functions/operations/our-insights/digital-manufacturing-the-revolution-will-be-virtualized (accessed February 15, 2021).
- He, K., X. Zhang, S. Ren, J., and Sun, He. 2016. Deep residual learning for image recognition. Paper presented at Proceedings of the IEEE Conference on Computer Vision and Pattern Recognition, Southampton, United Kingdom, 770–8.
- He, Y., B. Deng, H. Wang, L. Cheng, K. Zhou, S. Cai, and F. Ciampa. 2021. Infrared machine vision and infrared thermography with deep learning: A Review. Infrared Physics & Technology 116:103754. doi:10.1016/j.infrared.2021.103754.
- Huan, L., and H. Motoda. 1998. Feature extraction, Construction and selection: A data mining perspective. USA: Kluwer Academic Publishers.
- IBM. 2018. The artificial intelligence effect on industrial products. www.ibm.com/downloads/cas/QGPNG37Y (accessed April 23, 2021).
- James, G., D. Witten, T. Hastie, and R. Tibshirani. 2013. An introduction to statistical learning. Vol. 112. New York, NY: Springer.
- Kaur, P., R. Gupta, A. Dey, T. Malik, and D. K. Pandey. 2020. Optimization of salicylic acid and chitosan treatment for bitter secoiridoid and xanthone glycosides production in shoot cultures of Swertia paniculata using response surface methodology and artificial neural network. BMC Plant Biology 20 (1):1–13. doi:10.1186/s12870-020-02410-7.
- Küpper, D., C. Knizek, D. Ryeson, and J. Noecker. 2019. Quality 4.0 takes more than technology. BCG. www.bcg.com/publications/2019/quality-4.0-takes-more-than-technology (accessed April 23, 2022).
- Lee, C. 2020. Database first vs intelligence first. Cupertino, CA: Falkonry Inc.
- Li, B., L. Zhang, and X. Chai. 2014. Smart cloud manufacturing (Cloud Manufacturing 2.0) – A new paradigm and approach of smart manufacturing. Paper presented at International Intelligent Manufacturing Conference, Beijing, China.
- Li, B., B. Hou, W. Yu, X. Lu, and C. Yang. 2017. Applications of artificial intelligence in intelligent manufacturing: A review. Frontiers of Information Technology & Electronic Engineering 18 (1):86–96. doi:10.1631/FITEE.1601885.
- Liu, J., H. Chang, J. Yi-Lin, F. Yi-Lin, and B. Yang. 2020. Influence of artificial intelligence on technological innovation: Evidence from the panel data of China’s manufacturing sectors. Technological Forecasting and Social Change 158:120142. doi:10.1016/j.techfore.2020.120142.
- L'Heureux, A., K. Grolinger, H. F. Elyamany, and M. A. M. Capretz. 2017. Machine learning with big data: Challenges and approaches. IEEE Access 5:7776–97. doi:10.1109/ACCESS.2017.2696365.
- Marr, B. 2017. The biggest challenges facing artificial intelligence (AI) in business and society. www. forbes. com/sites/bernardmarr/2017/07/13/the-biggest-challengesfacing-artificial-intelligence-ai-in-business-andsociety/3 (accessed April 28, 2022).
- Miller, J. G., and T. E. Vollmann. 1985. The hidden factory. Harvard Business Review. hbr.org/1985/09/the-hidden-factory (accessed October 20, 2021).
- Montgomery, D. 2017. Exploring observational data. Quality and Reliability Engineering International 33 (8):1639–40. doi:10.1002/qre.2243.
- Mozaffar, M., S. Liao, X. Xie, S. Saha, C. Park, J. Cao, W. K. Liu, and Z. Gan. 2022. Mechanistic artificial intelligence (mechanistic-AI) for modeling, design, and control of advanced manufacturing processes: Current state and perspectives. Journal of Materials Processing Technology 302:117485. doi:10.1016/j.jmatprotec.2021.117485.
- Murphy, K. 2012. Machine Learning: A Probabilistic Perspective. Cambridge, MA: MIT press.
- Murphy, S., and A. Atala. 2014. 3D bioprinting of tissues and organs. Nature Biotechnology 32 (8):773–85. doi:10.1038/nbt.2958.
- Nelson, L. 1984. The Shewhart control chart – Tests for special causes. Journal of Quality Technology 16 (4):237–9. doi:10.1080/00224065.1984.11978921.
- NewVantage Partners Releases. 2019. Big data and AI executive survey – How big data and AI are accelerating business transformation. https://www.businesswire.com/news/home/20190102005073/en/NewVantage-Partners-Releases-2019-Big-Data-and-AI-Executive-Survey (accessed October 20, 2021).
- Ng, A. 2004. Feature Selection L1 vs L2 Regularization and Rotational Invariance. Paper presented at Proceedings of the 21st International Conference on Machine Learning, Pasadena, California, USA , July 11–17, 78. ACM.
- Ortega, M. 2018. Cio survey: Top 3 challenges adopting AI and how to overcome them. Databricks. databricks.com/ (accessed November 28, 2021).
- Oxford Analytica. 2019. Sensors as drivers of Industry 4.0 – A study on Germany, Switzerland and Austria. www.oxan.com/insights/client-thought-leadership/ey-sensors-as-drivers-of-industry-40/ (accessed November 28, 2020).
- Pak, M., and S. Kim. 2017. A review of deep learning in image recognition. Paper presented at 4th International Conference on Computer Applications and Information Processing Technology, Kuta, Bali, Indonesia, 1–3. IEEE.
- Powell, D., M. Magnanini, M. Colledani, and O. Myklebust. 2022. Advancing zero defect manufacturing: A state-of-the-art perspective and future research directions. Computers in Industry 136:103596. doi:10.1016/j.compind.2021.103596.
- Prem, E. 2019. Artificial intelligence for innovation in Austria. Technology Innovation Management Review 9 (12):5–15. doi:10.22215/timreview/1287.
- Qi, Y. 2012. Random forest for bioinformatics. In Ensemble machine learning, eds. C. Zhang and Y. Q. Ma, 307–23. USA: Springer.
- Qin, S. 2012. Survey on data-driven industrial process monitoring and diagnosis. Annual Reviews in Control 36 (2):220–34. doi:10.1016/j.arcontrol.2012.09.004.
- Quality Institute. 2023. Quality 4.0 certifications. www.quality4.com (accessed October 10, 2022).
- Radziwill, N. M. 2018. Quality 4.0: Let’s get digital-the many ways the fourth industrial revolution is reshaping the way we think about quality (Preprint). arXiv, 1810.07829.
- Redding. 2022. Smart manufacturing market worth $446.24 billion by 2029 – Market size, share, forecasts, & trends analysis report with COVID-19. URL Bloomberg. www.bloomberg.com/press-releases/2022-05-11/smart-manufacturing-market-worth-446-24-billion-by-2029-market-size-share-forecasts-trends-analysis-report-with-covid-19 (accessed December 10, 2022).
- Research. 2018. Predicts 2019: Data and analytics strategy. emtemp.gcom.cloud/ngw/globalassets/en/doc/documents/374107-predicts-2019-data- and-analytics-strategy (accessed November 10, 2021).
- Said, M., K. Ben Abdellafou, and O. Taouali. 2019. Machine learning technique for data-driven fault detection of nonlinear processes. Journal of Intelligent Manufacturing 31 (4):1–20.
- Schneider, A., G. Hommel, and M. Blettner. 2010. Linear regression analysis: Part 14 of a series on evaluation of scientific publications. Deutsches ÄRzteblatt International 107 (44):776.
- See, J. 2015. Visual inspection reliability for precision manufactured parts. Human Factors 57 (8):1427–42. doi:10.1177/0018720815602389.
- Sharma, G., P. S. Rao, and B. S. Babu. 2018. Process capability improvement through DMAIC or aluminum alloy wheel machining. Journal of Industrial Engineering International 14 (2):213–26. doi:10.1007/s40092-017-0220-z.
- Sharp, M., R. Ak, and T. Hedberg. 2018. A survey of the advancing use and development of machine learning in smart manufacturing. Journal of Manufacturing Systems 48:170–9. doi:10.1016/j.jmsy.2018.02.004.
- Shmueli, G. 2010. To explain or to predict? Statistical Science 25 (3):289–310.
- Shmueli, G., P. C. Bruce, I. Yahav, N. R. Patel, and K. C. Lichtendahl. 2017. Data mining for business analytics: Concepts, techniques, and applications in R. Hoboken, NJ: John Wiley & Sons Inc.
- Silva, R., M. Rudek, A. Szejka, and O. Junior. 2018. Machine vision systems for industrial quality control inspections. Paper presented at IFIP International Conference on Product Lifecycle Management, Turin, Italy, July 2–4, 631–641. Springer.
- Sreenivasulu, R., Y. Sunil, and M. R. G.V. 2021. Study on application of Six Sigma in shoe manufacturing industry. International Journal of Research in Engineering and Science 9 (4):15–23.
- Staff, V. 2019. Why do 87% of data science projects never make it into production? venturebeat.com/ (accessed November 28, 2021).
- Stamatis, D. 2019. Six Sigma fundamentals: A complete introduction to the system, methods, and tools. Boca Raton, FL: CRC Press.
- Stanley, O. 2019. Whatever happened to Six Sigma? Quartz at work. //qz.com/work/1635960/whatever-happened-to-six-sigma/ (accessed July 23, 2021).
- Stewart, M. 2019. The actual difference between statistics and machine learning. towardsdatascience.com/the-actual-difference-between-statistics-and-machine-learning-64b49f07ea3 (accessed July 23, 2021).
- Tao, F., Q. Qi, A. Liu, and A. Kusiak. 2018. Data-driven smart manufacturing. Journal of Manufacturing Systems 48:157–69. doi:10.1016/j.jmsy.2018.01.006.
- Tennant, G. 2017. Six Sigma: SPC and TQM in manufacturing and services. Burlington, VT: Gower Publishing Company.
- Thomas, D. R., P. Zhu, B. D. Zumbo, and S. Dutta. 2008. On measuring the relative importance of explanatory variables in a logistic regression. Journal of Modern Applied Statistical Methods 7 (1):4.
- Töpfer, A. 2008. Lean Six Sigma: Erfolgreiche Kombination von Lean Management, Six Sigma und design for Six Sigma. Heidelberg, Germany: Springer.
- Van Calster, B., J. Y. Verbakel, E. Christodoulou, E. W. Steyerberg, and G. S. Collins. 2019. Statistics versus machine learning: definitions are interesting (but understanding, methodology, and reporting are more important). Journal of Clinical Epidemiology 116:137–8. doi:10.1016/j.jclinepi.2019.08.002.
- Venkatesh, N., and C. Sumangala. 2018. Success of manufacturing industries – Role of Six Sigma. MATEC Web of Conferences 144: 05002. doi:10.1051/matecconf/201814405002.
- Verleysen, M., and D. Francois. 2005. The curse of dimensionality in data mining and time series prediction. Paper presented at International Work Conference on Artificial Neural Networks, Barcelona, Spain, July 8–10, 758–70. Springer.
- Villalba-Diez, J., D. Schmidt, R. Gevers, J. Ordieres-Mer’e, M. Buchwitz, and W. Wellbrock. 2019. Deep learning for industrial computer vision quality control in the printing industry 4.0. Sensors 19 (18):3987. doi:10.3390/s19183987.
- Wang, C., M. Chen, E. Schifano, J. Wu, and J. Yan. 2016. Statistical methods and computing for big data. Statistics and Its Interface 9 (4):399–414. doi:10.4310/SII.2016.v9.n4.a1.
- Wang, H., and Z. Abraham. 2015. Concept drift detection for streaming data. International Journal of Conference on Neural Networks 1 (1):1–9.
- Wang, J., Y. Ma, L. Zhang, R. Gao, and D. Wu. 2018. Deep learning for smart manufacturing: methods and applications. Journal of Manufacturing Systems 48:144–56. doi:10.1016/j.jmsy.2018.01.003.
- Webb, G. I., L. K. Lee, F. Petitjean, and B. Goethals. 2017. Understanding concept drift (preprint). arXiv arXiv:1704.00362.
- Wee, D., R. Kelly, J. Cattell, and M. Breunig. 2015. Industry 4.0: How to navigate digitization of the manufacturing sector. McKinsey Digital. www.mckinsey.com//Industry-40-How-to-navigate-digitization-of- the-manufacturing-sector.ashx (accessed January 11, 2022).
- West, D., and J. Allen. 2018. How artificial intelligence is transforming the world. Brookings. www.brookings.edu/research/how-artificial-intelligence-is-transforming-the-world/ (accessed February 15, 2021).
- West, D., and C. Lansang. 2018. Global manufacturing scorecard: How the US compares to 18 other nations. Vol.10. Washington, DC: Brookings Institution.
- Wuest, T., C. Irgens, and K. Thoben. 2013. An approach to quality monitoring in manufacturing using supervised machine learning on product state based data. Journal of Intelligent Manu Facturing 4 (1):23–45.
- Zandt, F. 2022. China’s race towards AI research dominance. Hamburg, Germany: Statista.
- Zonnenshain, A., and R. Kenett. 2020. Quality 4.0 – The challenging future of quality engineering. Quality Engineering 32 (4):614–26. doi:10.1080/08982112.2019.1706744.